Free Statistics
of Irreproducible Research!
Description of Statistical Computation | |||||||||||||||||||||
|---|---|---|---|---|---|---|---|---|---|---|---|---|---|---|---|---|---|---|---|---|---|
| Author's title | |||||||||||||||||||||
| Author | *Unverified author* | ||||||||||||||||||||
| R Software Module | rwasp_backtobackhist.wasp | ||||||||||||||||||||
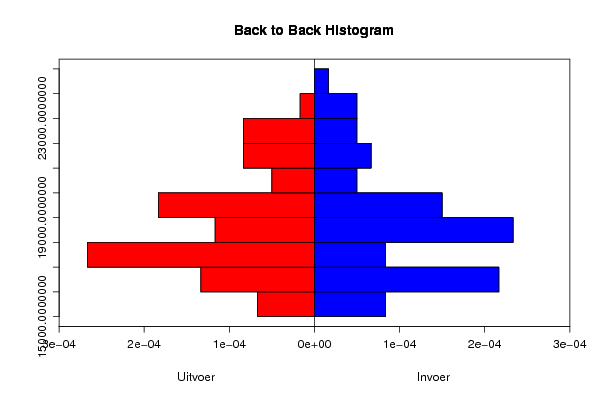
| Title produced by software | Back to Back Histogram | ||||||||||||||||||||
| Date of computation | Sat, 14 Nov 2009 10:08:46 -0700 | ||||||||||||||||||||
| Cite this page as follows | Statistical Computations at FreeStatistics.org, Office for Research Development and Education, URL https://freestatistics.org/blog/index.php?v=date/2009/Nov/14/t1258218574yauwwx7nc40fl35.htm/, Retrieved Sun, 28 Apr 2024 04:46:30 +0000 | ||||||||||||||||||||
| Statistical Computations at FreeStatistics.org, Office for Research Development and Education, URL https://freestatistics.org/blog/index.php?pk=57243, Retrieved Sun, 28 Apr 2024 04:46:30 +0000 | |||||||||||||||||||||
| QR Codes: | |||||||||||||||||||||
|
| |||||||||||||||||||||
| Original text written by user: | |||||||||||||||||||||
| IsPrivate? | No (this computation is public) | ||||||||||||||||||||
| User-defined keywords | |||||||||||||||||||||
| Estimated Impact | 190 | ||||||||||||||||||||
Tree of Dependent Computations | |||||||||||||||||||||
| Family? (F = Feedback message, R = changed R code, M = changed R Module, P = changed Parameters, D = changed Data) | |||||||||||||||||||||
| - [Back to Back Histogram] [3/11/2009] [2009-11-02 21:58:53] [b98453cac15ba1066b407e146608df68] - R PD [Back to Back Histogram] [Back to back hist...] [2009-11-12 14:53:09] [54d83950395cfb8ca1091bdb7440f70a] - PD [Back to Back Histogram] [Uitvoer - Invoer] [2009-11-14 17:08:46] [d41d8cd98f00b204e9800998ecf8427e] [Current] | |||||||||||||||||||||
| Feedback Forum | |||||||||||||||||||||
Post a new message | |||||||||||||||||||||
Dataset | |||||||||||||||||||||
| Dataseries X: | |||||||||||||||||||||
17823.2 17872.0 17420.4 16704.4 15991.2 16583.6 19123.5 17838.7 17209.4 18586.5 16258.1 15141.6 19202.1 17746.5 19090.1 18040.3 17515.5 17751.8 21072.4 17170.0 19439.5 19795.4 17574.9 16165.4 19464.6 19932.1 19961.2 17343.4 18924.2 18574.1 21350.6 18594.6 19823.1 20844.4 19640.2 17735.4 19813.6 22160.0 20664.3 17877.4 20906.5 21164.1 21374.4 22952.3 21343.5 23899.3 22392.9 18274.1 22786.7 22321.5 17842.2 16373.5 15993.8 16446.1 17729.0 16643.0 16196.7 18252.1 17570.4 15836.8 | |||||||||||||||||||||
| Dataseries Y: | |||||||||||||||||||||
16629.6 16670.7 16614.8 16869.2 15663.9 16359.9 18447.7 16889.0 16505.0 18320.9 15052.1 15699.8 18135.3 16768.7 18883.0 19021.0 18101.9 17776.1 21489.9 17065.3 18690.0 18953.1 16398.9 16895.6 18553.0 19270.0 19422.1 17579.4 18637.3 18076.7 20438.6 18075.2 19563.0 19899.2 19227.5 17789.6 19220.8 21968.9 21131.5 19484.6 22168.7 20866.8 22176.2 23533.8 21479.6 24347.7 22751.6 20328.3 23650.4 23335.7 19614.9 18042.3 17282.5 16847.2 18159.5 16540.9 15952.7 18357.8 16685.6 15799.5 | |||||||||||||||||||||
Tables (Output of Computation) | |||||||||||||||||||||
| |||||||||||||||||||||
Figures (Output of Computation) | |||||||||||||||||||||
Input Parameters & R Code | |||||||||||||||||||||
| Parameters (Session): | |||||||||||||||||||||
| par1 = red ; par2 = blue ; par3 = TRUE ; par4 = Uitvoer ; par5 = Invoer ; | |||||||||||||||||||||
| Parameters (R input): | |||||||||||||||||||||
| par1 = red ; par2 = blue ; par3 = TRUE ; par4 = Uitvoer ; par5 = Invoer ; | |||||||||||||||||||||
| R code (references can be found in the software module): | |||||||||||||||||||||
if (par3 == 'TRUE') par3 <- TRUE | |||||||||||||||||||||