Free Statistics

of Irreproducible Research!

Author's title

Author*The author of this computation has been verified*
R Software Modulerwasp_multipleregression.wasp
Title produced by softwareMultiple Regression
Date of computationTue, 17 Nov 2009 11:00:39 -0700
Cite this page as followsStatistical Computations at FreeStatistics.org, Office for Research Development and Education, URL https://freestatistics.org/blog/index.php?v=date/2009/Nov/17/t1258481650g9fdjzjpg262ulv.htm/, Retrieved Thu, 02 May 2024 06:23:30 +0000
Statistical Computations at FreeStatistics.org, Office for Research Development and Education, URL https://freestatistics.org/blog/index.php?pk=57391, Retrieved Thu, 02 May 2024 06:23:30 +0000
QR Codes:

Original text written by user:
IsPrivate?No (this computation is public)
User-defined keywordszonder dummies of lineaire trend
Estimated Impact209
Family? (F = Feedback message, R = changed R code, M = changed R Module, P = changed Parameters, D = changed Data)
F       [Multiple Regression] [ws7] [2009-11-17 18:00:39] [a931a0a30926b49d162330b43e89b999] [Current]
Feedback Forum
2009-11-27 15:45:04 [e6046db8e2ab7b20be0dcaa2a66f1573] [reply
Quality Assessment
------------------
Niet aangegeven op welke tijdreeks de berekeningen betrekking hebben. Wat wordt er onderzocht?
Model zonder lineaire trend en zonder dummies: Actuals and interpolation grafiek geeft aan dat de 3de assumptie niet voldaan is aangezien er geen vaste ligging is. De autocorrelatie functie geeft aan dat de 1ste assumptie ook niet voldaan is aangezien de eerste lags buiten het 95% betrouwbaarheidsinterval liggen. Wat aangeeft dat het model, de parameters en het toesten van hypothese fout zijn. In de volgende toetsing gaan je na of sezoenialitiet en een trend een invloed hebben op het model. Voor naar de verdere berekeningen te kijken, kunnen we uit de autocorrelatie grafiek afleiden dat de eerste lags significant positief zijn wat kan wijzen op een trend, de lags 12, 24 en 36 zijn niet significant wat er op wijst dat er waarschijnlijk geen sezoenialiteit zal zijn.

Model met dummies, zonder lineaire trend: De vaststelling van hierboven klopt, de seasonal dummies geven geen verbetering van het model.

Model met dummies en met lineaire trend: Er wordt een nieuwe parameter ‘t’ toegevoegd bij het invoegen van lineaire trend. Deze parameter betekend dat er per maand 860 afgetrokken moet worden. Dit betekent dat er eigenlijk een overschatting is van de voorspelling. Het invoeren van een trend geeft een verbetering van het model, maar als we lijken naar de grafiek van de actuals and interpolation zien we dat de 3de nog steeds niet voldaan is, ook de 4de assumptie is niet voldaan aangezien de grafiek van de residuals geen vaste variatie aangeeft. De 1ste assumptie is niet voldaan aangezien de eerste lags van de autocorrelatie grafiek het 95 % betrouwbaarheidsinterval overstijgen ,waardoor het model, de parameters en het toetsen van hypothesen fout zijn.

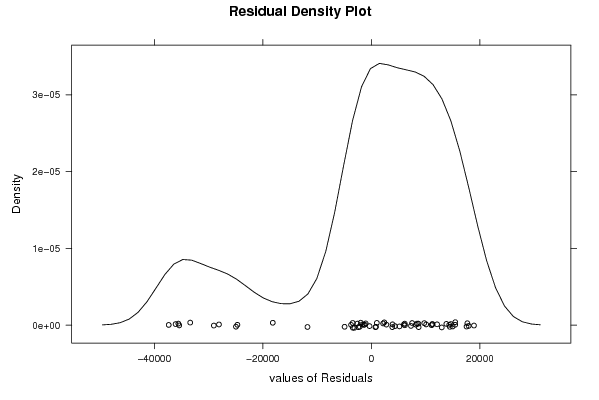
Model met gebruik van het verleden: Op de grafiek van de actuals and interpolation zien we dat de 3de assumptie nog steeds niet voldaan is, ook de 4de assumptie is niet voldaan aangezien de grafiek van de residuals geen vaste variatie aangeeft. De 1ste assumptie is niet voldaan aangezien er 4 lags zijn die het betrouwbaarheidsinterval overschrijden en er slechts 60 waarnemingen zijn (60 x 0.05 = 3). Het model, de parameters en het toetsen van hypothesen zijn dus nog steeds foutief.

Compendium Errors (3)
-----------------
Je hebt in de compendium niet aangegeven wat je onderzocht. Hierdoor is het voor de reviewer moeilijk om je conclusies te beoordelen.

Additional merit grade (2)
----------------------
Het is moeilijk hierover uitspraak te doen, zonder te weten wat het compendium onderzoekt.


Post a new message
Dataseries X:
325412	285351
326011	286602
328282	283042
317480	276687
317539	277915
313737	277128
312276	277103
309391	275037
302950	270150
300316	267140
304035	264993
333476	287259
337698	291186
335932	292300
323931	288186
313927	281477
314485	282656
313218	280190
309664	280408
302963	276836
298989	275216
298423	274352
310631	271311
329765	289802
335083	290726
327616	292300
309119	278506
295916	269826
291413	265861
291542	269034
284678	264176
276475	255198
272566	253353
264981	246057
263290	235372
296806	258556
303598	260993
286994	254663
276427	250643
266424	243422
267153	247105
268381	248541
262522	245039
255542	237080
253158	237085
243803	225554
250741	226839
280445	247934
285257	248333
270976	246969
261076	245098
255603	246263
260376	255765
263903	264319
264291	268347
263276	273046
262572	273963
256167	267430
264221	271993
293860	292710
300713	295881
287224	293299


Summary of computational transaction
Raw Inputview raw input (R code)
Raw Outputview raw output of R engine
Computing time4 seconds
R Server'Gwilym Jenkins' @ 72.249.127.135

\begin{tabular}{lllllllll}
\hline
Summary of computational transaction \tabularnewline
Raw Input & view raw input (R code)  \tabularnewline
Raw Output & view raw output of R engine  \tabularnewline
Computing time & 4 seconds \tabularnewline
R Server & 'Gwilym Jenkins' @ 72.249.127.135 \tabularnewline
\hline
\end{tabular}
%Source: https://freestatistics.org/blog/index.php?pk=57391&T=0

[TABLE]
[ROW][C]Summary of computational transaction[/C][/ROW]
[ROW][C]Raw Input[/C][C]view raw input (R code) [/C][/ROW]
[ROW][C]Raw Output[/C][C]view raw output of R engine [/C][/ROW]
[ROW][C]Computing time[/C][C]4 seconds[/C][/ROW]
[ROW][C]R Server[/C][C]'Gwilym Jenkins' @ 72.249.127.135[/C][/ROW]
[/TABLE]
Source: https://freestatistics.org/blog/index.php?pk=57391&T=0

Globally Unique Identifier (entire table): ba.freestatistics.org/blog/index.php?pk=57391&T=0

As an alternative you can also use a QR Code:  

The GUIDs for individual cells are displayed in the table below:

Summary of computational transaction
Raw Inputview raw input (R code)
Raw Outputview raw output of R engine
Computing time4 seconds
R Server'Gwilym Jenkins' @ 72.249.127.135


Multiple Linear Regression - Estimated Regression Equation
Werkl_vrouwen[t] = -21931.2893358208 + 1.17481411929854Werkl_mannen[t] + e[t]

\begin{tabular}{lllllllll}
\hline
Multiple Linear Regression - Estimated Regression Equation \tabularnewline
Werkl_vrouwen[t] =  -21931.2893358208 +  1.17481411929854Werkl_mannen[t]  + e[t] \tabularnewline
\hline
\end{tabular}
%Source: https://freestatistics.org/blog/index.php?pk=57391&T=1

[TABLE]
[ROW][C]Multiple Linear Regression - Estimated Regression Equation[/C][/ROW]
[ROW][C]Werkl_vrouwen[t] =  -21931.2893358208 +  1.17481411929854Werkl_mannen[t]  + e[t][/C][/ROW]
[/TABLE]
Source: https://freestatistics.org/blog/index.php?pk=57391&T=1

Globally Unique Identifier (entire table): ba.freestatistics.org/blog/index.php?pk=57391&T=1

As an alternative you can also use a QR Code:  

The GUIDs for individual cells are displayed in the table below:

Multiple Linear Regression - Estimated Regression Equation
Werkl_vrouwen[t] = -21931.2893358208 + 1.17481411929854Werkl_mannen[t] + e[t]


Multiple Linear Regression - Ordinary Least Squares
VariableParameterS.D.T-STATH0: parameter = 02-tail p-value1-tail p-value
(Intercept)-21931.289335820828910.695913-0.75860.4510690.225535
Werkl_mannen1.174814119298540.10799810.878100

\begin{tabular}{lllllllll}
\hline
Multiple Linear Regression - Ordinary Least Squares \tabularnewline
Variable & Parameter & S.D. & T-STATH0: parameter = 0 & 2-tail p-value & 1-tail p-value \tabularnewline
(Intercept) & -21931.2893358208 & 28910.695913 & -0.7586 & 0.451069 & 0.225535 \tabularnewline
Werkl_mannen & 1.17481411929854 & 0.107998 & 10.8781 & 0 & 0 \tabularnewline
\hline
\end{tabular}
%Source: https://freestatistics.org/blog/index.php?pk=57391&T=2

[TABLE]
[ROW][C]Multiple Linear Regression - Ordinary Least Squares[/C][/ROW]
[ROW][C]Variable[/C][C]Parameter[/C][C]S.D.[/C][C]T-STATH0: parameter = 0[/C][C]2-tail p-value[/C][C]1-tail p-value[/C][/ROW]
[ROW][C](Intercept)[/C][C]-21931.2893358208[/C][C]28910.695913[/C][C]-0.7586[/C][C]0.451069[/C][C]0.225535[/C][/ROW]
[ROW][C]Werkl_mannen[/C][C]1.17481411929854[/C][C]0.107998[/C][C]10.8781[/C][C]0[/C][C]0[/C][/ROW]
[/TABLE]
Source: https://freestatistics.org/blog/index.php?pk=57391&T=2

Globally Unique Identifier (entire table): ba.freestatistics.org/blog/index.php?pk=57391&T=2

As an alternative you can also use a QR Code:  

The GUIDs for individual cells are displayed in the table below:

Multiple Linear Regression - Ordinary Least Squares
VariableParameterS.D.T-STATH0: parameter = 02-tail p-value1-tail p-value
(Intercept)-21931.289335820828910.695913-0.75860.4510690.225535
Werkl_mannen1.174814119298540.10799810.878100


Multiple Linear Regression - Regression Statistics
Multiple R0.814587321159498
R-squared0.663552503793807
Adjusted R-squared0.657945045523704
F-TEST (value)118.333917406325
F-TEST (DF numerator)1
F-TEST (DF denominator)60
p-value7.7715611723761e-16
Multiple Linear Regression - Residual Statistics
Residual Standard Deviation15319.9310318618
Sum Squared Residuals14082017209.2601

\begin{tabular}{lllllllll}
\hline
Multiple Linear Regression - Regression Statistics \tabularnewline
Multiple R & 0.814587321159498 \tabularnewline
R-squared & 0.663552503793807 \tabularnewline
Adjusted R-squared & 0.657945045523704 \tabularnewline
F-TEST (value) & 118.333917406325 \tabularnewline
F-TEST (DF numerator) & 1 \tabularnewline
F-TEST (DF denominator) & 60 \tabularnewline
p-value & 7.7715611723761e-16 \tabularnewline
Multiple Linear Regression - Residual Statistics \tabularnewline
Residual Standard Deviation & 15319.9310318618 \tabularnewline
Sum Squared Residuals & 14082017209.2601 \tabularnewline
\hline
\end{tabular}
%Source: https://freestatistics.org/blog/index.php?pk=57391&T=3

[TABLE]
[ROW][C]Multiple Linear Regression - Regression Statistics[/C][/ROW]
[ROW][C]Multiple R[/C][C]0.814587321159498[/C][/ROW]
[ROW][C]R-squared[/C][C]0.663552503793807[/C][/ROW]
[ROW][C]Adjusted R-squared[/C][C]0.657945045523704[/C][/ROW]
[ROW][C]F-TEST (value)[/C][C]118.333917406325[/C][/ROW]
[ROW][C]F-TEST (DF numerator)[/C][C]1[/C][/ROW]
[ROW][C]F-TEST (DF denominator)[/C][C]60[/C][/ROW]
[ROW][C]p-value[/C][C]7.7715611723761e-16[/C][/ROW]
[ROW][C]Multiple Linear Regression - Residual Statistics[/C][/ROW]
[ROW][C]Residual Standard Deviation[/C][C]15319.9310318618[/C][/ROW]
[ROW][C]Sum Squared Residuals[/C][C]14082017209.2601[/C][/ROW]
[/TABLE]
Source: https://freestatistics.org/blog/index.php?pk=57391&T=3

Globally Unique Identifier (entire table): ba.freestatistics.org/blog/index.php?pk=57391&T=3

As an alternative you can also use a QR Code:  

The GUIDs for individual cells are displayed in the table below:

Multiple Linear Regression - Regression Statistics
Multiple R0.814587321159498
R-squared0.663552503793807
Adjusted R-squared0.657945045523704
F-TEST (value)118.333917406325
F-TEST (DF numerator)1
F-TEST (DF denominator)60
p-value7.7715611723761e-16
Multiple Linear Regression - Residual Statistics
Residual Standard Deviation15319.9310318618
Sum Squared Residuals14082017209.2601


Multiple Linear Regression - Actuals, Interpolation, and Residuals
Time or IndexActualsInterpolationForecastResidualsPrediction Error
1325412313303.09442013812108.9055798623
2326011314772.78688338011238.2131166195
3328282310590.44861867817691.5513813222
4317480303124.50489053614355.4951094645
5317539304567.17662903412971.8233709659
6313737303642.59791714610094.4020828538
7312276303613.2275641648662.77243583628
8309391301186.0615936938204.93840630707
9302950295444.7449926817505.25500731906
10300316291908.5544935928407.44550640767
11304035289386.22857945814648.7714205416
12333476315544.6397597617931.3602402403
13337698320158.13480624517539.8651937549
14335932321466.87773514414465.1222648563
15323931316633.6924483497297.30755165052
16313927308751.8645219765175.13547802445
17314485310136.9703686294348.02963137147
18313218307239.8787504385978.12124956167
19309664307495.9882284452168.01177155459
20302963303299.552194311-336.552194311008
21298989301396.353321047-2407.35332104737
22298423300381.313921973-1958.31392197343
23310631296808.70418518713822.2958148134
24329765318532.19206513611232.8079348641
25335083319617.72031136815465.2796886322
26327616321466.8777351446149.1222648563
27309119305261.4917735403857.50822646042
28295916295064.105218028851.894781971785
29291413290405.9672350091007.03276499051
30291542294133.652435544-2591.65243554377
31284678288426.405443991-3748.40544399144
32276475277878.924280929-1403.92428092911
33272566275711.392230823-3145.3922308233
34264981267139.948416421-2158.94841642112
35263290254587.0595517168702.94044828382
36296806281823.95009353414982.0499064664
37303598284686.97210226418911.0278977358
38286994277250.3987271049743.6012728956
39276427272527.6459675243899.35403247576
40266424264044.3132120692379.68678793054
41267153268371.153613446-1218.15361344600
42268381270058.186688759-1677.18668875871
43262522265943.987642975-3421.98764297520
44255542256593.642067478-1051.64206747809
45253158256599.516138075-3441.51613807459
46243803243052.734528443750.265471556918
47250741244562.3706717426178.62932825829
48280445269345.07451834411099.9254816555
49285257269813.82535194515443.1746480554
50270976268211.3788932212764.62110677860
51261076266013.301676014-4937.30167601382
52255603267381.960124997-11778.9601249966
53260376278545.043886571-18169.0438865714
54263903288594.403863051-24691.4038630511
55264291293326.555135586-29035.5551355857
56263276298847.006682170-35571.0066821695
57262572299924.311229566-37352.3112295663
58256167292249.250588189-36082.2505881889
59264221297609.927414548-33388.9274145482
60293860321948.551524056-28088.5515240561
61300713325673.887096352-24960.8870963518
62287224322640.517040323-35416.5170403229

\begin{tabular}{lllllllll}
\hline
Multiple Linear Regression - Actuals, Interpolation, and Residuals \tabularnewline
Time or Index & Actuals & InterpolationForecast & ResidualsPrediction Error \tabularnewline
1 & 325412 & 313303.094420138 & 12108.9055798623 \tabularnewline
2 & 326011 & 314772.786883380 & 11238.2131166195 \tabularnewline
3 & 328282 & 310590.448618678 & 17691.5513813222 \tabularnewline
4 & 317480 & 303124.504890536 & 14355.4951094645 \tabularnewline
5 & 317539 & 304567.176629034 & 12971.8233709659 \tabularnewline
6 & 313737 & 303642.597917146 & 10094.4020828538 \tabularnewline
7 & 312276 & 303613.227564164 & 8662.77243583628 \tabularnewline
8 & 309391 & 301186.061593693 & 8204.93840630707 \tabularnewline
9 & 302950 & 295444.744992681 & 7505.25500731906 \tabularnewline
10 & 300316 & 291908.554493592 & 8407.44550640767 \tabularnewline
11 & 304035 & 289386.228579458 & 14648.7714205416 \tabularnewline
12 & 333476 & 315544.63975976 & 17931.3602402403 \tabularnewline
13 & 337698 & 320158.134806245 & 17539.8651937549 \tabularnewline
14 & 335932 & 321466.877735144 & 14465.1222648563 \tabularnewline
15 & 323931 & 316633.692448349 & 7297.30755165052 \tabularnewline
16 & 313927 & 308751.864521976 & 5175.13547802445 \tabularnewline
17 & 314485 & 310136.970368629 & 4348.02963137147 \tabularnewline
18 & 313218 & 307239.878750438 & 5978.12124956167 \tabularnewline
19 & 309664 & 307495.988228445 & 2168.01177155459 \tabularnewline
20 & 302963 & 303299.552194311 & -336.552194311008 \tabularnewline
21 & 298989 & 301396.353321047 & -2407.35332104737 \tabularnewline
22 & 298423 & 300381.313921973 & -1958.31392197343 \tabularnewline
23 & 310631 & 296808.704185187 & 13822.2958148134 \tabularnewline
24 & 329765 & 318532.192065136 & 11232.8079348641 \tabularnewline
25 & 335083 & 319617.720311368 & 15465.2796886322 \tabularnewline
26 & 327616 & 321466.877735144 & 6149.1222648563 \tabularnewline
27 & 309119 & 305261.491773540 & 3857.50822646042 \tabularnewline
28 & 295916 & 295064.105218028 & 851.894781971785 \tabularnewline
29 & 291413 & 290405.967235009 & 1007.03276499051 \tabularnewline
30 & 291542 & 294133.652435544 & -2591.65243554377 \tabularnewline
31 & 284678 & 288426.405443991 & -3748.40544399144 \tabularnewline
32 & 276475 & 277878.924280929 & -1403.92428092911 \tabularnewline
33 & 272566 & 275711.392230823 & -3145.3922308233 \tabularnewline
34 & 264981 & 267139.948416421 & -2158.94841642112 \tabularnewline
35 & 263290 & 254587.059551716 & 8702.94044828382 \tabularnewline
36 & 296806 & 281823.950093534 & 14982.0499064664 \tabularnewline
37 & 303598 & 284686.972102264 & 18911.0278977358 \tabularnewline
38 & 286994 & 277250.398727104 & 9743.6012728956 \tabularnewline
39 & 276427 & 272527.645967524 & 3899.35403247576 \tabularnewline
40 & 266424 & 264044.313212069 & 2379.68678793054 \tabularnewline
41 & 267153 & 268371.153613446 & -1218.15361344600 \tabularnewline
42 & 268381 & 270058.186688759 & -1677.18668875871 \tabularnewline
43 & 262522 & 265943.987642975 & -3421.98764297520 \tabularnewline
44 & 255542 & 256593.642067478 & -1051.64206747809 \tabularnewline
45 & 253158 & 256599.516138075 & -3441.51613807459 \tabularnewline
46 & 243803 & 243052.734528443 & 750.265471556918 \tabularnewline
47 & 250741 & 244562.370671742 & 6178.62932825829 \tabularnewline
48 & 280445 & 269345.074518344 & 11099.9254816555 \tabularnewline
49 & 285257 & 269813.825351945 & 15443.1746480554 \tabularnewline
50 & 270976 & 268211.378893221 & 2764.62110677860 \tabularnewline
51 & 261076 & 266013.301676014 & -4937.30167601382 \tabularnewline
52 & 255603 & 267381.960124997 & -11778.9601249966 \tabularnewline
53 & 260376 & 278545.043886571 & -18169.0438865714 \tabularnewline
54 & 263903 & 288594.403863051 & -24691.4038630511 \tabularnewline
55 & 264291 & 293326.555135586 & -29035.5551355857 \tabularnewline
56 & 263276 & 298847.006682170 & -35571.0066821695 \tabularnewline
57 & 262572 & 299924.311229566 & -37352.3112295663 \tabularnewline
58 & 256167 & 292249.250588189 & -36082.2505881889 \tabularnewline
59 & 264221 & 297609.927414548 & -33388.9274145482 \tabularnewline
60 & 293860 & 321948.551524056 & -28088.5515240561 \tabularnewline
61 & 300713 & 325673.887096352 & -24960.8870963518 \tabularnewline
62 & 287224 & 322640.517040323 & -35416.5170403229 \tabularnewline
\hline
\end{tabular}
%Source: https://freestatistics.org/blog/index.php?pk=57391&T=4

[TABLE]
[ROW][C]Multiple Linear Regression - Actuals, Interpolation, and Residuals[/C][/ROW]
[ROW][C]Time or Index[/C][C]Actuals[/C][C]InterpolationForecast[/C][C]ResidualsPrediction Error[/C][/ROW]
[ROW][C]1[/C][C]325412[/C][C]313303.094420138[/C][C]12108.9055798623[/C][/ROW]
[ROW][C]2[/C][C]326011[/C][C]314772.786883380[/C][C]11238.2131166195[/C][/ROW]
[ROW][C]3[/C][C]328282[/C][C]310590.448618678[/C][C]17691.5513813222[/C][/ROW]
[ROW][C]4[/C][C]317480[/C][C]303124.504890536[/C][C]14355.4951094645[/C][/ROW]
[ROW][C]5[/C][C]317539[/C][C]304567.176629034[/C][C]12971.8233709659[/C][/ROW]
[ROW][C]6[/C][C]313737[/C][C]303642.597917146[/C][C]10094.4020828538[/C][/ROW]
[ROW][C]7[/C][C]312276[/C][C]303613.227564164[/C][C]8662.77243583628[/C][/ROW]
[ROW][C]8[/C][C]309391[/C][C]301186.061593693[/C][C]8204.93840630707[/C][/ROW]
[ROW][C]9[/C][C]302950[/C][C]295444.744992681[/C][C]7505.25500731906[/C][/ROW]
[ROW][C]10[/C][C]300316[/C][C]291908.554493592[/C][C]8407.44550640767[/C][/ROW]
[ROW][C]11[/C][C]304035[/C][C]289386.228579458[/C][C]14648.7714205416[/C][/ROW]
[ROW][C]12[/C][C]333476[/C][C]315544.63975976[/C][C]17931.3602402403[/C][/ROW]
[ROW][C]13[/C][C]337698[/C][C]320158.134806245[/C][C]17539.8651937549[/C][/ROW]
[ROW][C]14[/C][C]335932[/C][C]321466.877735144[/C][C]14465.1222648563[/C][/ROW]
[ROW][C]15[/C][C]323931[/C][C]316633.692448349[/C][C]7297.30755165052[/C][/ROW]
[ROW][C]16[/C][C]313927[/C][C]308751.864521976[/C][C]5175.13547802445[/C][/ROW]
[ROW][C]17[/C][C]314485[/C][C]310136.970368629[/C][C]4348.02963137147[/C][/ROW]
[ROW][C]18[/C][C]313218[/C][C]307239.878750438[/C][C]5978.12124956167[/C][/ROW]
[ROW][C]19[/C][C]309664[/C][C]307495.988228445[/C][C]2168.01177155459[/C][/ROW]
[ROW][C]20[/C][C]302963[/C][C]303299.552194311[/C][C]-336.552194311008[/C][/ROW]
[ROW][C]21[/C][C]298989[/C][C]301396.353321047[/C][C]-2407.35332104737[/C][/ROW]
[ROW][C]22[/C][C]298423[/C][C]300381.313921973[/C][C]-1958.31392197343[/C][/ROW]
[ROW][C]23[/C][C]310631[/C][C]296808.704185187[/C][C]13822.2958148134[/C][/ROW]
[ROW][C]24[/C][C]329765[/C][C]318532.192065136[/C][C]11232.8079348641[/C][/ROW]
[ROW][C]25[/C][C]335083[/C][C]319617.720311368[/C][C]15465.2796886322[/C][/ROW]
[ROW][C]26[/C][C]327616[/C][C]321466.877735144[/C][C]6149.1222648563[/C][/ROW]
[ROW][C]27[/C][C]309119[/C][C]305261.491773540[/C][C]3857.50822646042[/C][/ROW]
[ROW][C]28[/C][C]295916[/C][C]295064.105218028[/C][C]851.894781971785[/C][/ROW]
[ROW][C]29[/C][C]291413[/C][C]290405.967235009[/C][C]1007.03276499051[/C][/ROW]
[ROW][C]30[/C][C]291542[/C][C]294133.652435544[/C][C]-2591.65243554377[/C][/ROW]
[ROW][C]31[/C][C]284678[/C][C]288426.405443991[/C][C]-3748.40544399144[/C][/ROW]
[ROW][C]32[/C][C]276475[/C][C]277878.924280929[/C][C]-1403.92428092911[/C][/ROW]
[ROW][C]33[/C][C]272566[/C][C]275711.392230823[/C][C]-3145.3922308233[/C][/ROW]
[ROW][C]34[/C][C]264981[/C][C]267139.948416421[/C][C]-2158.94841642112[/C][/ROW]
[ROW][C]35[/C][C]263290[/C][C]254587.059551716[/C][C]8702.94044828382[/C][/ROW]
[ROW][C]36[/C][C]296806[/C][C]281823.950093534[/C][C]14982.0499064664[/C][/ROW]
[ROW][C]37[/C][C]303598[/C][C]284686.972102264[/C][C]18911.0278977358[/C][/ROW]
[ROW][C]38[/C][C]286994[/C][C]277250.398727104[/C][C]9743.6012728956[/C][/ROW]
[ROW][C]39[/C][C]276427[/C][C]272527.645967524[/C][C]3899.35403247576[/C][/ROW]
[ROW][C]40[/C][C]266424[/C][C]264044.313212069[/C][C]2379.68678793054[/C][/ROW]
[ROW][C]41[/C][C]267153[/C][C]268371.153613446[/C][C]-1218.15361344600[/C][/ROW]
[ROW][C]42[/C][C]268381[/C][C]270058.186688759[/C][C]-1677.18668875871[/C][/ROW]
[ROW][C]43[/C][C]262522[/C][C]265943.987642975[/C][C]-3421.98764297520[/C][/ROW]
[ROW][C]44[/C][C]255542[/C][C]256593.642067478[/C][C]-1051.64206747809[/C][/ROW]
[ROW][C]45[/C][C]253158[/C][C]256599.516138075[/C][C]-3441.51613807459[/C][/ROW]
[ROW][C]46[/C][C]243803[/C][C]243052.734528443[/C][C]750.265471556918[/C][/ROW]
[ROW][C]47[/C][C]250741[/C][C]244562.370671742[/C][C]6178.62932825829[/C][/ROW]
[ROW][C]48[/C][C]280445[/C][C]269345.074518344[/C][C]11099.9254816555[/C][/ROW]
[ROW][C]49[/C][C]285257[/C][C]269813.825351945[/C][C]15443.1746480554[/C][/ROW]
[ROW][C]50[/C][C]270976[/C][C]268211.378893221[/C][C]2764.62110677860[/C][/ROW]
[ROW][C]51[/C][C]261076[/C][C]266013.301676014[/C][C]-4937.30167601382[/C][/ROW]
[ROW][C]52[/C][C]255603[/C][C]267381.960124997[/C][C]-11778.9601249966[/C][/ROW]
[ROW][C]53[/C][C]260376[/C][C]278545.043886571[/C][C]-18169.0438865714[/C][/ROW]
[ROW][C]54[/C][C]263903[/C][C]288594.403863051[/C][C]-24691.4038630511[/C][/ROW]
[ROW][C]55[/C][C]264291[/C][C]293326.555135586[/C][C]-29035.5551355857[/C][/ROW]
[ROW][C]56[/C][C]263276[/C][C]298847.006682170[/C][C]-35571.0066821695[/C][/ROW]
[ROW][C]57[/C][C]262572[/C][C]299924.311229566[/C][C]-37352.3112295663[/C][/ROW]
[ROW][C]58[/C][C]256167[/C][C]292249.250588189[/C][C]-36082.2505881889[/C][/ROW]
[ROW][C]59[/C][C]264221[/C][C]297609.927414548[/C][C]-33388.9274145482[/C][/ROW]
[ROW][C]60[/C][C]293860[/C][C]321948.551524056[/C][C]-28088.5515240561[/C][/ROW]
[ROW][C]61[/C][C]300713[/C][C]325673.887096352[/C][C]-24960.8870963518[/C][/ROW]
[ROW][C]62[/C][C]287224[/C][C]322640.517040323[/C][C]-35416.5170403229[/C][/ROW]
[/TABLE]
Source: https://freestatistics.org/blog/index.php?pk=57391&T=4

Globally Unique Identifier (entire table): ba.freestatistics.org/blog/index.php?pk=57391&T=4

As an alternative you can also use a QR Code:  

The GUIDs for individual cells are displayed in the table below:

Multiple Linear Regression - Actuals, Interpolation, and Residuals
Time or IndexActualsInterpolationForecastResidualsPrediction Error
1325412313303.09442013812108.9055798623
2326011314772.78688338011238.2131166195
3328282310590.44861867817691.5513813222
4317480303124.50489053614355.4951094645
5317539304567.17662903412971.8233709659
6313737303642.59791714610094.4020828538
7312276303613.2275641648662.77243583628
8309391301186.0615936938204.93840630707
9302950295444.7449926817505.25500731906
10300316291908.5544935928407.44550640767
11304035289386.22857945814648.7714205416
12333476315544.6397597617931.3602402403
13337698320158.13480624517539.8651937549
14335932321466.87773514414465.1222648563
15323931316633.6924483497297.30755165052
16313927308751.8645219765175.13547802445
17314485310136.9703686294348.02963137147
18313218307239.8787504385978.12124956167
19309664307495.9882284452168.01177155459
20302963303299.552194311-336.552194311008
21298989301396.353321047-2407.35332104737
22298423300381.313921973-1958.31392197343
23310631296808.70418518713822.2958148134
24329765318532.19206513611232.8079348641
25335083319617.72031136815465.2796886322
26327616321466.8777351446149.1222648563
27309119305261.4917735403857.50822646042
28295916295064.105218028851.894781971785
29291413290405.9672350091007.03276499051
30291542294133.652435544-2591.65243554377
31284678288426.405443991-3748.40544399144
32276475277878.924280929-1403.92428092911
33272566275711.392230823-3145.3922308233
34264981267139.948416421-2158.94841642112
35263290254587.0595517168702.94044828382
36296806281823.95009353414982.0499064664
37303598284686.97210226418911.0278977358
38286994277250.3987271049743.6012728956
39276427272527.6459675243899.35403247576
40266424264044.3132120692379.68678793054
41267153268371.153613446-1218.15361344600
42268381270058.186688759-1677.18668875871
43262522265943.987642975-3421.98764297520
44255542256593.642067478-1051.64206747809
45253158256599.516138075-3441.51613807459
46243803243052.734528443750.265471556918
47250741244562.3706717426178.62932825829
48280445269345.07451834411099.9254816555
49285257269813.82535194515443.1746480554
50270976268211.3788932212764.62110677860
51261076266013.301676014-4937.30167601382
52255603267381.960124997-11778.9601249966
53260376278545.043886571-18169.0438865714
54263903288594.403863051-24691.4038630511
55264291293326.555135586-29035.5551355857
56263276298847.006682170-35571.0066821695
57262572299924.311229566-37352.3112295663
58256167292249.250588189-36082.2505881889
59264221297609.927414548-33388.9274145482
60293860321948.551524056-28088.5515240561
61300713325673.887096352-24960.8870963518
62287224322640.517040323-35416.5170403229


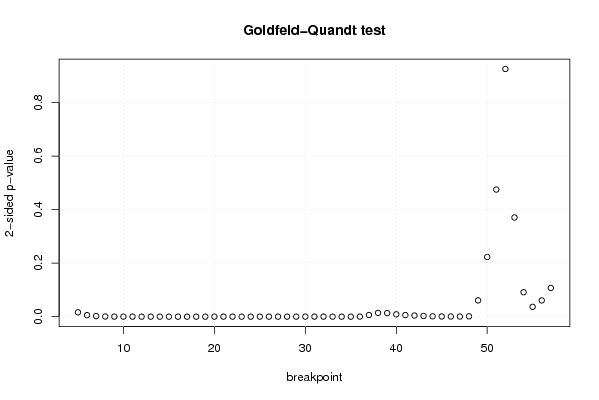
Goldfeld-Quandt test for Heteroskedasticity
p-valuesAlternative Hypothesis
breakpoint indexgreater2-sidedless
50.008118277560821950.01623655512164390.991881722439178
60.002840416865152170.005680833730304350.997159583134848
70.001064314881229730.002128629762459470.99893568511877
80.0002997807769267090.0005995615538534190.999700219223073
96.01265612033006e-050.0001202531224066010.999939873438797
101.07467482217299e-052.14934964434599e-050.999989253251778
111.37765083216038e-052.75530166432076e-050.999986223491678
127.59318651739134e-061.51863730347827e-050.999992406813483
132.43235915092601e-064.86471830185201e-060.999997567640849
146.92000677261004e-071.38400135452201e-060.999999307999323
151.17159227930219e-062.34318455860439e-060.99999882840772
161.57218257481535e-063.1443651496307e-060.999998427817425
172.16668247710164e-064.33336495420327e-060.999997833317523
181.32733984988609e-062.65467969977219e-060.99999867266015
192.13565885091290e-064.27131770182581e-060.99999786434115
204.28718402389106e-068.57436804778212e-060.999995712815976
218.99499733744246e-061.79899946748849e-050.999991005002663
221.07329183548332e-052.14658367096664e-050.999989267081645
231.06881091563575e-052.1376218312715e-050.999989311890844
248.49607206808389e-061.69921441361678e-050.999991503927932
251.62579197194497e-053.25158394388994e-050.99998374208028
263.70368215287395e-057.4073643057479e-050.999962963178471
274.93171207163528e-059.86342414327056e-050.999950682879284
284.80794882803616e-059.61589765607232e-050.99995192051172
293.67097292420779e-057.34194584841559e-050.999963290270758
304.43576366215563e-058.87152732431125e-050.999955642363378
313.68591096526156e-057.37182193052313e-050.999963140890347
321.74185603706717e-053.48371207413435e-050.99998258143963
337.62166731968274e-061.52433346393655e-050.99999237833268
343.29915728941395e-066.5983145788279e-060.99999670084271
351.08914171767746e-052.17828343535492e-050.999989108582823
368.46952843494122e-050.0001693905686988240.99991530471565
370.003083318220467300.006166636440934610.996916681779533
380.007000529539278650.01400105907855730.992999470460721
390.006624672069523940.01324934413904790.993375327930476
400.004359159512010.008718319024020.99564084048799
410.002957231153431020.005914462306862050.997042768846569
420.002078845772966830.004157691545933660.997921154227033
430.001294897715789280.002589795431578550.99870510228421
440.0006660690803546480.001332138160709300.999333930919645
450.0003569645677475440.0007139291354950880.999643035432253
460.0002411650080399000.0004823300160797990.99975883499196
470.0001691461320111310.0003382922640222620.999830853867989
480.0006485260256594570.001297052051318910.99935147397434
490.03041726674703270.06083453349406550.969582733252967
500.1114301200565170.2228602401130340.888569879943483
510.2373367150754740.4746734301509480.762663284924526
520.4626561692706770.9253123385413540.537343830729323
530.8147770198163230.3704459603673540.185222980183677
540.954322988498140.09135402300371720.0456770115018586
550.9817023144330520.03659537113389640.0182976855669482
560.969685984289290.06062803142142080.0303140157107104
570.9463644725976040.1072710548047930.0536355274023963

\begin{tabular}{lllllllll}
\hline
Goldfeld-Quandt test for Heteroskedasticity \tabularnewline
p-values & Alternative Hypothesis \tabularnewline
breakpoint index & greater & 2-sided & less \tabularnewline
5 & 0.00811827756082195 & 0.0162365551216439 & 0.991881722439178 \tabularnewline
6 & 0.00284041686515217 & 0.00568083373030435 & 0.997159583134848 \tabularnewline
7 & 0.00106431488122973 & 0.00212862976245947 & 0.99893568511877 \tabularnewline
8 & 0.000299780776926709 & 0.000599561553853419 & 0.999700219223073 \tabularnewline
9 & 6.01265612033006e-05 & 0.000120253122406601 & 0.999939873438797 \tabularnewline
10 & 1.07467482217299e-05 & 2.14934964434599e-05 & 0.999989253251778 \tabularnewline
11 & 1.37765083216038e-05 & 2.75530166432076e-05 & 0.999986223491678 \tabularnewline
12 & 7.59318651739134e-06 & 1.51863730347827e-05 & 0.999992406813483 \tabularnewline
13 & 2.43235915092601e-06 & 4.86471830185201e-06 & 0.999997567640849 \tabularnewline
14 & 6.92000677261004e-07 & 1.38400135452201e-06 & 0.999999307999323 \tabularnewline
15 & 1.17159227930219e-06 & 2.34318455860439e-06 & 0.99999882840772 \tabularnewline
16 & 1.57218257481535e-06 & 3.1443651496307e-06 & 0.999998427817425 \tabularnewline
17 & 2.16668247710164e-06 & 4.33336495420327e-06 & 0.999997833317523 \tabularnewline
18 & 1.32733984988609e-06 & 2.65467969977219e-06 & 0.99999867266015 \tabularnewline
19 & 2.13565885091290e-06 & 4.27131770182581e-06 & 0.99999786434115 \tabularnewline
20 & 4.28718402389106e-06 & 8.57436804778212e-06 & 0.999995712815976 \tabularnewline
21 & 8.99499733744246e-06 & 1.79899946748849e-05 & 0.999991005002663 \tabularnewline
22 & 1.07329183548332e-05 & 2.14658367096664e-05 & 0.999989267081645 \tabularnewline
23 & 1.06881091563575e-05 & 2.1376218312715e-05 & 0.999989311890844 \tabularnewline
24 & 8.49607206808389e-06 & 1.69921441361678e-05 & 0.999991503927932 \tabularnewline
25 & 1.62579197194497e-05 & 3.25158394388994e-05 & 0.99998374208028 \tabularnewline
26 & 3.70368215287395e-05 & 7.4073643057479e-05 & 0.999962963178471 \tabularnewline
27 & 4.93171207163528e-05 & 9.86342414327056e-05 & 0.999950682879284 \tabularnewline
28 & 4.80794882803616e-05 & 9.61589765607232e-05 & 0.99995192051172 \tabularnewline
29 & 3.67097292420779e-05 & 7.34194584841559e-05 & 0.999963290270758 \tabularnewline
30 & 4.43576366215563e-05 & 8.87152732431125e-05 & 0.999955642363378 \tabularnewline
31 & 3.68591096526156e-05 & 7.37182193052313e-05 & 0.999963140890347 \tabularnewline
32 & 1.74185603706717e-05 & 3.48371207413435e-05 & 0.99998258143963 \tabularnewline
33 & 7.62166731968274e-06 & 1.52433346393655e-05 & 0.99999237833268 \tabularnewline
34 & 3.29915728941395e-06 & 6.5983145788279e-06 & 0.99999670084271 \tabularnewline
35 & 1.08914171767746e-05 & 2.17828343535492e-05 & 0.999989108582823 \tabularnewline
36 & 8.46952843494122e-05 & 0.000169390568698824 & 0.99991530471565 \tabularnewline
37 & 0.00308331822046730 & 0.00616663644093461 & 0.996916681779533 \tabularnewline
38 & 0.00700052953927865 & 0.0140010590785573 & 0.992999470460721 \tabularnewline
39 & 0.00662467206952394 & 0.0132493441390479 & 0.993375327930476 \tabularnewline
40 & 0.00435915951201 & 0.00871831902402 & 0.99564084048799 \tabularnewline
41 & 0.00295723115343102 & 0.00591446230686205 & 0.997042768846569 \tabularnewline
42 & 0.00207884577296683 & 0.00415769154593366 & 0.997921154227033 \tabularnewline
43 & 0.00129489771578928 & 0.00258979543157855 & 0.99870510228421 \tabularnewline
44 & 0.000666069080354648 & 0.00133213816070930 & 0.999333930919645 \tabularnewline
45 & 0.000356964567747544 & 0.000713929135495088 & 0.999643035432253 \tabularnewline
46 & 0.000241165008039900 & 0.000482330016079799 & 0.99975883499196 \tabularnewline
47 & 0.000169146132011131 & 0.000338292264022262 & 0.999830853867989 \tabularnewline
48 & 0.000648526025659457 & 0.00129705205131891 & 0.99935147397434 \tabularnewline
49 & 0.0304172667470327 & 0.0608345334940655 & 0.969582733252967 \tabularnewline
50 & 0.111430120056517 & 0.222860240113034 & 0.888569879943483 \tabularnewline
51 & 0.237336715075474 & 0.474673430150948 & 0.762663284924526 \tabularnewline
52 & 0.462656169270677 & 0.925312338541354 & 0.537343830729323 \tabularnewline
53 & 0.814777019816323 & 0.370445960367354 & 0.185222980183677 \tabularnewline
54 & 0.95432298849814 & 0.0913540230037172 & 0.0456770115018586 \tabularnewline
55 & 0.981702314433052 & 0.0365953711338964 & 0.0182976855669482 \tabularnewline
56 & 0.96968598428929 & 0.0606280314214208 & 0.0303140157107104 \tabularnewline
57 & 0.946364472597604 & 0.107271054804793 & 0.0536355274023963 \tabularnewline
\hline
\end{tabular}
%Source: https://freestatistics.org/blog/index.php?pk=57391&T=5

[TABLE]
[ROW][C]Goldfeld-Quandt test for Heteroskedasticity[/C][/ROW]
[ROW][C]p-values[/C][C]Alternative Hypothesis[/C][/ROW]
[ROW][C]breakpoint index[/C][C]greater[/C][C]2-sided[/C][C]less[/C][/ROW]
[ROW][C]5[/C][C]0.00811827756082195[/C][C]0.0162365551216439[/C][C]0.991881722439178[/C][/ROW]
[ROW][C]6[/C][C]0.00284041686515217[/C][C]0.00568083373030435[/C][C]0.997159583134848[/C][/ROW]
[ROW][C]7[/C][C]0.00106431488122973[/C][C]0.00212862976245947[/C][C]0.99893568511877[/C][/ROW]
[ROW][C]8[/C][C]0.000299780776926709[/C][C]0.000599561553853419[/C][C]0.999700219223073[/C][/ROW]
[ROW][C]9[/C][C]6.01265612033006e-05[/C][C]0.000120253122406601[/C][C]0.999939873438797[/C][/ROW]
[ROW][C]10[/C][C]1.07467482217299e-05[/C][C]2.14934964434599e-05[/C][C]0.999989253251778[/C][/ROW]
[ROW][C]11[/C][C]1.37765083216038e-05[/C][C]2.75530166432076e-05[/C][C]0.999986223491678[/C][/ROW]
[ROW][C]12[/C][C]7.59318651739134e-06[/C][C]1.51863730347827e-05[/C][C]0.999992406813483[/C][/ROW]
[ROW][C]13[/C][C]2.43235915092601e-06[/C][C]4.86471830185201e-06[/C][C]0.999997567640849[/C][/ROW]
[ROW][C]14[/C][C]6.92000677261004e-07[/C][C]1.38400135452201e-06[/C][C]0.999999307999323[/C][/ROW]
[ROW][C]15[/C][C]1.17159227930219e-06[/C][C]2.34318455860439e-06[/C][C]0.99999882840772[/C][/ROW]
[ROW][C]16[/C][C]1.57218257481535e-06[/C][C]3.1443651496307e-06[/C][C]0.999998427817425[/C][/ROW]
[ROW][C]17[/C][C]2.16668247710164e-06[/C][C]4.33336495420327e-06[/C][C]0.999997833317523[/C][/ROW]
[ROW][C]18[/C][C]1.32733984988609e-06[/C][C]2.65467969977219e-06[/C][C]0.99999867266015[/C][/ROW]
[ROW][C]19[/C][C]2.13565885091290e-06[/C][C]4.27131770182581e-06[/C][C]0.99999786434115[/C][/ROW]
[ROW][C]20[/C][C]4.28718402389106e-06[/C][C]8.57436804778212e-06[/C][C]0.999995712815976[/C][/ROW]
[ROW][C]21[/C][C]8.99499733744246e-06[/C][C]1.79899946748849e-05[/C][C]0.999991005002663[/C][/ROW]
[ROW][C]22[/C][C]1.07329183548332e-05[/C][C]2.14658367096664e-05[/C][C]0.999989267081645[/C][/ROW]
[ROW][C]23[/C][C]1.06881091563575e-05[/C][C]2.1376218312715e-05[/C][C]0.999989311890844[/C][/ROW]
[ROW][C]24[/C][C]8.49607206808389e-06[/C][C]1.69921441361678e-05[/C][C]0.999991503927932[/C][/ROW]
[ROW][C]25[/C][C]1.62579197194497e-05[/C][C]3.25158394388994e-05[/C][C]0.99998374208028[/C][/ROW]
[ROW][C]26[/C][C]3.70368215287395e-05[/C][C]7.4073643057479e-05[/C][C]0.999962963178471[/C][/ROW]
[ROW][C]27[/C][C]4.93171207163528e-05[/C][C]9.86342414327056e-05[/C][C]0.999950682879284[/C][/ROW]
[ROW][C]28[/C][C]4.80794882803616e-05[/C][C]9.61589765607232e-05[/C][C]0.99995192051172[/C][/ROW]
[ROW][C]29[/C][C]3.67097292420779e-05[/C][C]7.34194584841559e-05[/C][C]0.999963290270758[/C][/ROW]
[ROW][C]30[/C][C]4.43576366215563e-05[/C][C]8.87152732431125e-05[/C][C]0.999955642363378[/C][/ROW]
[ROW][C]31[/C][C]3.68591096526156e-05[/C][C]7.37182193052313e-05[/C][C]0.999963140890347[/C][/ROW]
[ROW][C]32[/C][C]1.74185603706717e-05[/C][C]3.48371207413435e-05[/C][C]0.99998258143963[/C][/ROW]
[ROW][C]33[/C][C]7.62166731968274e-06[/C][C]1.52433346393655e-05[/C][C]0.99999237833268[/C][/ROW]
[ROW][C]34[/C][C]3.29915728941395e-06[/C][C]6.5983145788279e-06[/C][C]0.99999670084271[/C][/ROW]
[ROW][C]35[/C][C]1.08914171767746e-05[/C][C]2.17828343535492e-05[/C][C]0.999989108582823[/C][/ROW]
[ROW][C]36[/C][C]8.46952843494122e-05[/C][C]0.000169390568698824[/C][C]0.99991530471565[/C][/ROW]
[ROW][C]37[/C][C]0.00308331822046730[/C][C]0.00616663644093461[/C][C]0.996916681779533[/C][/ROW]
[ROW][C]38[/C][C]0.00700052953927865[/C][C]0.0140010590785573[/C][C]0.992999470460721[/C][/ROW]
[ROW][C]39[/C][C]0.00662467206952394[/C][C]0.0132493441390479[/C][C]0.993375327930476[/C][/ROW]
[ROW][C]40[/C][C]0.00435915951201[/C][C]0.00871831902402[/C][C]0.99564084048799[/C][/ROW]
[ROW][C]41[/C][C]0.00295723115343102[/C][C]0.00591446230686205[/C][C]0.997042768846569[/C][/ROW]
[ROW][C]42[/C][C]0.00207884577296683[/C][C]0.00415769154593366[/C][C]0.997921154227033[/C][/ROW]
[ROW][C]43[/C][C]0.00129489771578928[/C][C]0.00258979543157855[/C][C]0.99870510228421[/C][/ROW]
[ROW][C]44[/C][C]0.000666069080354648[/C][C]0.00133213816070930[/C][C]0.999333930919645[/C][/ROW]
[ROW][C]45[/C][C]0.000356964567747544[/C][C]0.000713929135495088[/C][C]0.999643035432253[/C][/ROW]
[ROW][C]46[/C][C]0.000241165008039900[/C][C]0.000482330016079799[/C][C]0.99975883499196[/C][/ROW]
[ROW][C]47[/C][C]0.000169146132011131[/C][C]0.000338292264022262[/C][C]0.999830853867989[/C][/ROW]
[ROW][C]48[/C][C]0.000648526025659457[/C][C]0.00129705205131891[/C][C]0.99935147397434[/C][/ROW]
[ROW][C]49[/C][C]0.0304172667470327[/C][C]0.0608345334940655[/C][C]0.969582733252967[/C][/ROW]
[ROW][C]50[/C][C]0.111430120056517[/C][C]0.222860240113034[/C][C]0.888569879943483[/C][/ROW]
[ROW][C]51[/C][C]0.237336715075474[/C][C]0.474673430150948[/C][C]0.762663284924526[/C][/ROW]
[ROW][C]52[/C][C]0.462656169270677[/C][C]0.925312338541354[/C][C]0.537343830729323[/C][/ROW]
[ROW][C]53[/C][C]0.814777019816323[/C][C]0.370445960367354[/C][C]0.185222980183677[/C][/ROW]
[ROW][C]54[/C][C]0.95432298849814[/C][C]0.0913540230037172[/C][C]0.0456770115018586[/C][/ROW]
[ROW][C]55[/C][C]0.981702314433052[/C][C]0.0365953711338964[/C][C]0.0182976855669482[/C][/ROW]
[ROW][C]56[/C][C]0.96968598428929[/C][C]0.0606280314214208[/C][C]0.0303140157107104[/C][/ROW]
[ROW][C]57[/C][C]0.946364472597604[/C][C]0.107271054804793[/C][C]0.0536355274023963[/C][/ROW]
[/TABLE]
Source: https://freestatistics.org/blog/index.php?pk=57391&T=5

Globally Unique Identifier (entire table): ba.freestatistics.org/blog/index.php?pk=57391&T=5

As an alternative you can also use a QR Code:  

The GUIDs for individual cells are displayed in the table below:

Goldfeld-Quandt test for Heteroskedasticity
p-valuesAlternative Hypothesis
breakpoint indexgreater2-sidedless
50.008118277560821950.01623655512164390.991881722439178
60.002840416865152170.005680833730304350.997159583134848
70.001064314881229730.002128629762459470.99893568511877
80.0002997807769267090.0005995615538534190.999700219223073
96.01265612033006e-050.0001202531224066010.999939873438797
101.07467482217299e-052.14934964434599e-050.999989253251778
111.37765083216038e-052.75530166432076e-050.999986223491678
127.59318651739134e-061.51863730347827e-050.999992406813483
132.43235915092601e-064.86471830185201e-060.999997567640849
146.92000677261004e-071.38400135452201e-060.999999307999323
151.17159227930219e-062.34318455860439e-060.99999882840772
161.57218257481535e-063.1443651496307e-060.999998427817425
172.16668247710164e-064.33336495420327e-060.999997833317523
181.32733984988609e-062.65467969977219e-060.99999867266015
192.13565885091290e-064.27131770182581e-060.99999786434115
204.28718402389106e-068.57436804778212e-060.999995712815976
218.99499733744246e-061.79899946748849e-050.999991005002663
221.07329183548332e-052.14658367096664e-050.999989267081645
231.06881091563575e-052.1376218312715e-050.999989311890844
248.49607206808389e-061.69921441361678e-050.999991503927932
251.62579197194497e-053.25158394388994e-050.99998374208028
263.70368215287395e-057.4073643057479e-050.999962963178471
274.93171207163528e-059.86342414327056e-050.999950682879284
284.80794882803616e-059.61589765607232e-050.99995192051172
293.67097292420779e-057.34194584841559e-050.999963290270758
304.43576366215563e-058.87152732431125e-050.999955642363378
313.68591096526156e-057.37182193052313e-050.999963140890347
321.74185603706717e-053.48371207413435e-050.99998258143963
337.62166731968274e-061.52433346393655e-050.99999237833268
343.29915728941395e-066.5983145788279e-060.99999670084271
351.08914171767746e-052.17828343535492e-050.999989108582823
368.46952843494122e-050.0001693905686988240.99991530471565
370.003083318220467300.006166636440934610.996916681779533
380.007000529539278650.01400105907855730.992999470460721
390.006624672069523940.01324934413904790.993375327930476
400.004359159512010.008718319024020.99564084048799
410.002957231153431020.005914462306862050.997042768846569
420.002078845772966830.004157691545933660.997921154227033
430.001294897715789280.002589795431578550.99870510228421
440.0006660690803546480.001332138160709300.999333930919645
450.0003569645677475440.0007139291354950880.999643035432253
460.0002411650080399000.0004823300160797990.99975883499196
470.0001691461320111310.0003382922640222620.999830853867989
480.0006485260256594570.001297052051318910.99935147397434
490.03041726674703270.06083453349406550.969582733252967
500.1114301200565170.2228602401130340.888569879943483
510.2373367150754740.4746734301509480.762663284924526
520.4626561692706770.9253123385413540.537343830729323
530.8147770198163230.3704459603673540.185222980183677
540.954322988498140.09135402300371720.0456770115018586
550.9817023144330520.03659537113389640.0182976855669482
560.969685984289290.06062803142142080.0303140157107104
570.9463644725976040.1072710548047930.0536355274023963


Meta Analysis of Goldfeld-Quandt test for Heteroskedasticity
Description# significant tests% significant testsOK/NOK
1% type I error level410.773584905660377NOK
5% type I error level450.849056603773585NOK
10% type I error level480.90566037735849NOK

\begin{tabular}{lllllllll}
\hline
Meta Analysis of Goldfeld-Quandt test for Heteroskedasticity \tabularnewline
Description & # significant tests & % significant tests & OK/NOK \tabularnewline
1% type I error level & 41 & 0.773584905660377 & NOK \tabularnewline
5% type I error level & 45 & 0.849056603773585 & NOK \tabularnewline
10% type I error level & 48 & 0.90566037735849 & NOK \tabularnewline
\hline
\end{tabular}
%Source: https://freestatistics.org/blog/index.php?pk=57391&T=6

[TABLE]
[ROW][C]Meta Analysis of Goldfeld-Quandt test for Heteroskedasticity[/C][/ROW]
[ROW][C]Description[/C][C]# significant tests[/C][C]% significant tests[/C][C]OK/NOK[/C][/ROW]
[ROW][C]1% type I error level[/C][C]41[/C][C]0.773584905660377[/C][C]NOK[/C][/ROW]
[ROW][C]5% type I error level[/C][C]45[/C][C]0.849056603773585[/C][C]NOK[/C][/ROW]
[ROW][C]10% type I error level[/C][C]48[/C][C]0.90566037735849[/C][C]NOK[/C][/ROW]
[/TABLE]
Source: https://freestatistics.org/blog/index.php?pk=57391&T=6

Globally Unique Identifier (entire table): ba.freestatistics.org/blog/index.php?pk=57391&T=6

As an alternative you can also use a QR Code:  

The GUIDs for individual cells are displayed in the table below:

Meta Analysis of Goldfeld-Quandt test for Heteroskedasticity
Description# significant tests% significant testsOK/NOK
1% type I error level410.773584905660377NOK
5% type I error level450.849056603773585NOK
10% type I error level480.90566037735849NOK


Parameters (Session):
par1 = 1 ; par2 = Do not include Seasonal Dummies ; par3 = No Linear Trend ;
Parameters (R input):
par1 = 1 ; par2 = Do not include Seasonal Dummies ; par3 = No Linear Trend ;
R code (references can be found in the software module):
library(lattice)
library(lmtest)
n25 <- 25 #minimum number of obs. for Goldfeld-Quandt test
par1 <- as.numeric(par1)
x <- t(y)
k <- length(x[1,])
n <- length(x[,1])
x1 <- cbind(x[,par1], x[,1:k!=par1])
mycolnames <- c(colnames(x)[par1], colnames(x)[1:k!=par1])
colnames(x1) <- mycolnames #colnames(x)[par1]
x <- x1
if (par3 == 'First Differences'){
x2 <- array(0, dim=c(n-1,k), dimnames=list(1:(n-1), paste('(1-B)',colnames(x),sep='')))
for (i in 1:n-1) {
for (j in 1:k) {
x2[i,j] <- x[i+1,j] - x[i,j]
}
}
x <- x2
}
if (par2 == 'Include Monthly Dummies'){
x2 <- array(0, dim=c(n,11), dimnames=list(1:n, paste('M', seq(1:11), sep ='')))
for (i in 1:11){
x2[seq(i,n,12),i] <- 1
}
x <- cbind(x, x2)
}
if (par2 == 'Include Quarterly Dummies'){
x2 <- array(0, dim=c(n,3), dimnames=list(1:n, paste('Q', seq(1:3), sep ='')))
for (i in 1:3){
x2[seq(i,n,4),i] <- 1
}
x <- cbind(x, x2)
}
k <- length(x[1,])
if (par3 == 'Linear Trend'){
x <- cbind(x, c(1:n))
colnames(x)[k+1] <- 't'
}
x
k <- length(x[1,])
df <- as.data.frame(x)
(mylm <- lm(df))
(mysum <- summary(mylm))
if (n > n25) {
kp3 <- k + 3
nmkm3 <- n - k - 3
gqarr <- array(NA, dim=c(nmkm3-kp3+1,3))
numgqtests <- 0
numsignificant1 <- 0
numsignificant5 <- 0
numsignificant10 <- 0
for (mypoint in kp3:nmkm3) {
j <- 0
numgqtests <- numgqtests + 1
for (myalt in c('greater', 'two.sided', 'less')) {
j <- j + 1
gqarr[mypoint-kp3+1,j] <- gqtest(mylm, point=mypoint, alternative=myalt)$p.value
}
if (gqarr[mypoint-kp3+1,2] < 0.01) numsignificant1 <- numsignificant1 + 1
if (gqarr[mypoint-kp3+1,2] < 0.05) numsignificant5 <- numsignificant5 + 1
if (gqarr[mypoint-kp3+1,2] < 0.10) numsignificant10 <- numsignificant10 + 1
}
gqarr
}
bitmap(file='test0.png')
plot(x[,1], type='l', main='Actuals and Interpolation', ylab='value of Actuals and Interpolation (dots)', xlab='time or index')
points(x[,1]-mysum$resid)
grid()
dev.off()
bitmap(file='test1.png')
plot(mysum$resid, type='b', pch=19, main='Residuals', ylab='value of Residuals', xlab='time or index')
grid()
dev.off()
bitmap(file='test2.png')
hist(mysum$resid, main='Residual Histogram', xlab='values of Residuals')
grid()
dev.off()
bitmap(file='test3.png')
densityplot(~mysum$resid,col='black',main='Residual Density Plot', xlab='values of Residuals')
dev.off()
bitmap(file='test4.png')
qqnorm(mysum$resid, main='Residual Normal Q-Q Plot')
qqline(mysum$resid)
grid()
dev.off()
(myerror <- as.ts(mysum$resid))
bitmap(file='test5.png')
dum <- cbind(lag(myerror,k=1),myerror)
dum
dum1 <- dum[2:length(myerror),]
dum1
z <- as.data.frame(dum1)
z
plot(z,main=paste('Residual Lag plot, lowess, and regression line'), ylab='values of Residuals', xlab='lagged values of Residuals')
lines(lowess(z))
abline(lm(z))
grid()
dev.off()
bitmap(file='test6.png')
acf(mysum$resid, lag.max=length(mysum$resid)/2, main='Residual Autocorrelation Function')
grid()
dev.off()
bitmap(file='test7.png')
pacf(mysum$resid, lag.max=length(mysum$resid)/2, main='Residual Partial Autocorrelation Function')
grid()
dev.off()
bitmap(file='test8.png')
opar <- par(mfrow = c(2,2), oma = c(0, 0, 1.1, 0))
plot(mylm, las = 1, sub='Residual Diagnostics')
par(opar)
dev.off()
if (n > n25) {
bitmap(file='test9.png')
plot(kp3:nmkm3,gqarr[,2], main='Goldfeld-Quandt test',ylab='2-sided p-value',xlab='breakpoint')
grid()
dev.off()
}
load(file='createtable')
a<-table.start()
a<-table.row.start(a)
a<-table.element(a, 'Multiple Linear Regression - Estimated Regression Equation', 1, TRUE)
a<-table.row.end(a)
myeq <- colnames(x)[1]
myeq <- paste(myeq, '[t] = ', sep='')
for (i in 1:k){
if (mysum$coefficients[i,1] > 0) myeq <- paste(myeq, '+', '')
myeq <- paste(myeq, mysum$coefficients[i,1], sep=' ')
if (rownames(mysum$coefficients)[i] != '(Intercept)') {
myeq <- paste(myeq, rownames(mysum$coefficients)[i], sep='')
if (rownames(mysum$coefficients)[i] != 't') myeq <- paste(myeq, '[t]', sep='')
}
}
myeq <- paste(myeq, ' + e[t]')
a<-table.row.start(a)
a<-table.element(a, myeq)
a<-table.row.end(a)
a<-table.end(a)
table.save(a,file='mytable1.tab')
a<-table.start()
a<-table.row.start(a)
a<-table.element(a,hyperlink('ols1.htm','Multiple Linear Regression - Ordinary Least Squares',''), 6, TRUE)
a<-table.row.end(a)
a<-table.row.start(a)
a<-table.element(a,'Variable',header=TRUE)
a<-table.element(a,'Parameter',header=TRUE)
a<-table.element(a,'S.D.',header=TRUE)
a<-table.element(a,'T-STAT
H0: parameter = 0',header=TRUE)
a<-table.element(a,'2-tail p-value',header=TRUE)
a<-table.element(a,'1-tail p-value',header=TRUE)
a<-table.row.end(a)
for (i in 1:k){
a<-table.row.start(a)
a<-table.element(a,rownames(mysum$coefficients)[i],header=TRUE)
a<-table.element(a,mysum$coefficients[i,1])
a<-table.element(a, round(mysum$coefficients[i,2],6))
a<-table.element(a, round(mysum$coefficients[i,3],4))
a<-table.element(a, round(mysum$coefficients[i,4],6))
a<-table.element(a, round(mysum$coefficients[i,4]/2,6))
a<-table.row.end(a)
}
a<-table.end(a)
table.save(a,file='mytable2.tab')
a<-table.start()
a<-table.row.start(a)
a<-table.element(a, 'Multiple Linear Regression - Regression Statistics', 2, TRUE)
a<-table.row.end(a)
a<-table.row.start(a)
a<-table.element(a, 'Multiple R',1,TRUE)
a<-table.element(a, sqrt(mysum$r.squared))
a<-table.row.end(a)
a<-table.row.start(a)
a<-table.element(a, 'R-squared',1,TRUE)
a<-table.element(a, mysum$r.squared)
a<-table.row.end(a)
a<-table.row.start(a)
a<-table.element(a, 'Adjusted R-squared',1,TRUE)
a<-table.element(a, mysum$adj.r.squared)
a<-table.row.end(a)
a<-table.row.start(a)
a<-table.element(a, 'F-TEST (value)',1,TRUE)
a<-table.element(a, mysum$fstatistic[1])
a<-table.row.end(a)
a<-table.row.start(a)
a<-table.element(a, 'F-TEST (DF numerator)',1,TRUE)
a<-table.element(a, mysum$fstatistic[2])
a<-table.row.end(a)
a<-table.row.start(a)
a<-table.element(a, 'F-TEST (DF denominator)',1,TRUE)
a<-table.element(a, mysum$fstatistic[3])
a<-table.row.end(a)
a<-table.row.start(a)
a<-table.element(a, 'p-value',1,TRUE)
a<-table.element(a, 1-pf(mysum$fstatistic[1],mysum$fstatistic[2],mysum$fstatistic[3]))
a<-table.row.end(a)
a<-table.row.start(a)
a<-table.element(a, 'Multiple Linear Regression - Residual Statistics', 2, TRUE)
a<-table.row.end(a)
a<-table.row.start(a)
a<-table.element(a, 'Residual Standard Deviation',1,TRUE)
a<-table.element(a, mysum$sigma)
a<-table.row.end(a)
a<-table.row.start(a)
a<-table.element(a, 'Sum Squared Residuals',1,TRUE)
a<-table.element(a, sum(myerror*myerror))
a<-table.row.end(a)
a<-table.end(a)
table.save(a,file='mytable3.tab')
a<-table.start()
a<-table.row.start(a)
a<-table.element(a, 'Multiple Linear Regression - Actuals, Interpolation, and Residuals', 4, TRUE)
a<-table.row.end(a)
a<-table.row.start(a)
a<-table.element(a, 'Time or Index', 1, TRUE)
a<-table.element(a, 'Actuals', 1, TRUE)
a<-table.element(a, 'Interpolation
Forecast', 1, TRUE)
a<-table.element(a, 'Residuals
Prediction Error', 1, TRUE)
a<-table.row.end(a)
for (i in 1:n) {
a<-table.row.start(a)
a<-table.element(a,i, 1, TRUE)
a<-table.element(a,x[i])
a<-table.element(a,x[i]-mysum$resid[i])
a<-table.element(a,mysum$resid[i])
a<-table.row.end(a)
}
a<-table.end(a)
table.save(a,file='mytable4.tab')
if (n > n25) {
a<-table.start()
a<-table.row.start(a)
a<-table.element(a,'Goldfeld-Quandt test for Heteroskedasticity',4,TRUE)
a<-table.row.end(a)
a<-table.row.start(a)
a<-table.element(a,'p-values',header=TRUE)
a<-table.element(a,'Alternative Hypothesis',3,header=TRUE)
a<-table.row.end(a)
a<-table.row.start(a)
a<-table.element(a,'breakpoint index',header=TRUE)
a<-table.element(a,'greater',header=TRUE)
a<-table.element(a,'2-sided',header=TRUE)
a<-table.element(a,'less',header=TRUE)
a<-table.row.end(a)
for (mypoint in kp3:nmkm3) {
a<-table.row.start(a)
a<-table.element(a,mypoint,header=TRUE)
a<-table.element(a,gqarr[mypoint-kp3+1,1])
a<-table.element(a,gqarr[mypoint-kp3+1,2])
a<-table.element(a,gqarr[mypoint-kp3+1,3])
a<-table.row.end(a)
}
a<-table.end(a)
table.save(a,file='mytable5.tab')
a<-table.start()
a<-table.row.start(a)
a<-table.element(a,'Meta Analysis of Goldfeld-Quandt test for Heteroskedasticity',4,TRUE)
a<-table.row.end(a)
a<-table.row.start(a)
a<-table.element(a,'Description',header=TRUE)
a<-table.element(a,'# significant tests',header=TRUE)
a<-table.element(a,'% significant tests',header=TRUE)
a<-table.element(a,'OK/NOK',header=TRUE)
a<-table.row.end(a)
a<-table.row.start(a)
a<-table.element(a,'1% type I error level',header=TRUE)
a<-table.element(a,numsignificant1)
a<-table.element(a,numsignificant1/numgqtests)
if (numsignificant1/numgqtests < 0.01) dum <- 'OK' else dum <- 'NOK'
a<-table.element(a,dum)
a<-table.row.end(a)
a<-table.row.start(a)
a<-table.element(a,'5% type I error level',header=TRUE)
a<-table.element(a,numsignificant5)
a<-table.element(a,numsignificant5/numgqtests)
if (numsignificant5/numgqtests < 0.05) dum <- 'OK' else dum <- 'NOK'
a<-table.element(a,dum)
a<-table.row.end(a)
a<-table.row.start(a)
a<-table.element(a,'10% type I error level',header=TRUE)
a<-table.element(a,numsignificant10)
a<-table.element(a,numsignificant10/numgqtests)
if (numsignificant10/numgqtests < 0.1) dum <- 'OK' else dum <- 'NOK'
a<-table.element(a,dum)
a<-table.row.end(a)
a<-table.end(a)
table.save(a,file='mytable6.tab')
}