Free Statistics

of Irreproducible Research!

Author's title

Author*The author of this computation has been verified*
R Software Modulerwasp_multipleregression.wasp
Title produced by softwareMultiple Regression
Date of computationTue, 17 Nov 2009 11:45:47 -0700
Cite this page as followsStatistical Computations at FreeStatistics.org, Office for Research Development and Education, URL https://freestatistics.org/blog/index.php?v=date/2009/Nov/17/t1258483728oj87c4g6v15cej4.htm/, Retrieved Thu, 02 May 2024 06:09:01 +0000
Statistical Computations at FreeStatistics.org, Office for Research Development and Education, URL https://freestatistics.org/blog/index.php?pk=57400, Retrieved Thu, 02 May 2024 06:09:01 +0000
QR Codes:

Original text written by user:
IsPrivate?No (this computation is public)
User-defined keywordsgebruik van het verleden
Estimated Impact187
Family? (F = Feedback message, R = changed R code, M = changed R Module, P = changed Parameters, D = changed Data)
-       [Multiple Regression] [w7] [2009-11-17 18:45:47] [a931a0a30926b49d162330b43e89b999] [Current]
Feedback Forum

Post a new message
Dataseries X:
317539	277915	317480	328282	326011	325412
313737	277128	317539	317480	328282	326011
312276	277103	313737	317539	317480	328282
309391	275037	312276	313737	317539	317480
302950	270150	309391	312276	313737	317539
300316	267140	302950	309391	312276	313737
304035	264993	300316	302950	309391	312276
333476	287259	304035	300316	302950	309391
337698	291186	333476	304035	300316	302950
335932	292300	337698	333476	304035	300316
323931	288186	335932	337698	333476	304035
313927	281477	323931	335932	337698	333476
314485	282656	313927	323931	335932	337698
313218	280190	314485	313927	323931	335932
309664	280408	313218	314485	313927	323931
302963	276836	309664	313218	314485	313927
298989	275216	302963	309664	313218	314485
298423	274352	298989	302963	309664	313218
310631	271311	298423	298989	302963	309664
329765	289802	310631	298423	298989	302963
335083	290726	329765	310631	298423	298989
327616	292300	335083	329765	310631	298423
309119	278506	327616	335083	329765	310631
295916	269826	309119	327616	335083	329765
291413	265861	295916	309119	327616	335083
291542	269034	291413	295916	309119	327616
284678	264176	291542	291413	295916	309119
276475	255198	284678	291542	291413	295916
272566	253353	276475	284678	291542	291413
264981	246057	272566	276475	284678	291542
263290	235372	264981	272566	276475	284678
296806	258556	263290	264981	272566	276475
303598	260993	296806	263290	264981	272566
286994	254663	303598	296806	263290	264981
276427	250643	286994	303598	296806	263290
266424	243422	276427	286994	303598	296806
267153	247105	266424	276427	286994	303598
268381	248541	267153	266424	276427	286994
262522	245039	268381	267153	266424	276427
255542	237080	262522	268381	267153	266424
253158	237085	255542	262522	268381	267153
243803	225554	253158	255542	262522	268381
250741	226839	243803	253158	255542	262522
280445	247934	250741	243803	253158	255542
285257	248333	280445	250741	243803	253158
270976	246969	285257	280445	250741	243803
261076	245098	270976	285257	280445	250741
255603	246263	261076	270976	285257	280445
260376	255765	255603	261076	270976	285257
263903	264319	260376	255603	261076	270976
264291	268347	263903	260376	255603	261076
263276	273046	264291	263903	260376	255603
262572	273963	263276	264291	263903	260376
256167	267430	262572	263276	264291	263903
264221	271993	256167	262572	263276	264291
293860	292710	264221	256167	262572	263276
300713	295881	293860	264221	256167	262572
287224	293299	300713	293860	264221	256167


Summary of computational transaction
Raw Inputview raw input (R code)
Raw Outputview raw output of R engine
Computing time6 seconds
R Server'Gwilym Jenkins' @ 72.249.127.135

\begin{tabular}{lllllllll}
\hline
Summary of computational transaction \tabularnewline
Raw Input & view raw input (R code)  \tabularnewline
Raw Output & view raw output of R engine  \tabularnewline
Computing time & 6 seconds \tabularnewline
R Server & 'Gwilym Jenkins' @ 72.249.127.135 \tabularnewline
\hline
\end{tabular}
%Source: https://freestatistics.org/blog/index.php?pk=57400&T=0

[TABLE]
[ROW][C]Summary of computational transaction[/C][/ROW]
[ROW][C]Raw Input[/C][C]view raw input (R code) [/C][/ROW]
[ROW][C]Raw Output[/C][C]view raw output of R engine [/C][/ROW]
[ROW][C]Computing time[/C][C]6 seconds[/C][/ROW]
[ROW][C]R Server[/C][C]'Gwilym Jenkins' @ 72.249.127.135[/C][/ROW]
[/TABLE]
Source: https://freestatistics.org/blog/index.php?pk=57400&T=0

Globally Unique Identifier (entire table): ba.freestatistics.org/blog/index.php?pk=57400&T=0

As an alternative you can also use a QR Code:  

The GUIDs for individual cells are displayed in the table below:

Summary of computational transaction
Raw Inputview raw input (R code)
Raw Outputview raw output of R engine
Computing time6 seconds
R Server'Gwilym Jenkins' @ 72.249.127.135


Multiple Linear Regression - Estimated Regression Equation
Werkl_vrouwen[t] = + 82576.7903847561 + 0.436927705666708Werkl_mannen[t] + 0.317624637736993`Y_(t)min1`[t] -0.0756883129422179`Y_(t)min2`[t] + 0.058290675108108`Y_(t)min3`[t] + 0.0518235382082249`Y_(t)min4`[t] + 2258.83977242412M1[t] + 2068.42127400081M2[t] + 664.958110818836M3[t] -749.291296780444M4[t] -1634.68943047626M5[t] -2882.0562388897M6[t] + 6329.72868498853M7[t] + 24173.9764088581M8[t] + 21359.3703085145M9[t] + 12184.9433848399M10[t] + 5209.94835691973M11[t] -587.031622280736t + e[t]

\begin{tabular}{lllllllll}
\hline
Multiple Linear Regression - Estimated Regression Equation \tabularnewline
Werkl_vrouwen[t] =  +  82576.7903847561 +  0.436927705666708Werkl_mannen[t] +  0.317624637736993`Y_(t)min1`[t] -0.0756883129422179`Y_(t)min2`[t] +  0.058290675108108`Y_(t)min3`[t] +  0.0518235382082249`Y_(t)min4`[t] +  2258.83977242412M1[t] +  2068.42127400081M2[t] +  664.958110818836M3[t] -749.291296780444M4[t] -1634.68943047626M5[t] -2882.0562388897M6[t] +  6329.72868498853M7[t] +  24173.9764088581M8[t] +  21359.3703085145M9[t] +  12184.9433848399M10[t] +  5209.94835691973M11[t] -587.031622280736t  + e[t] \tabularnewline
\hline
\end{tabular}
%Source: https://freestatistics.org/blog/index.php?pk=57400&T=1

[TABLE]
[ROW][C]Multiple Linear Regression - Estimated Regression Equation[/C][/ROW]
[ROW][C]Werkl_vrouwen[t] =  +  82576.7903847561 +  0.436927705666708Werkl_mannen[t] +  0.317624637736993`Y_(t)min1`[t] -0.0756883129422179`Y_(t)min2`[t] +  0.058290675108108`Y_(t)min3`[t] +  0.0518235382082249`Y_(t)min4`[t] +  2258.83977242412M1[t] +  2068.42127400081M2[t] +  664.958110818836M3[t] -749.291296780444M4[t] -1634.68943047626M5[t] -2882.0562388897M6[t] +  6329.72868498853M7[t] +  24173.9764088581M8[t] +  21359.3703085145M9[t] +  12184.9433848399M10[t] +  5209.94835691973M11[t] -587.031622280736t  + e[t][/C][/ROW]
[/TABLE]
Source: https://freestatistics.org/blog/index.php?pk=57400&T=1

Globally Unique Identifier (entire table): ba.freestatistics.org/blog/index.php?pk=57400&T=1

As an alternative you can also use a QR Code:  

The GUIDs for individual cells are displayed in the table below:

Multiple Linear Regression - Estimated Regression Equation
Werkl_vrouwen[t] = + 82576.7903847561 + 0.436927705666708Werkl_mannen[t] + 0.317624637736993`Y_(t)min1`[t] -0.0756883129422179`Y_(t)min2`[t] + 0.058290675108108`Y_(t)min3`[t] + 0.0518235382082249`Y_(t)min4`[t] + 2258.83977242412M1[t] + 2068.42127400081M2[t] + 664.958110818836M3[t] -749.291296780444M4[t] -1634.68943047626M5[t] -2882.0562388897M6[t] + 6329.72868498853M7[t] + 24173.9764088581M8[t] + 21359.3703085145M9[t] + 12184.9433848399M10[t] + 5209.94835691973M11[t] -587.031622280736t + e[t]


Multiple Linear Regression - Ordinary Least Squares
VariableParameterS.D.T-STATH0: parameter = 02-tail p-value1-tail p-value
(Intercept)82576.790384756117389.5842574.74862.6e-051.3e-05
Werkl_mannen0.4369277056667080.0594747.346500
`Y_(t)min1`0.3176246377369930.1360152.33520.0246350.012317
`Y_(t)min2`-0.07568831294221790.135499-0.55860.5795560.289778
`Y_(t)min3`0.0582906751081080.1339210.43530.6657130.332857
`Y_(t)min4`0.05182353820822490.0924350.56060.5781640.289082
M12258.839772424122484.1820740.90930.3686440.184322
M22068.421274000812880.1925810.71820.4768360.238418
M3664.9581108188363016.4459790.22040.8266470.413323
M4-749.2912967804442494.36901-0.30040.7654330.382717
M5-1634.689430476262466.953743-0.66260.5113650.255682
M6-2882.05623888972566.122012-1.12310.2680840.134042
M76329.728684988532760.030062.29340.0271610.01358
M824173.97640885813487.6470386.931300
M921359.37030851454934.9070724.32829.8e-054.9e-05
M1012184.94338483994576.339842.66260.0111150.005558
M115209.948356919733290.2935351.58340.1211990.0606
t-587.03162228073692.664886-6.33500

\begin{tabular}{lllllllll}
\hline
Multiple Linear Regression - Ordinary Least Squares \tabularnewline
Variable & Parameter & S.D. & T-STATH0: parameter = 0 & 2-tail p-value & 1-tail p-value \tabularnewline
(Intercept) & 82576.7903847561 & 17389.584257 & 4.7486 & 2.6e-05 & 1.3e-05 \tabularnewline
Werkl_mannen & 0.436927705666708 & 0.059474 & 7.3465 & 0 & 0 \tabularnewline
`Y_(t)min1` & 0.317624637736993 & 0.136015 & 2.3352 & 0.024635 & 0.012317 \tabularnewline
`Y_(t)min2` & -0.0756883129422179 & 0.135499 & -0.5586 & 0.579556 & 0.289778 \tabularnewline
`Y_(t)min3` & 0.058290675108108 & 0.133921 & 0.4353 & 0.665713 & 0.332857 \tabularnewline
`Y_(t)min4` & 0.0518235382082249 & 0.092435 & 0.5606 & 0.578164 & 0.289082 \tabularnewline
M1 & 2258.83977242412 & 2484.182074 & 0.9093 & 0.368644 & 0.184322 \tabularnewline
M2 & 2068.42127400081 & 2880.192581 & 0.7182 & 0.476836 & 0.238418 \tabularnewline
M3 & 664.958110818836 & 3016.445979 & 0.2204 & 0.826647 & 0.413323 \tabularnewline
M4 & -749.291296780444 & 2494.36901 & -0.3004 & 0.765433 & 0.382717 \tabularnewline
M5 & -1634.68943047626 & 2466.953743 & -0.6626 & 0.511365 & 0.255682 \tabularnewline
M6 & -2882.0562388897 & 2566.122012 & -1.1231 & 0.268084 & 0.134042 \tabularnewline
M7 & 6329.72868498853 & 2760.03006 & 2.2934 & 0.027161 & 0.01358 \tabularnewline
M8 & 24173.9764088581 & 3487.647038 & 6.9313 & 0 & 0 \tabularnewline
M9 & 21359.3703085145 & 4934.907072 & 4.3282 & 9.8e-05 & 4.9e-05 \tabularnewline
M10 & 12184.9433848399 & 4576.33984 & 2.6626 & 0.011115 & 0.005558 \tabularnewline
M11 & 5209.94835691973 & 3290.293535 & 1.5834 & 0.121199 & 0.0606 \tabularnewline
t & -587.031622280736 & 92.664886 & -6.335 & 0 & 0 \tabularnewline
\hline
\end{tabular}
%Source: https://freestatistics.org/blog/index.php?pk=57400&T=2

[TABLE]
[ROW][C]Multiple Linear Regression - Ordinary Least Squares[/C][/ROW]
[ROW][C]Variable[/C][C]Parameter[/C][C]S.D.[/C][C]T-STATH0: parameter = 0[/C][C]2-tail p-value[/C][C]1-tail p-value[/C][/ROW]
[ROW][C](Intercept)[/C][C]82576.7903847561[/C][C]17389.584257[/C][C]4.7486[/C][C]2.6e-05[/C][C]1.3e-05[/C][/ROW]
[ROW][C]Werkl_mannen[/C][C]0.436927705666708[/C][C]0.059474[/C][C]7.3465[/C][C]0[/C][C]0[/C][/ROW]
[ROW][C]`Y_(t)min1`[/C][C]0.317624637736993[/C][C]0.136015[/C][C]2.3352[/C][C]0.024635[/C][C]0.012317[/C][/ROW]
[ROW][C]`Y_(t)min2`[/C][C]-0.0756883129422179[/C][C]0.135499[/C][C]-0.5586[/C][C]0.579556[/C][C]0.289778[/C][/ROW]
[ROW][C]`Y_(t)min3`[/C][C]0.058290675108108[/C][C]0.133921[/C][C]0.4353[/C][C]0.665713[/C][C]0.332857[/C][/ROW]
[ROW][C]`Y_(t)min4`[/C][C]0.0518235382082249[/C][C]0.092435[/C][C]0.5606[/C][C]0.578164[/C][C]0.289082[/C][/ROW]
[ROW][C]M1[/C][C]2258.83977242412[/C][C]2484.182074[/C][C]0.9093[/C][C]0.368644[/C][C]0.184322[/C][/ROW]
[ROW][C]M2[/C][C]2068.42127400081[/C][C]2880.192581[/C][C]0.7182[/C][C]0.476836[/C][C]0.238418[/C][/ROW]
[ROW][C]M3[/C][C]664.958110818836[/C][C]3016.445979[/C][C]0.2204[/C][C]0.826647[/C][C]0.413323[/C][/ROW]
[ROW][C]M4[/C][C]-749.291296780444[/C][C]2494.36901[/C][C]-0.3004[/C][C]0.765433[/C][C]0.382717[/C][/ROW]
[ROW][C]M5[/C][C]-1634.68943047626[/C][C]2466.953743[/C][C]-0.6626[/C][C]0.511365[/C][C]0.255682[/C][/ROW]
[ROW][C]M6[/C][C]-2882.0562388897[/C][C]2566.122012[/C][C]-1.1231[/C][C]0.268084[/C][C]0.134042[/C][/ROW]
[ROW][C]M7[/C][C]6329.72868498853[/C][C]2760.03006[/C][C]2.2934[/C][C]0.027161[/C][C]0.01358[/C][/ROW]
[ROW][C]M8[/C][C]24173.9764088581[/C][C]3487.647038[/C][C]6.9313[/C][C]0[/C][C]0[/C][/ROW]
[ROW][C]M9[/C][C]21359.3703085145[/C][C]4934.907072[/C][C]4.3282[/C][C]9.8e-05[/C][C]4.9e-05[/C][/ROW]
[ROW][C]M10[/C][C]12184.9433848399[/C][C]4576.33984[/C][C]2.6626[/C][C]0.011115[/C][C]0.005558[/C][/ROW]
[ROW][C]M11[/C][C]5209.94835691973[/C][C]3290.293535[/C][C]1.5834[/C][C]0.121199[/C][C]0.0606[/C][/ROW]
[ROW][C]t[/C][C]-587.031622280736[/C][C]92.664886[/C][C]-6.335[/C][C]0[/C][C]0[/C][/ROW]
[/TABLE]
Source: https://freestatistics.org/blog/index.php?pk=57400&T=2

Globally Unique Identifier (entire table): ba.freestatistics.org/blog/index.php?pk=57400&T=2

As an alternative you can also use a QR Code:  

The GUIDs for individual cells are displayed in the table below:

Multiple Linear Regression - Ordinary Least Squares
VariableParameterS.D.T-STATH0: parameter = 02-tail p-value1-tail p-value
(Intercept)82576.790384756117389.5842574.74862.6e-051.3e-05
Werkl_mannen0.4369277056667080.0594747.346500
`Y_(t)min1`0.3176246377369930.1360152.33520.0246350.012317
`Y_(t)min2`-0.07568831294221790.135499-0.55860.5795560.289778
`Y_(t)min3`0.0582906751081080.1339210.43530.6657130.332857
`Y_(t)min4`0.05182353820822490.0924350.56060.5781640.289082
M12258.839772424122484.1820740.90930.3686440.184322
M22068.421274000812880.1925810.71820.4768360.238418
M3664.9581108188363016.4459790.22040.8266470.413323
M4-749.2912967804442494.36901-0.30040.7654330.382717
M5-1634.689430476262466.953743-0.66260.5113650.255682
M6-2882.05623888972566.122012-1.12310.2680840.134042
M76329.728684988532760.030062.29340.0271610.01358
M824173.97640885813487.6470386.931300
M921359.37030851454934.9070724.32829.8e-054.9e-05
M1012184.94338483994576.339842.66260.0111150.005558
M115209.948356919733290.2935351.58340.1211990.0606
t-587.03162228073692.664886-6.33500


Multiple Linear Regression - Regression Statistics
Multiple R0.996429367559543
R-squared0.99287148453511
Adjusted R-squared0.989841865462533
F-TEST (value)327.721558634855
F-TEST (DF numerator)17
F-TEST (DF denominator)40
p-value0
Multiple Linear Regression - Residual Statistics
Residual Standard Deviation2577.79856971278
Sum Squared Residuals265801818.640531

\begin{tabular}{lllllllll}
\hline
Multiple Linear Regression - Regression Statistics \tabularnewline
Multiple R & 0.996429367559543 \tabularnewline
R-squared & 0.99287148453511 \tabularnewline
Adjusted R-squared & 0.989841865462533 \tabularnewline
F-TEST (value) & 327.721558634855 \tabularnewline
F-TEST (DF numerator) & 17 \tabularnewline
F-TEST (DF denominator) & 40 \tabularnewline
p-value & 0 \tabularnewline
Multiple Linear Regression - Residual Statistics \tabularnewline
Residual Standard Deviation & 2577.79856971278 \tabularnewline
Sum Squared Residuals & 265801818.640531 \tabularnewline
\hline
\end{tabular}
%Source: https://freestatistics.org/blog/index.php?pk=57400&T=3

[TABLE]
[ROW][C]Multiple Linear Regression - Regression Statistics[/C][/ROW]
[ROW][C]Multiple R[/C][C]0.996429367559543[/C][/ROW]
[ROW][C]R-squared[/C][C]0.99287148453511[/C][/ROW]
[ROW][C]Adjusted R-squared[/C][C]0.989841865462533[/C][/ROW]
[ROW][C]F-TEST (value)[/C][C]327.721558634855[/C][/ROW]
[ROW][C]F-TEST (DF numerator)[/C][C]17[/C][/ROW]
[ROW][C]F-TEST (DF denominator)[/C][C]40[/C][/ROW]
[ROW][C]p-value[/C][C]0[/C][/ROW]
[ROW][C]Multiple Linear Regression - Residual Statistics[/C][/ROW]
[ROW][C]Residual Standard Deviation[/C][C]2577.79856971278[/C][/ROW]
[ROW][C]Sum Squared Residuals[/C][C]265801818.640531[/C][/ROW]
[/TABLE]
Source: https://freestatistics.org/blog/index.php?pk=57400&T=3

Globally Unique Identifier (entire table): ba.freestatistics.org/blog/index.php?pk=57400&T=3

As an alternative you can also use a QR Code:  

The GUIDs for individual cells are displayed in the table below:

Multiple Linear Regression - Regression Statistics
Multiple R0.996429367559543
R-squared0.99287148453511
Adjusted R-squared0.989841865462533
F-TEST (value)327.721558634855
F-TEST (DF numerator)17
F-TEST (DF denominator)40
p-value0
Multiple Linear Regression - Residual Statistics
Residual Standard Deviation2577.79856971278
Sum Squared Residuals265801818.640531


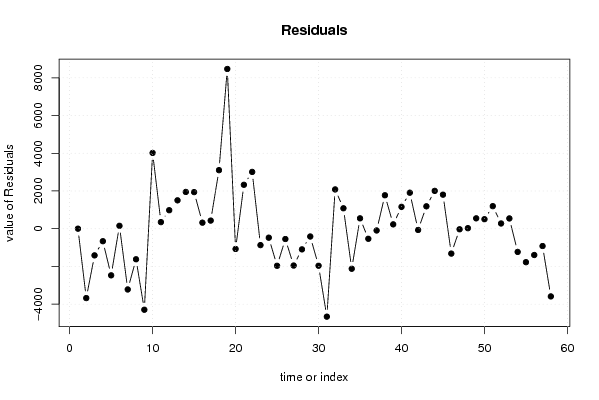
Multiple Linear Regression - Actuals, Interpolation, and Residuals
Time or IndexActualsInterpolationForecastResidualsPrediction Error
1317539317537.1235927911.87640720927732
2313737317415.556800312-3678.55680031212
3312276313690.099721821-1414.09972182126
4309391310053.484712213-662.484712212509
5302950305421.459245973-2471.45924597340
6300316300162.253143796153.746856203874
7304035307255.925002180-3220.92500217969
8333476335097.421296075-1621.42129607499
9337698341993.967749553-4295.96774955263
10335932331912.198087994019.8019120096
11323931323581.037193645349.962806354765
12313927312946.401538996980.598461004077
13314485312980.0236678931504.97633210677
14313218311268.4634950981949.53650490186
15309664307723.4802590181940.51974098216
16302963302642.636114952320.363885047909
17298989298558.040291475430.959708525252
18298423295318.2579155003104.74208450051
19310631302160.5372061468470.4627938537
20329765330838.468003424-1073.46800342374
21335083332755.0391119462327.96088805417
22327616324604.4928574533011.50714254720
23309119309989.267349041-870.267349041006
24295916296391.397983473-475.397983472996
25291413293377.537518258-1964.53751825767
26291542292090.339082405-548.339082405024
27284678286630.855784570-1952.85578457043
28276475277570.189422443-1095.18942244345
29272566272979.835830728-413.835830727965
30264981266943.467424127-1962.46742412741
31263290267952.455754559-4662.45575455911
32296806294723.4296426592082.57035734135
33303598302515.3680527711082.63194722850
34286994289117.043103967-2123.04310396705
35276427275876.689234311550.310765689405
36266424266957.871465538-533.871465537757
37267153267245.610609244-92.6106092441344
38268381266607.8116368721773.18836312798
39262522262291.361349818230.638650182075
40255542254382.7677591991159.23224080057
41253158251248.3208042621909.67919573798
42243803243868.910526958-65.9105269580253
43250741249553.6753597451187.32464025467
44280445278438.9320504162006.06794958412
45285257283452.3686257741804.63137422563
46270976272294.716302407-1318.71630240657
47261076261106.006223003-30.0062230031652
48255603255574.32901199328.6709880066736
49260376259825.704611814550.295388185758
50263903263398.828985313504.171014687295
51264291263095.2028847731195.79711522745
52263276262997.921991193278.078008807477
53262572262027.343827562544.656172438131
54256167257397.110989619-1230.11098961896
55264221265995.406677370-1774.40667736958
56293860295253.749007427-1393.74900742674
57300713301632.256459956-919.256459955673
58287224290813.549648183-3589.54964818318

\begin{tabular}{lllllllll}
\hline
Multiple Linear Regression - Actuals, Interpolation, and Residuals \tabularnewline
Time or Index & Actuals & InterpolationForecast & ResidualsPrediction Error \tabularnewline
1 & 317539 & 317537.123592791 & 1.87640720927732 \tabularnewline
2 & 313737 & 317415.556800312 & -3678.55680031212 \tabularnewline
3 & 312276 & 313690.099721821 & -1414.09972182126 \tabularnewline
4 & 309391 & 310053.484712213 & -662.484712212509 \tabularnewline
5 & 302950 & 305421.459245973 & -2471.45924597340 \tabularnewline
6 & 300316 & 300162.253143796 & 153.746856203874 \tabularnewline
7 & 304035 & 307255.925002180 & -3220.92500217969 \tabularnewline
8 & 333476 & 335097.421296075 & -1621.42129607499 \tabularnewline
9 & 337698 & 341993.967749553 & -4295.96774955263 \tabularnewline
10 & 335932 & 331912.19808799 & 4019.8019120096 \tabularnewline
11 & 323931 & 323581.037193645 & 349.962806354765 \tabularnewline
12 & 313927 & 312946.401538996 & 980.598461004077 \tabularnewline
13 & 314485 & 312980.023667893 & 1504.97633210677 \tabularnewline
14 & 313218 & 311268.463495098 & 1949.53650490186 \tabularnewline
15 & 309664 & 307723.480259018 & 1940.51974098216 \tabularnewline
16 & 302963 & 302642.636114952 & 320.363885047909 \tabularnewline
17 & 298989 & 298558.040291475 & 430.959708525252 \tabularnewline
18 & 298423 & 295318.257915500 & 3104.74208450051 \tabularnewline
19 & 310631 & 302160.537206146 & 8470.4627938537 \tabularnewline
20 & 329765 & 330838.468003424 & -1073.46800342374 \tabularnewline
21 & 335083 & 332755.039111946 & 2327.96088805417 \tabularnewline
22 & 327616 & 324604.492857453 & 3011.50714254720 \tabularnewline
23 & 309119 & 309989.267349041 & -870.267349041006 \tabularnewline
24 & 295916 & 296391.397983473 & -475.397983472996 \tabularnewline
25 & 291413 & 293377.537518258 & -1964.53751825767 \tabularnewline
26 & 291542 & 292090.339082405 & -548.339082405024 \tabularnewline
27 & 284678 & 286630.855784570 & -1952.85578457043 \tabularnewline
28 & 276475 & 277570.189422443 & -1095.18942244345 \tabularnewline
29 & 272566 & 272979.835830728 & -413.835830727965 \tabularnewline
30 & 264981 & 266943.467424127 & -1962.46742412741 \tabularnewline
31 & 263290 & 267952.455754559 & -4662.45575455911 \tabularnewline
32 & 296806 & 294723.429642659 & 2082.57035734135 \tabularnewline
33 & 303598 & 302515.368052771 & 1082.63194722850 \tabularnewline
34 & 286994 & 289117.043103967 & -2123.04310396705 \tabularnewline
35 & 276427 & 275876.689234311 & 550.310765689405 \tabularnewline
36 & 266424 & 266957.871465538 & -533.871465537757 \tabularnewline
37 & 267153 & 267245.610609244 & -92.6106092441344 \tabularnewline
38 & 268381 & 266607.811636872 & 1773.18836312798 \tabularnewline
39 & 262522 & 262291.361349818 & 230.638650182075 \tabularnewline
40 & 255542 & 254382.767759199 & 1159.23224080057 \tabularnewline
41 & 253158 & 251248.320804262 & 1909.67919573798 \tabularnewline
42 & 243803 & 243868.910526958 & -65.9105269580253 \tabularnewline
43 & 250741 & 249553.675359745 & 1187.32464025467 \tabularnewline
44 & 280445 & 278438.932050416 & 2006.06794958412 \tabularnewline
45 & 285257 & 283452.368625774 & 1804.63137422563 \tabularnewline
46 & 270976 & 272294.716302407 & -1318.71630240657 \tabularnewline
47 & 261076 & 261106.006223003 & -30.0062230031652 \tabularnewline
48 & 255603 & 255574.329011993 & 28.6709880066736 \tabularnewline
49 & 260376 & 259825.704611814 & 550.295388185758 \tabularnewline
50 & 263903 & 263398.828985313 & 504.171014687295 \tabularnewline
51 & 264291 & 263095.202884773 & 1195.79711522745 \tabularnewline
52 & 263276 & 262997.921991193 & 278.078008807477 \tabularnewline
53 & 262572 & 262027.343827562 & 544.656172438131 \tabularnewline
54 & 256167 & 257397.110989619 & -1230.11098961896 \tabularnewline
55 & 264221 & 265995.406677370 & -1774.40667736958 \tabularnewline
56 & 293860 & 295253.749007427 & -1393.74900742674 \tabularnewline
57 & 300713 & 301632.256459956 & -919.256459955673 \tabularnewline
58 & 287224 & 290813.549648183 & -3589.54964818318 \tabularnewline
\hline
\end{tabular}
%Source: https://freestatistics.org/blog/index.php?pk=57400&T=4

[TABLE]
[ROW][C]Multiple Linear Regression - Actuals, Interpolation, and Residuals[/C][/ROW]
[ROW][C]Time or Index[/C][C]Actuals[/C][C]InterpolationForecast[/C][C]ResidualsPrediction Error[/C][/ROW]
[ROW][C]1[/C][C]317539[/C][C]317537.123592791[/C][C]1.87640720927732[/C][/ROW]
[ROW][C]2[/C][C]313737[/C][C]317415.556800312[/C][C]-3678.55680031212[/C][/ROW]
[ROW][C]3[/C][C]312276[/C][C]313690.099721821[/C][C]-1414.09972182126[/C][/ROW]
[ROW][C]4[/C][C]309391[/C][C]310053.484712213[/C][C]-662.484712212509[/C][/ROW]
[ROW][C]5[/C][C]302950[/C][C]305421.459245973[/C][C]-2471.45924597340[/C][/ROW]
[ROW][C]6[/C][C]300316[/C][C]300162.253143796[/C][C]153.746856203874[/C][/ROW]
[ROW][C]7[/C][C]304035[/C][C]307255.925002180[/C][C]-3220.92500217969[/C][/ROW]
[ROW][C]8[/C][C]333476[/C][C]335097.421296075[/C][C]-1621.42129607499[/C][/ROW]
[ROW][C]9[/C][C]337698[/C][C]341993.967749553[/C][C]-4295.96774955263[/C][/ROW]
[ROW][C]10[/C][C]335932[/C][C]331912.19808799[/C][C]4019.8019120096[/C][/ROW]
[ROW][C]11[/C][C]323931[/C][C]323581.037193645[/C][C]349.962806354765[/C][/ROW]
[ROW][C]12[/C][C]313927[/C][C]312946.401538996[/C][C]980.598461004077[/C][/ROW]
[ROW][C]13[/C][C]314485[/C][C]312980.023667893[/C][C]1504.97633210677[/C][/ROW]
[ROW][C]14[/C][C]313218[/C][C]311268.463495098[/C][C]1949.53650490186[/C][/ROW]
[ROW][C]15[/C][C]309664[/C][C]307723.480259018[/C][C]1940.51974098216[/C][/ROW]
[ROW][C]16[/C][C]302963[/C][C]302642.636114952[/C][C]320.363885047909[/C][/ROW]
[ROW][C]17[/C][C]298989[/C][C]298558.040291475[/C][C]430.959708525252[/C][/ROW]
[ROW][C]18[/C][C]298423[/C][C]295318.257915500[/C][C]3104.74208450051[/C][/ROW]
[ROW][C]19[/C][C]310631[/C][C]302160.537206146[/C][C]8470.4627938537[/C][/ROW]
[ROW][C]20[/C][C]329765[/C][C]330838.468003424[/C][C]-1073.46800342374[/C][/ROW]
[ROW][C]21[/C][C]335083[/C][C]332755.039111946[/C][C]2327.96088805417[/C][/ROW]
[ROW][C]22[/C][C]327616[/C][C]324604.492857453[/C][C]3011.50714254720[/C][/ROW]
[ROW][C]23[/C][C]309119[/C][C]309989.267349041[/C][C]-870.267349041006[/C][/ROW]
[ROW][C]24[/C][C]295916[/C][C]296391.397983473[/C][C]-475.397983472996[/C][/ROW]
[ROW][C]25[/C][C]291413[/C][C]293377.537518258[/C][C]-1964.53751825767[/C][/ROW]
[ROW][C]26[/C][C]291542[/C][C]292090.339082405[/C][C]-548.339082405024[/C][/ROW]
[ROW][C]27[/C][C]284678[/C][C]286630.855784570[/C][C]-1952.85578457043[/C][/ROW]
[ROW][C]28[/C][C]276475[/C][C]277570.189422443[/C][C]-1095.18942244345[/C][/ROW]
[ROW][C]29[/C][C]272566[/C][C]272979.835830728[/C][C]-413.835830727965[/C][/ROW]
[ROW][C]30[/C][C]264981[/C][C]266943.467424127[/C][C]-1962.46742412741[/C][/ROW]
[ROW][C]31[/C][C]263290[/C][C]267952.455754559[/C][C]-4662.45575455911[/C][/ROW]
[ROW][C]32[/C][C]296806[/C][C]294723.429642659[/C][C]2082.57035734135[/C][/ROW]
[ROW][C]33[/C][C]303598[/C][C]302515.368052771[/C][C]1082.63194722850[/C][/ROW]
[ROW][C]34[/C][C]286994[/C][C]289117.043103967[/C][C]-2123.04310396705[/C][/ROW]
[ROW][C]35[/C][C]276427[/C][C]275876.689234311[/C][C]550.310765689405[/C][/ROW]
[ROW][C]36[/C][C]266424[/C][C]266957.871465538[/C][C]-533.871465537757[/C][/ROW]
[ROW][C]37[/C][C]267153[/C][C]267245.610609244[/C][C]-92.6106092441344[/C][/ROW]
[ROW][C]38[/C][C]268381[/C][C]266607.811636872[/C][C]1773.18836312798[/C][/ROW]
[ROW][C]39[/C][C]262522[/C][C]262291.361349818[/C][C]230.638650182075[/C][/ROW]
[ROW][C]40[/C][C]255542[/C][C]254382.767759199[/C][C]1159.23224080057[/C][/ROW]
[ROW][C]41[/C][C]253158[/C][C]251248.320804262[/C][C]1909.67919573798[/C][/ROW]
[ROW][C]42[/C][C]243803[/C][C]243868.910526958[/C][C]-65.9105269580253[/C][/ROW]
[ROW][C]43[/C][C]250741[/C][C]249553.675359745[/C][C]1187.32464025467[/C][/ROW]
[ROW][C]44[/C][C]280445[/C][C]278438.932050416[/C][C]2006.06794958412[/C][/ROW]
[ROW][C]45[/C][C]285257[/C][C]283452.368625774[/C][C]1804.63137422563[/C][/ROW]
[ROW][C]46[/C][C]270976[/C][C]272294.716302407[/C][C]-1318.71630240657[/C][/ROW]
[ROW][C]47[/C][C]261076[/C][C]261106.006223003[/C][C]-30.0062230031652[/C][/ROW]
[ROW][C]48[/C][C]255603[/C][C]255574.329011993[/C][C]28.6709880066736[/C][/ROW]
[ROW][C]49[/C][C]260376[/C][C]259825.704611814[/C][C]550.295388185758[/C][/ROW]
[ROW][C]50[/C][C]263903[/C][C]263398.828985313[/C][C]504.171014687295[/C][/ROW]
[ROW][C]51[/C][C]264291[/C][C]263095.202884773[/C][C]1195.79711522745[/C][/ROW]
[ROW][C]52[/C][C]263276[/C][C]262997.921991193[/C][C]278.078008807477[/C][/ROW]
[ROW][C]53[/C][C]262572[/C][C]262027.343827562[/C][C]544.656172438131[/C][/ROW]
[ROW][C]54[/C][C]256167[/C][C]257397.110989619[/C][C]-1230.11098961896[/C][/ROW]
[ROW][C]55[/C][C]264221[/C][C]265995.406677370[/C][C]-1774.40667736958[/C][/ROW]
[ROW][C]56[/C][C]293860[/C][C]295253.749007427[/C][C]-1393.74900742674[/C][/ROW]
[ROW][C]57[/C][C]300713[/C][C]301632.256459956[/C][C]-919.256459955673[/C][/ROW]
[ROW][C]58[/C][C]287224[/C][C]290813.549648183[/C][C]-3589.54964818318[/C][/ROW]
[/TABLE]
Source: https://freestatistics.org/blog/index.php?pk=57400&T=4

Globally Unique Identifier (entire table): ba.freestatistics.org/blog/index.php?pk=57400&T=4

As an alternative you can also use a QR Code:  

The GUIDs for individual cells are displayed in the table below:

Multiple Linear Regression - Actuals, Interpolation, and Residuals
Time or IndexActualsInterpolationForecastResidualsPrediction Error
1317539317537.1235927911.87640720927732
2313737317415.556800312-3678.55680031212
3312276313690.099721821-1414.09972182126
4309391310053.484712213-662.484712212509
5302950305421.459245973-2471.45924597340
6300316300162.253143796153.746856203874
7304035307255.925002180-3220.92500217969
8333476335097.421296075-1621.42129607499
9337698341993.967749553-4295.96774955263
10335932331912.198087994019.8019120096
11323931323581.037193645349.962806354765
12313927312946.401538996980.598461004077
13314485312980.0236678931504.97633210677
14313218311268.4634950981949.53650490186
15309664307723.4802590181940.51974098216
16302963302642.636114952320.363885047909
17298989298558.040291475430.959708525252
18298423295318.2579155003104.74208450051
19310631302160.5372061468470.4627938537
20329765330838.468003424-1073.46800342374
21335083332755.0391119462327.96088805417
22327616324604.4928574533011.50714254720
23309119309989.267349041-870.267349041006
24295916296391.397983473-475.397983472996
25291413293377.537518258-1964.53751825767
26291542292090.339082405-548.339082405024
27284678286630.855784570-1952.85578457043
28276475277570.189422443-1095.18942244345
29272566272979.835830728-413.835830727965
30264981266943.467424127-1962.46742412741
31263290267952.455754559-4662.45575455911
32296806294723.4296426592082.57035734135
33303598302515.3680527711082.63194722850
34286994289117.043103967-2123.04310396705
35276427275876.689234311550.310765689405
36266424266957.871465538-533.871465537757
37267153267245.610609244-92.6106092441344
38268381266607.8116368721773.18836312798
39262522262291.361349818230.638650182075
40255542254382.7677591991159.23224080057
41253158251248.3208042621909.67919573798
42243803243868.910526958-65.9105269580253
43250741249553.6753597451187.32464025467
44280445278438.9320504162006.06794958412
45285257283452.3686257741804.63137422563
46270976272294.716302407-1318.71630240657
47261076261106.006223003-30.0062230031652
48255603255574.32901199328.6709880066736
49260376259825.704611814550.295388185758
50263903263398.828985313504.171014687295
51264291263095.2028847731195.79711522745
52263276262997.921991193278.078008807477
53262572262027.343827562544.656172438131
54256167257397.110989619-1230.11098961896
55264221265995.406677370-1774.40667736958
56293860295253.749007427-1393.74900742674
57300713301632.256459956-919.256459955673
58287224290813.549648183-3589.54964818318


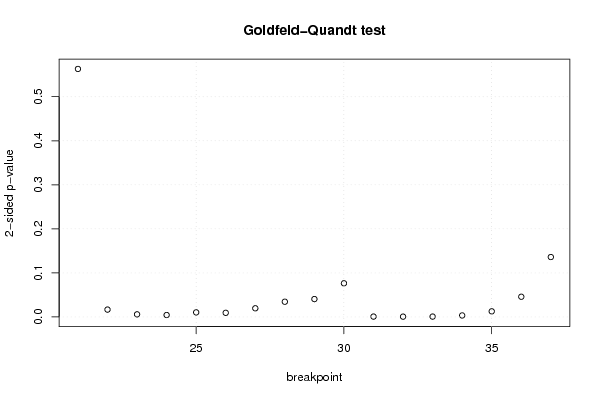
Goldfeld-Quandt test for Heteroskedasticity
p-valuesAlternative Hypothesis
breakpoint indexgreater2-sidedless
210.7184567419679830.5630865160640330.281543258032017
220.9916610524239160.01667789515216850.00833894757608427
230.997041471670130.005917056659740060.00295852832987003
240.9978535945226930.004292810954613760.00214640547730688
250.9948282143215360.01034357135692710.00517178567846356
260.9953362070173450.00932758596531010.00466379298265505
270.9901827941374930.01963441172501460.00981720586250732
280.9827362247332660.03452755053346850.0172637752667343
290.9797220696348080.04055586073038320.0202779303651916
300.9618149199714060.07637016005718840.0381850800285942
310.9996108737943210.0007782524113583160.000389126205679158
320.9996801802170150.0006396395659689970.000319819782984499
330.9996098004115430.0007803991769142780.000390199588457139
340.9983105500538540.003378899892291850.00168944994614592
350.9936550781141390.01268984377172210.00634492188586105
360.977077769961150.04584446007770150.0229222300388507
370.931991978194820.1360160436103590.0680080218051796

\begin{tabular}{lllllllll}
\hline
Goldfeld-Quandt test for Heteroskedasticity \tabularnewline
p-values & Alternative Hypothesis \tabularnewline
breakpoint index & greater & 2-sided & less \tabularnewline
21 & 0.718456741967983 & 0.563086516064033 & 0.281543258032017 \tabularnewline
22 & 0.991661052423916 & 0.0166778951521685 & 0.00833894757608427 \tabularnewline
23 & 0.99704147167013 & 0.00591705665974006 & 0.00295852832987003 \tabularnewline
24 & 0.997853594522693 & 0.00429281095461376 & 0.00214640547730688 \tabularnewline
25 & 0.994828214321536 & 0.0103435713569271 & 0.00517178567846356 \tabularnewline
26 & 0.995336207017345 & 0.0093275859653101 & 0.00466379298265505 \tabularnewline
27 & 0.990182794137493 & 0.0196344117250146 & 0.00981720586250732 \tabularnewline
28 & 0.982736224733266 & 0.0345275505334685 & 0.0172637752667343 \tabularnewline
29 & 0.979722069634808 & 0.0405558607303832 & 0.0202779303651916 \tabularnewline
30 & 0.961814919971406 & 0.0763701600571884 & 0.0381850800285942 \tabularnewline
31 & 0.999610873794321 & 0.000778252411358316 & 0.000389126205679158 \tabularnewline
32 & 0.999680180217015 & 0.000639639565968997 & 0.000319819782984499 \tabularnewline
33 & 0.999609800411543 & 0.000780399176914278 & 0.000390199588457139 \tabularnewline
34 & 0.998310550053854 & 0.00337889989229185 & 0.00168944994614592 \tabularnewline
35 & 0.993655078114139 & 0.0126898437717221 & 0.00634492188586105 \tabularnewline
36 & 0.97707776996115 & 0.0458444600777015 & 0.0229222300388507 \tabularnewline
37 & 0.93199197819482 & 0.136016043610359 & 0.0680080218051796 \tabularnewline
\hline
\end{tabular}
%Source: https://freestatistics.org/blog/index.php?pk=57400&T=5

[TABLE]
[ROW][C]Goldfeld-Quandt test for Heteroskedasticity[/C][/ROW]
[ROW][C]p-values[/C][C]Alternative Hypothesis[/C][/ROW]
[ROW][C]breakpoint index[/C][C]greater[/C][C]2-sided[/C][C]less[/C][/ROW]
[ROW][C]21[/C][C]0.718456741967983[/C][C]0.563086516064033[/C][C]0.281543258032017[/C][/ROW]
[ROW][C]22[/C][C]0.991661052423916[/C][C]0.0166778951521685[/C][C]0.00833894757608427[/C][/ROW]
[ROW][C]23[/C][C]0.99704147167013[/C][C]0.00591705665974006[/C][C]0.00295852832987003[/C][/ROW]
[ROW][C]24[/C][C]0.997853594522693[/C][C]0.00429281095461376[/C][C]0.00214640547730688[/C][/ROW]
[ROW][C]25[/C][C]0.994828214321536[/C][C]0.0103435713569271[/C][C]0.00517178567846356[/C][/ROW]
[ROW][C]26[/C][C]0.995336207017345[/C][C]0.0093275859653101[/C][C]0.00466379298265505[/C][/ROW]
[ROW][C]27[/C][C]0.990182794137493[/C][C]0.0196344117250146[/C][C]0.00981720586250732[/C][/ROW]
[ROW][C]28[/C][C]0.982736224733266[/C][C]0.0345275505334685[/C][C]0.0172637752667343[/C][/ROW]
[ROW][C]29[/C][C]0.979722069634808[/C][C]0.0405558607303832[/C][C]0.0202779303651916[/C][/ROW]
[ROW][C]30[/C][C]0.961814919971406[/C][C]0.0763701600571884[/C][C]0.0381850800285942[/C][/ROW]
[ROW][C]31[/C][C]0.999610873794321[/C][C]0.000778252411358316[/C][C]0.000389126205679158[/C][/ROW]
[ROW][C]32[/C][C]0.999680180217015[/C][C]0.000639639565968997[/C][C]0.000319819782984499[/C][/ROW]
[ROW][C]33[/C][C]0.999609800411543[/C][C]0.000780399176914278[/C][C]0.000390199588457139[/C][/ROW]
[ROW][C]34[/C][C]0.998310550053854[/C][C]0.00337889989229185[/C][C]0.00168944994614592[/C][/ROW]
[ROW][C]35[/C][C]0.993655078114139[/C][C]0.0126898437717221[/C][C]0.00634492188586105[/C][/ROW]
[ROW][C]36[/C][C]0.97707776996115[/C][C]0.0458444600777015[/C][C]0.0229222300388507[/C][/ROW]
[ROW][C]37[/C][C]0.93199197819482[/C][C]0.136016043610359[/C][C]0.0680080218051796[/C][/ROW]
[/TABLE]
Source: https://freestatistics.org/blog/index.php?pk=57400&T=5

Globally Unique Identifier (entire table): ba.freestatistics.org/blog/index.php?pk=57400&T=5

As an alternative you can also use a QR Code:  

The GUIDs for individual cells are displayed in the table below:

Goldfeld-Quandt test for Heteroskedasticity
p-valuesAlternative Hypothesis
breakpoint indexgreater2-sidedless
210.7184567419679830.5630865160640330.281543258032017
220.9916610524239160.01667789515216850.00833894757608427
230.997041471670130.005917056659740060.00295852832987003
240.9978535945226930.004292810954613760.00214640547730688
250.9948282143215360.01034357135692710.00517178567846356
260.9953362070173450.00932758596531010.00466379298265505
270.9901827941374930.01963441172501460.00981720586250732
280.9827362247332660.03452755053346850.0172637752667343
290.9797220696348080.04055586073038320.0202779303651916
300.9618149199714060.07637016005718840.0381850800285942
310.9996108737943210.0007782524113583160.000389126205679158
320.9996801802170150.0006396395659689970.000319819782984499
330.9996098004115430.0007803991769142780.000390199588457139
340.9983105500538540.003378899892291850.00168944994614592
350.9936550781141390.01268984377172210.00634492188586105
360.977077769961150.04584446007770150.0229222300388507
370.931991978194820.1360160436103590.0680080218051796


Meta Analysis of Goldfeld-Quandt test for Heteroskedasticity
Description# significant tests% significant testsOK/NOK
1% type I error level70.411764705882353NOK
5% type I error level140.823529411764706NOK
10% type I error level150.88235294117647NOK

\begin{tabular}{lllllllll}
\hline
Meta Analysis of Goldfeld-Quandt test for Heteroskedasticity \tabularnewline
Description & # significant tests & % significant tests & OK/NOK \tabularnewline
1% type I error level & 7 & 0.411764705882353 & NOK \tabularnewline
5% type I error level & 14 & 0.823529411764706 & NOK \tabularnewline
10% type I error level & 15 & 0.88235294117647 & NOK \tabularnewline
\hline
\end{tabular}
%Source: https://freestatistics.org/blog/index.php?pk=57400&T=6

[TABLE]
[ROW][C]Meta Analysis of Goldfeld-Quandt test for Heteroskedasticity[/C][/ROW]
[ROW][C]Description[/C][C]# significant tests[/C][C]% significant tests[/C][C]OK/NOK[/C][/ROW]
[ROW][C]1% type I error level[/C][C]7[/C][C]0.411764705882353[/C][C]NOK[/C][/ROW]
[ROW][C]5% type I error level[/C][C]14[/C][C]0.823529411764706[/C][C]NOK[/C][/ROW]
[ROW][C]10% type I error level[/C][C]15[/C][C]0.88235294117647[/C][C]NOK[/C][/ROW]
[/TABLE]
Source: https://freestatistics.org/blog/index.php?pk=57400&T=6

Globally Unique Identifier (entire table): ba.freestatistics.org/blog/index.php?pk=57400&T=6

As an alternative you can also use a QR Code:  

The GUIDs for individual cells are displayed in the table below:

Meta Analysis of Goldfeld-Quandt test for Heteroskedasticity
Description# significant tests% significant testsOK/NOK
1% type I error level70.411764705882353NOK
5% type I error level140.823529411764706NOK
10% type I error level150.88235294117647NOK


Parameters (Session):
par1 = 1 ; par2 = Include Monthly Dummies ; par3 = Linear Trend ;
Parameters (R input):
par1 = 1 ; par2 = Include Monthly Dummies ; par3 = Linear Trend ;
R code (references can be found in the software module):
library(lattice)
library(lmtest)
n25 <- 25 #minimum number of obs. for Goldfeld-Quandt test
par1 <- as.numeric(par1)
x <- t(y)
k <- length(x[1,])
n <- length(x[,1])
x1 <- cbind(x[,par1], x[,1:k!=par1])
mycolnames <- c(colnames(x)[par1], colnames(x)[1:k!=par1])
colnames(x1) <- mycolnames #colnames(x)[par1]
x <- x1
if (par3 == 'First Differences'){
x2 <- array(0, dim=c(n-1,k), dimnames=list(1:(n-1), paste('(1-B)',colnames(x),sep='')))
for (i in 1:n-1) {
for (j in 1:k) {
x2[i,j] <- x[i+1,j] - x[i,j]
}
}
x <- x2
}
if (par2 == 'Include Monthly Dummies'){
x2 <- array(0, dim=c(n,11), dimnames=list(1:n, paste('M', seq(1:11), sep ='')))
for (i in 1:11){
x2[seq(i,n,12),i] <- 1
}
x <- cbind(x, x2)
}
if (par2 == 'Include Quarterly Dummies'){
x2 <- array(0, dim=c(n,3), dimnames=list(1:n, paste('Q', seq(1:3), sep ='')))
for (i in 1:3){
x2[seq(i,n,4),i] <- 1
}
x <- cbind(x, x2)
}
k <- length(x[1,])
if (par3 == 'Linear Trend'){
x <- cbind(x, c(1:n))
colnames(x)[k+1] <- 't'
}
x
k <- length(x[1,])
df <- as.data.frame(x)
(mylm <- lm(df))
(mysum <- summary(mylm))
if (n > n25) {
kp3 <- k + 3
nmkm3 <- n - k - 3
gqarr <- array(NA, dim=c(nmkm3-kp3+1,3))
numgqtests <- 0
numsignificant1 <- 0
numsignificant5 <- 0
numsignificant10 <- 0
for (mypoint in kp3:nmkm3) {
j <- 0
numgqtests <- numgqtests + 1
for (myalt in c('greater', 'two.sided', 'less')) {
j <- j + 1
gqarr[mypoint-kp3+1,j] <- gqtest(mylm, point=mypoint, alternative=myalt)$p.value
}
if (gqarr[mypoint-kp3+1,2] < 0.01) numsignificant1 <- numsignificant1 + 1
if (gqarr[mypoint-kp3+1,2] < 0.05) numsignificant5 <- numsignificant5 + 1
if (gqarr[mypoint-kp3+1,2] < 0.10) numsignificant10 <- numsignificant10 + 1
}
gqarr
}
bitmap(file='test0.png')
plot(x[,1], type='l', main='Actuals and Interpolation', ylab='value of Actuals and Interpolation (dots)', xlab='time or index')
points(x[,1]-mysum$resid)
grid()
dev.off()
bitmap(file='test1.png')
plot(mysum$resid, type='b', pch=19, main='Residuals', ylab='value of Residuals', xlab='time or index')
grid()
dev.off()
bitmap(file='test2.png')
hist(mysum$resid, main='Residual Histogram', xlab='values of Residuals')
grid()
dev.off()
bitmap(file='test3.png')
densityplot(~mysum$resid,col='black',main='Residual Density Plot', xlab='values of Residuals')
dev.off()
bitmap(file='test4.png')
qqnorm(mysum$resid, main='Residual Normal Q-Q Plot')
qqline(mysum$resid)
grid()
dev.off()
(myerror <- as.ts(mysum$resid))
bitmap(file='test5.png')
dum <- cbind(lag(myerror,k=1),myerror)
dum
dum1 <- dum[2:length(myerror),]
dum1
z <- as.data.frame(dum1)
z
plot(z,main=paste('Residual Lag plot, lowess, and regression line'), ylab='values of Residuals', xlab='lagged values of Residuals')
lines(lowess(z))
abline(lm(z))
grid()
dev.off()
bitmap(file='test6.png')
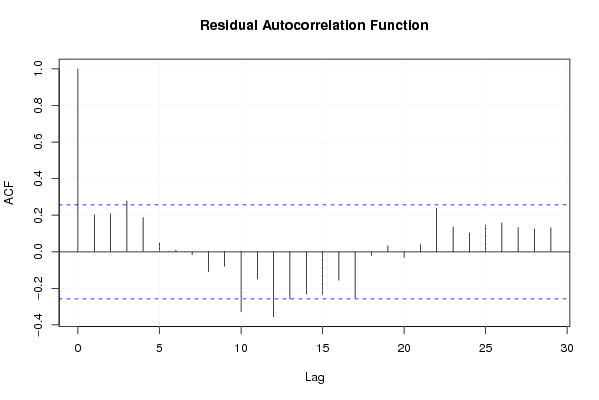
acf(mysum$resid, lag.max=length(mysum$resid)/2, main='Residual Autocorrelation Function')
grid()
dev.off()
bitmap(file='test7.png')
pacf(mysum$resid, lag.max=length(mysum$resid)/2, main='Residual Partial Autocorrelation Function')
grid()
dev.off()
bitmap(file='test8.png')
opar <- par(mfrow = c(2,2), oma = c(0, 0, 1.1, 0))
plot(mylm, las = 1, sub='Residual Diagnostics')
par(opar)
dev.off()
if (n > n25) {
bitmap(file='test9.png')
plot(kp3:nmkm3,gqarr[,2], main='Goldfeld-Quandt test',ylab='2-sided p-value',xlab='breakpoint')
grid()
dev.off()
}
load(file='createtable')
a<-table.start()
a<-table.row.start(a)
a<-table.element(a, 'Multiple Linear Regression - Estimated Regression Equation', 1, TRUE)
a<-table.row.end(a)
myeq <- colnames(x)[1]
myeq <- paste(myeq, '[t] = ', sep='')
for (i in 1:k){
if (mysum$coefficients[i,1] > 0) myeq <- paste(myeq, '+', '')
myeq <- paste(myeq, mysum$coefficients[i,1], sep=' ')
if (rownames(mysum$coefficients)[i] != '(Intercept)') {
myeq <- paste(myeq, rownames(mysum$coefficients)[i], sep='')
if (rownames(mysum$coefficients)[i] != 't') myeq <- paste(myeq, '[t]', sep='')
}
}
myeq <- paste(myeq, ' + e[t]')
a<-table.row.start(a)
a<-table.element(a, myeq)
a<-table.row.end(a)
a<-table.end(a)
table.save(a,file='mytable1.tab')
a<-table.start()
a<-table.row.start(a)
a<-table.element(a,hyperlink('ols1.htm','Multiple Linear Regression - Ordinary Least Squares',''), 6, TRUE)
a<-table.row.end(a)
a<-table.row.start(a)
a<-table.element(a,'Variable',header=TRUE)
a<-table.element(a,'Parameter',header=TRUE)
a<-table.element(a,'S.D.',header=TRUE)
a<-table.element(a,'T-STAT
H0: parameter = 0',header=TRUE)
a<-table.element(a,'2-tail p-value',header=TRUE)
a<-table.element(a,'1-tail p-value',header=TRUE)
a<-table.row.end(a)
for (i in 1:k){
a<-table.row.start(a)
a<-table.element(a,rownames(mysum$coefficients)[i],header=TRUE)
a<-table.element(a,mysum$coefficients[i,1])
a<-table.element(a, round(mysum$coefficients[i,2],6))
a<-table.element(a, round(mysum$coefficients[i,3],4))
a<-table.element(a, round(mysum$coefficients[i,4],6))
a<-table.element(a, round(mysum$coefficients[i,4]/2,6))
a<-table.row.end(a)
}
a<-table.end(a)
table.save(a,file='mytable2.tab')
a<-table.start()
a<-table.row.start(a)
a<-table.element(a, 'Multiple Linear Regression - Regression Statistics', 2, TRUE)
a<-table.row.end(a)
a<-table.row.start(a)
a<-table.element(a, 'Multiple R',1,TRUE)
a<-table.element(a, sqrt(mysum$r.squared))
a<-table.row.end(a)
a<-table.row.start(a)
a<-table.element(a, 'R-squared',1,TRUE)
a<-table.element(a, mysum$r.squared)
a<-table.row.end(a)
a<-table.row.start(a)
a<-table.element(a, 'Adjusted R-squared',1,TRUE)
a<-table.element(a, mysum$adj.r.squared)
a<-table.row.end(a)
a<-table.row.start(a)
a<-table.element(a, 'F-TEST (value)',1,TRUE)
a<-table.element(a, mysum$fstatistic[1])
a<-table.row.end(a)
a<-table.row.start(a)
a<-table.element(a, 'F-TEST (DF numerator)',1,TRUE)
a<-table.element(a, mysum$fstatistic[2])
a<-table.row.end(a)
a<-table.row.start(a)
a<-table.element(a, 'F-TEST (DF denominator)',1,TRUE)
a<-table.element(a, mysum$fstatistic[3])
a<-table.row.end(a)
a<-table.row.start(a)
a<-table.element(a, 'p-value',1,TRUE)
a<-table.element(a, 1-pf(mysum$fstatistic[1],mysum$fstatistic[2],mysum$fstatistic[3]))
a<-table.row.end(a)
a<-table.row.start(a)
a<-table.element(a, 'Multiple Linear Regression - Residual Statistics', 2, TRUE)
a<-table.row.end(a)
a<-table.row.start(a)
a<-table.element(a, 'Residual Standard Deviation',1,TRUE)
a<-table.element(a, mysum$sigma)
a<-table.row.end(a)
a<-table.row.start(a)
a<-table.element(a, 'Sum Squared Residuals',1,TRUE)
a<-table.element(a, sum(myerror*myerror))
a<-table.row.end(a)
a<-table.end(a)
table.save(a,file='mytable3.tab')
a<-table.start()
a<-table.row.start(a)
a<-table.element(a, 'Multiple Linear Regression - Actuals, Interpolation, and Residuals', 4, TRUE)
a<-table.row.end(a)
a<-table.row.start(a)
a<-table.element(a, 'Time or Index', 1, TRUE)
a<-table.element(a, 'Actuals', 1, TRUE)
a<-table.element(a, 'Interpolation
Forecast', 1, TRUE)
a<-table.element(a, 'Residuals
Prediction Error', 1, TRUE)
a<-table.row.end(a)
for (i in 1:n) {
a<-table.row.start(a)
a<-table.element(a,i, 1, TRUE)
a<-table.element(a,x[i])
a<-table.element(a,x[i]-mysum$resid[i])
a<-table.element(a,mysum$resid[i])
a<-table.row.end(a)
}
a<-table.end(a)
table.save(a,file='mytable4.tab')
if (n > n25) {
a<-table.start()
a<-table.row.start(a)
a<-table.element(a,'Goldfeld-Quandt test for Heteroskedasticity',4,TRUE)
a<-table.row.end(a)
a<-table.row.start(a)
a<-table.element(a,'p-values',header=TRUE)
a<-table.element(a,'Alternative Hypothesis',3,header=TRUE)
a<-table.row.end(a)
a<-table.row.start(a)
a<-table.element(a,'breakpoint index',header=TRUE)
a<-table.element(a,'greater',header=TRUE)
a<-table.element(a,'2-sided',header=TRUE)
a<-table.element(a,'less',header=TRUE)
a<-table.row.end(a)
for (mypoint in kp3:nmkm3) {
a<-table.row.start(a)
a<-table.element(a,mypoint,header=TRUE)
a<-table.element(a,gqarr[mypoint-kp3+1,1])
a<-table.element(a,gqarr[mypoint-kp3+1,2])
a<-table.element(a,gqarr[mypoint-kp3+1,3])
a<-table.row.end(a)
}
a<-table.end(a)
table.save(a,file='mytable5.tab')
a<-table.start()
a<-table.row.start(a)
a<-table.element(a,'Meta Analysis of Goldfeld-Quandt test for Heteroskedasticity',4,TRUE)
a<-table.row.end(a)
a<-table.row.start(a)
a<-table.element(a,'Description',header=TRUE)
a<-table.element(a,'# significant tests',header=TRUE)
a<-table.element(a,'% significant tests',header=TRUE)
a<-table.element(a,'OK/NOK',header=TRUE)
a<-table.row.end(a)
a<-table.row.start(a)
a<-table.element(a,'1% type I error level',header=TRUE)
a<-table.element(a,numsignificant1)
a<-table.element(a,numsignificant1/numgqtests)
if (numsignificant1/numgqtests < 0.01) dum <- 'OK' else dum <- 'NOK'
a<-table.element(a,dum)
a<-table.row.end(a)
a<-table.row.start(a)
a<-table.element(a,'5% type I error level',header=TRUE)
a<-table.element(a,numsignificant5)
a<-table.element(a,numsignificant5/numgqtests)
if (numsignificant5/numgqtests < 0.05) dum <- 'OK' else dum <- 'NOK'
a<-table.element(a,dum)
a<-table.row.end(a)
a<-table.row.start(a)
a<-table.element(a,'10% type I error level',header=TRUE)
a<-table.element(a,numsignificant10)
a<-table.element(a,numsignificant10/numgqtests)
if (numsignificant10/numgqtests < 0.1) dum <- 'OK' else dum <- 'NOK'
a<-table.element(a,dum)
a<-table.row.end(a)
a<-table.end(a)
table.save(a,file='mytable6.tab')
}