Free Statistics

of Irreproducible Research!

Author's title

Author*The author of this computation has been verified*
R Software Modulerwasp_multipleregression.wasp
Title produced by softwareMultiple Regression
Date of computationTue, 17 Nov 2009 14:51:39 -0700
Cite this page as followsStatistical Computations at FreeStatistics.org, Office for Research Development and Education, URL https://freestatistics.org/blog/index.php?v=date/2009/Nov/17/t1258494807w4idznri8vo19ob.htm/, Retrieved Thu, 02 May 2024 00:40:25 +0000
Statistical Computations at FreeStatistics.org, Office for Research Development and Education, URL https://freestatistics.org/blog/index.php?pk=57429, Retrieved Thu, 02 May 2024 00:40:25 +0000
QR Codes:

Original text written by user:
IsPrivate?No (this computation is public)
User-defined keywords
Estimated Impact195
Family? (F = Feedback message, R = changed R code, M = changed R Module, P = changed Parameters, D = changed Data)
-     [Multiple Regression] [Q1 The Seatbeltlaw] [2007-11-14 19:27:43] [8cd6641b921d30ebe00b648d1481bba0]
- RM D  [Multiple Regression] [Seatbelt] [2009-11-12 14:14:11] [b98453cac15ba1066b407e146608df68]
-   PD      [Multiple Regression] [Model 4] [2009-11-17 21:51:39] [2622964eb3e61db9b0dfd11950e3a18c] [Current]
Feedback Forum

Post a new message
Dataseries X:
3759	36.71	3922	5560
4138	36.72	3759	3922
4634	36.73	4138	3759
3996	36.73	4634	4138
4308	36.87	3996	4634
4429	37.31	4308	3996
5219	37.39	4429	4308
4929	37.42	5219	4429
5755	37.51	4929	5219
5592	37.67	5755	4929
4163	37.67	5592	5755
4962	37.71	4163	5592
5208	37.78	4962	4163
4755	37.79	5208	4962
4491	37.84	4755	5208
5732	37.88	4491	4755
5731	38.34	5732	4491
5040	38.58	5731	5732
6102	38.72	5040	5731
4904	38.83	6102	5040
5369	38.9	4904	6102
5578	38.92	5369	4904
4619	38.94	5578	5369
4731	39.1	4619	5578
5011	39.14	4731	4619
5299	39.16	5011	4731
4146	39.32	5299	5011
4625	39.34	4146	5299
4736	39.44	4625	4146
4219	39.92	4736	4625
5116	40.19	4219	4736
4205	40.2	5116	4219
4121	40.27	4205	5116
5103	40.28	4121	4205
4300	40.3	5103	4121
4578	40.34	4300	5103
3809	40.4	4578	4300
5526	40.43	3809	4578
4247	40.48	5526	3809
3830	40.48	4247	5526
4394	40.63	3830	4247
4826	40.74	4394	3830
4409	40.77	4826	4394
4569	40.91	4409	4826
4106	40.92	4569	4409
4794	41.03	4106	4569
3914	41	4794	4106
3793	41.04	3914	4794
4405	41.33	3793	3914
4022	41.44	4405	3793
4100	41.46	4022	4405
4788	41.55	4100	4022
3163	41.55	4788	4100
3585	41.81	3163	4788
3903	41.78	3585	3163
4178	41.84	3903	3585
3863	41.84	4178	3903
4187	41.86	3863	4178


Summary of computational transaction
Raw Inputview raw input (R code)
Raw Outputview raw output of R engine
Computing time3 seconds
R Server'Gwilym Jenkins' @ 72.249.127.135

\begin{tabular}{lllllllll}
\hline
Summary of computational transaction \tabularnewline
Raw Input & view raw input (R code)  \tabularnewline
Raw Output & view raw output of R engine  \tabularnewline
Computing time & 3 seconds \tabularnewline
R Server & 'Gwilym Jenkins' @ 72.249.127.135 \tabularnewline
\hline
\end{tabular}
%Source: https://freestatistics.org/blog/index.php?pk=57429&T=0

[TABLE]
[ROW][C]Summary of computational transaction[/C][/ROW]
[ROW][C]Raw Input[/C][C]view raw input (R code) [/C][/ROW]
[ROW][C]Raw Output[/C][C]view raw output of R engine [/C][/ROW]
[ROW][C]Computing time[/C][C]3 seconds[/C][/ROW]
[ROW][C]R Server[/C][C]'Gwilym Jenkins' @ 72.249.127.135[/C][/ROW]
[/TABLE]
Source: https://freestatistics.org/blog/index.php?pk=57429&T=0

Globally Unique Identifier (entire table): ba.freestatistics.org/blog/index.php?pk=57429&T=0

As an alternative you can also use a QR Code:  

The GUIDs for individual cells are displayed in the table below:

Summary of computational transaction
Raw Inputview raw input (R code)
Raw Outputview raw output of R engine
Computing time3 seconds
R Server'Gwilym Jenkins' @ 72.249.127.135


Multiple Linear Regression - Estimated Regression Equation
Y1[t] = -14573.6863254658 + 0.286065503358865Y[t] + 459.077940222844X[t] + 0.172963208384406Y2[t] + 263.451877994075M1[t] + 270.461141609439M2[t] + 718.898880064055M3[t] + 200.951950880125M4[t] + 554.657601557322M5[t] + 304.09070366431M6[t] + 134.175190321277M7[t] + 803.65049328323M8[t] + 323.783975068084M9[t] + 382.612353324275M10[t] + 1149.28201806185M11[t] -51.1841435474764t + e[t]

\begin{tabular}{lllllllll}
\hline
Multiple Linear Regression - Estimated Regression Equation \tabularnewline
Y1[t] =  -14573.6863254658 +  0.286065503358865Y[t] +  459.077940222844X[t] +  0.172963208384406Y2[t] +  263.451877994075M1[t] +  270.461141609439M2[t] +  718.898880064055M3[t] +  200.951950880125M4[t] +  554.657601557322M5[t] +  304.09070366431M6[t] +  134.175190321277M7[t] +  803.65049328323M8[t] +  323.783975068084M9[t] +  382.612353324275M10[t] +  1149.28201806185M11[t] -51.1841435474764t  + e[t] \tabularnewline
\hline
\end{tabular}
%Source: https://freestatistics.org/blog/index.php?pk=57429&T=1

[TABLE]
[ROW][C]Multiple Linear Regression - Estimated Regression Equation[/C][/ROW]
[ROW][C]Y1[t] =  -14573.6863254658 +  0.286065503358865Y[t] +  459.077940222844X[t] +  0.172963208384406Y2[t] +  263.451877994075M1[t] +  270.461141609439M2[t] +  718.898880064055M3[t] +  200.951950880125M4[t] +  554.657601557322M5[t] +  304.09070366431M6[t] +  134.175190321277M7[t] +  803.65049328323M8[t] +  323.783975068084M9[t] +  382.612353324275M10[t] +  1149.28201806185M11[t] -51.1841435474764t  + e[t][/C][/ROW]
[/TABLE]
Source: https://freestatistics.org/blog/index.php?pk=57429&T=1

Globally Unique Identifier (entire table): ba.freestatistics.org/blog/index.php?pk=57429&T=1

As an alternative you can also use a QR Code:  

The GUIDs for individual cells are displayed in the table below:

Multiple Linear Regression - Estimated Regression Equation
Y1[t] = -14573.6863254658 + 0.286065503358865Y[t] + 459.077940222844X[t] + 0.172963208384406Y2[t] + 263.451877994075M1[t] + 270.461141609439M2[t] + 718.898880064055M3[t] + 200.951950880125M4[t] + 554.657601557322M5[t] + 304.09070366431M6[t] + 134.175190321277M7[t] + 803.65049328323M8[t] + 323.783975068084M9[t] + 382.612353324275M10[t] + 1149.28201806185M11[t] -51.1841435474764t + e[t]


Multiple Linear Regression - Ordinary Least Squares
VariableParameterS.D.T-STATH0: parameter = 02-tail p-value1-tail p-value
(Intercept)-14573.686325465814958.587512-0.97430.3355010.167751
Y0.2860655033588650.1481661.93070.0602880.030144
X459.077940222844416.9248031.10110.2771220.138561
Y20.1729632083844060.1446881.19540.2386290.119314
M1263.451877994075379.0922780.6950.4909110.245455
M2270.461141609439384.6629190.70310.4858650.242933
M3718.898880064055378.8153111.89780.0646160.032308
M4200.951950880125370.6521470.54220.5905750.295287
M5554.657601557322382.6176561.44960.1545860.077293
M6304.09070366431379.216960.80190.427130.213565
M7134.175190321277390.9023980.34320.7331270.366563
M8803.65049328323384.1869332.09180.0425390.02127
M9323.783975068084363.7246330.89020.3784350.189217
M10382.612353324275385.3606810.99290.326460.16323
M111149.28201806185386.0442472.97710.0048140.002407
t-51.184143547476441.091625-1.24560.2198120.109906

\begin{tabular}{lllllllll}
\hline
Multiple Linear Regression - Ordinary Least Squares \tabularnewline
Variable & Parameter & S.D. & T-STATH0: parameter = 0 & 2-tail p-value & 1-tail p-value \tabularnewline
(Intercept) & -14573.6863254658 & 14958.587512 & -0.9743 & 0.335501 & 0.167751 \tabularnewline
Y & 0.286065503358865 & 0.148166 & 1.9307 & 0.060288 & 0.030144 \tabularnewline
X & 459.077940222844 & 416.924803 & 1.1011 & 0.277122 & 0.138561 \tabularnewline
Y2 & 0.172963208384406 & 0.144688 & 1.1954 & 0.238629 & 0.119314 \tabularnewline
M1 & 263.451877994075 & 379.092278 & 0.695 & 0.490911 & 0.245455 \tabularnewline
M2 & 270.461141609439 & 384.662919 & 0.7031 & 0.485865 & 0.242933 \tabularnewline
M3 & 718.898880064055 & 378.815311 & 1.8978 & 0.064616 & 0.032308 \tabularnewline
M4 & 200.951950880125 & 370.652147 & 0.5422 & 0.590575 & 0.295287 \tabularnewline
M5 & 554.657601557322 & 382.617656 & 1.4496 & 0.154586 & 0.077293 \tabularnewline
M6 & 304.09070366431 & 379.21696 & 0.8019 & 0.42713 & 0.213565 \tabularnewline
M7 & 134.175190321277 & 390.902398 & 0.3432 & 0.733127 & 0.366563 \tabularnewline
M8 & 803.65049328323 & 384.186933 & 2.0918 & 0.042539 & 0.02127 \tabularnewline
M9 & 323.783975068084 & 363.724633 & 0.8902 & 0.378435 & 0.189217 \tabularnewline
M10 & 382.612353324275 & 385.360681 & 0.9929 & 0.32646 & 0.16323 \tabularnewline
M11 & 1149.28201806185 & 386.044247 & 2.9771 & 0.004814 & 0.002407 \tabularnewline
t & -51.1841435474764 & 41.091625 & -1.2456 & 0.219812 & 0.109906 \tabularnewline
\hline
\end{tabular}
%Source: https://freestatistics.org/blog/index.php?pk=57429&T=2

[TABLE]
[ROW][C]Multiple Linear Regression - Ordinary Least Squares[/C][/ROW]
[ROW][C]Variable[/C][C]Parameter[/C][C]S.D.[/C][C]T-STATH0: parameter = 0[/C][C]2-tail p-value[/C][C]1-tail p-value[/C][/ROW]
[ROW][C](Intercept)[/C][C]-14573.6863254658[/C][C]14958.587512[/C][C]-0.9743[/C][C]0.335501[/C][C]0.167751[/C][/ROW]
[ROW][C]Y[/C][C]0.286065503358865[/C][C]0.148166[/C][C]1.9307[/C][C]0.060288[/C][C]0.030144[/C][/ROW]
[ROW][C]X[/C][C]459.077940222844[/C][C]416.924803[/C][C]1.1011[/C][C]0.277122[/C][C]0.138561[/C][/ROW]
[ROW][C]Y2[/C][C]0.172963208384406[/C][C]0.144688[/C][C]1.1954[/C][C]0.238629[/C][C]0.119314[/C][/ROW]
[ROW][C]M1[/C][C]263.451877994075[/C][C]379.092278[/C][C]0.695[/C][C]0.490911[/C][C]0.245455[/C][/ROW]
[ROW][C]M2[/C][C]270.461141609439[/C][C]384.662919[/C][C]0.7031[/C][C]0.485865[/C][C]0.242933[/C][/ROW]
[ROW][C]M3[/C][C]718.898880064055[/C][C]378.815311[/C][C]1.8978[/C][C]0.064616[/C][C]0.032308[/C][/ROW]
[ROW][C]M4[/C][C]200.951950880125[/C][C]370.652147[/C][C]0.5422[/C][C]0.590575[/C][C]0.295287[/C][/ROW]
[ROW][C]M5[/C][C]554.657601557322[/C][C]382.617656[/C][C]1.4496[/C][C]0.154586[/C][C]0.077293[/C][/ROW]
[ROW][C]M6[/C][C]304.09070366431[/C][C]379.21696[/C][C]0.8019[/C][C]0.42713[/C][C]0.213565[/C][/ROW]
[ROW][C]M7[/C][C]134.175190321277[/C][C]390.902398[/C][C]0.3432[/C][C]0.733127[/C][C]0.366563[/C][/ROW]
[ROW][C]M8[/C][C]803.65049328323[/C][C]384.186933[/C][C]2.0918[/C][C]0.042539[/C][C]0.02127[/C][/ROW]
[ROW][C]M9[/C][C]323.783975068084[/C][C]363.724633[/C][C]0.8902[/C][C]0.378435[/C][C]0.189217[/C][/ROW]
[ROW][C]M10[/C][C]382.612353324275[/C][C]385.360681[/C][C]0.9929[/C][C]0.32646[/C][C]0.16323[/C][/ROW]
[ROW][C]M11[/C][C]1149.28201806185[/C][C]386.044247[/C][C]2.9771[/C][C]0.004814[/C][C]0.002407[/C][/ROW]
[ROW][C]t[/C][C]-51.1841435474764[/C][C]41.091625[/C][C]-1.2456[/C][C]0.219812[/C][C]0.109906[/C][/ROW]
[/TABLE]
Source: https://freestatistics.org/blog/index.php?pk=57429&T=2

Globally Unique Identifier (entire table): ba.freestatistics.org/blog/index.php?pk=57429&T=2

As an alternative you can also use a QR Code:  

The GUIDs for individual cells are displayed in the table below:

Multiple Linear Regression - Ordinary Least Squares
VariableParameterS.D.T-STATH0: parameter = 02-tail p-value1-tail p-value
(Intercept)-14573.686325465814958.587512-0.97430.3355010.167751
Y0.2860655033588650.1481661.93070.0602880.030144
X459.077940222844416.9248031.10110.2771220.138561
Y20.1729632083844060.1446881.19540.2386290.119314
M1263.451877994075379.0922780.6950.4909110.245455
M2270.461141609439384.6629190.70310.4858650.242933
M3718.898880064055378.8153111.89780.0646160.032308
M4200.951950880125370.6521470.54220.5905750.295287
M5554.657601557322382.6176561.44960.1545860.077293
M6304.09070366431379.216960.80190.427130.213565
M7134.175190321277390.9023980.34320.7331270.366563
M8803.65049328323384.1869332.09180.0425390.02127
M9323.783975068084363.7246330.89020.3784350.189217
M10382.612353324275385.3606810.99290.326460.16323
M111149.28201806185386.0442472.97710.0048140.002407
t-51.184143547476441.091625-1.24560.2198120.109906


Multiple Linear Regression - Regression Statistics
Multiple R0.686774285814741
R-squared0.471658919656347
Adjusted R-squared0.282965676676471
F-TEST (value)2.49960683386341
F-TEST (DF numerator)15
F-TEST (DF denominator)42
p-value0.00992526955596018
Multiple Linear Regression - Residual Statistics
Residual Standard Deviation535.137166105338
Sum Squared Residuals12027615.0349846

\begin{tabular}{lllllllll}
\hline
Multiple Linear Regression - Regression Statistics \tabularnewline
Multiple R & 0.686774285814741 \tabularnewline
R-squared & 0.471658919656347 \tabularnewline
Adjusted R-squared & 0.282965676676471 \tabularnewline
F-TEST (value) & 2.49960683386341 \tabularnewline
F-TEST (DF numerator) & 15 \tabularnewline
F-TEST (DF denominator) & 42 \tabularnewline
p-value & 0.00992526955596018 \tabularnewline
Multiple Linear Regression - Residual Statistics \tabularnewline
Residual Standard Deviation & 535.137166105338 \tabularnewline
Sum Squared Residuals & 12027615.0349846 \tabularnewline
\hline
\end{tabular}
%Source: https://freestatistics.org/blog/index.php?pk=57429&T=3

[TABLE]
[ROW][C]Multiple Linear Regression - Regression Statistics[/C][/ROW]
[ROW][C]Multiple R[/C][C]0.686774285814741[/C][/ROW]
[ROW][C]R-squared[/C][C]0.471658919656347[/C][/ROW]
[ROW][C]Adjusted R-squared[/C][C]0.282965676676471[/C][/ROW]
[ROW][C]F-TEST (value)[/C][C]2.49960683386341[/C][/ROW]
[ROW][C]F-TEST (DF numerator)[/C][C]15[/C][/ROW]
[ROW][C]F-TEST (DF denominator)[/C][C]42[/C][/ROW]
[ROW][C]p-value[/C][C]0.00992526955596018[/C][/ROW]
[ROW][C]Multiple Linear Regression - Residual Statistics[/C][/ROW]
[ROW][C]Residual Standard Deviation[/C][C]535.137166105338[/C][/ROW]
[ROW][C]Sum Squared Residuals[/C][C]12027615.0349846[/C][/ROW]
[/TABLE]
Source: https://freestatistics.org/blog/index.php?pk=57429&T=3

Globally Unique Identifier (entire table): ba.freestatistics.org/blog/index.php?pk=57429&T=3

As an alternative you can also use a QR Code:  

The GUIDs for individual cells are displayed in the table below:

Multiple Linear Regression - Regression Statistics
Multiple R0.686774285814741
R-squared0.471658919656347
Adjusted R-squared0.282965676676471
F-TEST (value)2.49960683386341
F-TEST (DF numerator)15
F-TEST (DF denominator)42
p-value0.00992526955596018
Multiple Linear Regression - Residual Statistics
Residual Standard Deviation535.137166105338
Sum Squared Residuals12027615.0349846


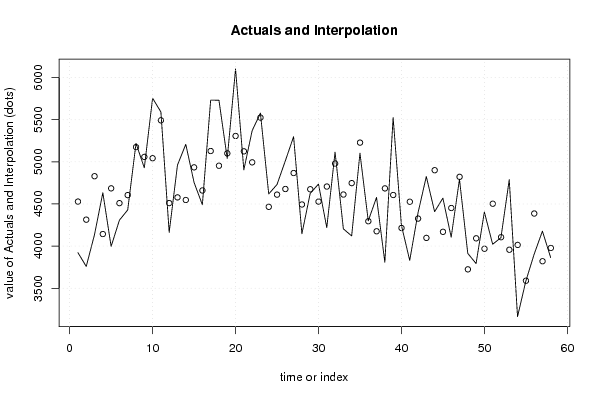
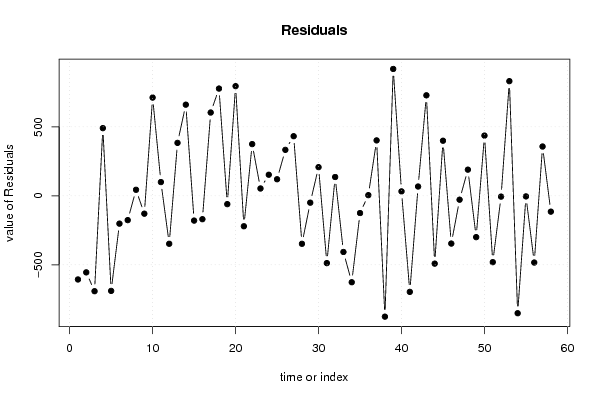
Multiple Linear Regression - Actuals, Interpolation, and Residuals
Time or IndexActualsInterpolationForecastResidualsPrediction Error
139224528.32826030459-606.328260304594
237594313.8492502141-554.849250214103
341384829.38911122281-691.389111222806
446344143.30130332614490.698696673864
539964685.13591049369-689.135910493687
643084509.64256170842-201.642561708424
744294605.22540870518-176.225408705179
852195175.2584585667843.7415414332157
949295058.45585182232-129.455851822320
1057555042.76454948772712.235450512281
1155925492.3300765035299.6699234964825
1241634510.60036672018-347.600366720179
1349624578.21124602734383.788753972658
1452084547.23707597503660.762924024967
1547554934.47222426914-179.47222426914
1644914660.35922541686-169.359225416862
1757325128.10823253225603.89176746775
1857314953.51197552931777.488024470685
1950405100.31183162873-60.311831628734
2061025306.87751445018795.122485549823
2149045124.66969486927-220.669694869266
2253694994.07325493992374.926745060076
2355785524.8314091120753.1685908879253
2446194466.00636486694152.993635133062
2547314610.86384102229120.136158977713
2650114677.62926420104333.370735798963
2752994866.9315025187432.068497481305
2841464493.82076871535-347.820768715352
2946254674.57676147297-49.5767614729691
3047364528.13664291905207.863357080955
3142194706.78770253227-487.787702532273
3251164979.64198905432136.358010945684
3342054611.84527874596-406.84527874596
3441214747.42713431711-626.427134317115
3551035227.85470561021-124.854705610210
3643004295.127742177054.87225782294966
3745784176.06632462137401.933675378628
3838094684.92202409398-875.922024093982
3955264606.24302996867919.756970031334
4042474214.8004711326432.1995288673625
4138304526.30466966653-696.304669666533
4243944326.5068412052967.4931587947101
4348264097.44145714962728.558542850376
4444094900.49411475478-491.494114754778
4545694169.46024644293399.539753557066
4641064452.09023422857-346.090234228566
4747944821.9838087742-27.9838087741978
4839143724.26552623583189.734473764168
4937934092.5303280244-299.530328024404
5044053968.36238551585436.637614484154
5140224502.96413202069-480.964132020692
5241004105.71823140901-5.71823140901141
5347883956.87442583456831.12557416544
5431634014.20197863793-851.201978637926
5535853589.23359998419-4.23359998418977
5639034386.72792317394-483.727923173945
5741783820.56892811952357.431071880479
5838633977.64482702668-114.644827026676

\begin{tabular}{lllllllll}
\hline
Multiple Linear Regression - Actuals, Interpolation, and Residuals \tabularnewline
Time or Index & Actuals & InterpolationForecast & ResidualsPrediction Error \tabularnewline
1 & 3922 & 4528.32826030459 & -606.328260304594 \tabularnewline
2 & 3759 & 4313.8492502141 & -554.849250214103 \tabularnewline
3 & 4138 & 4829.38911122281 & -691.389111222806 \tabularnewline
4 & 4634 & 4143.30130332614 & 490.698696673864 \tabularnewline
5 & 3996 & 4685.13591049369 & -689.135910493687 \tabularnewline
6 & 4308 & 4509.64256170842 & -201.642561708424 \tabularnewline
7 & 4429 & 4605.22540870518 & -176.225408705179 \tabularnewline
8 & 5219 & 5175.25845856678 & 43.7415414332157 \tabularnewline
9 & 4929 & 5058.45585182232 & -129.455851822320 \tabularnewline
10 & 5755 & 5042.76454948772 & 712.235450512281 \tabularnewline
11 & 5592 & 5492.33007650352 & 99.6699234964825 \tabularnewline
12 & 4163 & 4510.60036672018 & -347.600366720179 \tabularnewline
13 & 4962 & 4578.21124602734 & 383.788753972658 \tabularnewline
14 & 5208 & 4547.23707597503 & 660.762924024967 \tabularnewline
15 & 4755 & 4934.47222426914 & -179.47222426914 \tabularnewline
16 & 4491 & 4660.35922541686 & -169.359225416862 \tabularnewline
17 & 5732 & 5128.10823253225 & 603.89176746775 \tabularnewline
18 & 5731 & 4953.51197552931 & 777.488024470685 \tabularnewline
19 & 5040 & 5100.31183162873 & -60.311831628734 \tabularnewline
20 & 6102 & 5306.87751445018 & 795.122485549823 \tabularnewline
21 & 4904 & 5124.66969486927 & -220.669694869266 \tabularnewline
22 & 5369 & 4994.07325493992 & 374.926745060076 \tabularnewline
23 & 5578 & 5524.83140911207 & 53.1685908879253 \tabularnewline
24 & 4619 & 4466.00636486694 & 152.993635133062 \tabularnewline
25 & 4731 & 4610.86384102229 & 120.136158977713 \tabularnewline
26 & 5011 & 4677.62926420104 & 333.370735798963 \tabularnewline
27 & 5299 & 4866.9315025187 & 432.068497481305 \tabularnewline
28 & 4146 & 4493.82076871535 & -347.820768715352 \tabularnewline
29 & 4625 & 4674.57676147297 & -49.5767614729691 \tabularnewline
30 & 4736 & 4528.13664291905 & 207.863357080955 \tabularnewline
31 & 4219 & 4706.78770253227 & -487.787702532273 \tabularnewline
32 & 5116 & 4979.64198905432 & 136.358010945684 \tabularnewline
33 & 4205 & 4611.84527874596 & -406.84527874596 \tabularnewline
34 & 4121 & 4747.42713431711 & -626.427134317115 \tabularnewline
35 & 5103 & 5227.85470561021 & -124.854705610210 \tabularnewline
36 & 4300 & 4295.12774217705 & 4.87225782294966 \tabularnewline
37 & 4578 & 4176.06632462137 & 401.933675378628 \tabularnewline
38 & 3809 & 4684.92202409398 & -875.922024093982 \tabularnewline
39 & 5526 & 4606.24302996867 & 919.756970031334 \tabularnewline
40 & 4247 & 4214.80047113264 & 32.1995288673625 \tabularnewline
41 & 3830 & 4526.30466966653 & -696.304669666533 \tabularnewline
42 & 4394 & 4326.50684120529 & 67.4931587947101 \tabularnewline
43 & 4826 & 4097.44145714962 & 728.558542850376 \tabularnewline
44 & 4409 & 4900.49411475478 & -491.494114754778 \tabularnewline
45 & 4569 & 4169.46024644293 & 399.539753557066 \tabularnewline
46 & 4106 & 4452.09023422857 & -346.090234228566 \tabularnewline
47 & 4794 & 4821.9838087742 & -27.9838087741978 \tabularnewline
48 & 3914 & 3724.26552623583 & 189.734473764168 \tabularnewline
49 & 3793 & 4092.5303280244 & -299.530328024404 \tabularnewline
50 & 4405 & 3968.36238551585 & 436.637614484154 \tabularnewline
51 & 4022 & 4502.96413202069 & -480.964132020692 \tabularnewline
52 & 4100 & 4105.71823140901 & -5.71823140901141 \tabularnewline
53 & 4788 & 3956.87442583456 & 831.12557416544 \tabularnewline
54 & 3163 & 4014.20197863793 & -851.201978637926 \tabularnewline
55 & 3585 & 3589.23359998419 & -4.23359998418977 \tabularnewline
56 & 3903 & 4386.72792317394 & -483.727923173945 \tabularnewline
57 & 4178 & 3820.56892811952 & 357.431071880479 \tabularnewline
58 & 3863 & 3977.64482702668 & -114.644827026676 \tabularnewline
\hline
\end{tabular}
%Source: https://freestatistics.org/blog/index.php?pk=57429&T=4

[TABLE]
[ROW][C]Multiple Linear Regression - Actuals, Interpolation, and Residuals[/C][/ROW]
[ROW][C]Time or Index[/C][C]Actuals[/C][C]InterpolationForecast[/C][C]ResidualsPrediction Error[/C][/ROW]
[ROW][C]1[/C][C]3922[/C][C]4528.32826030459[/C][C]-606.328260304594[/C][/ROW]
[ROW][C]2[/C][C]3759[/C][C]4313.8492502141[/C][C]-554.849250214103[/C][/ROW]
[ROW][C]3[/C][C]4138[/C][C]4829.38911122281[/C][C]-691.389111222806[/C][/ROW]
[ROW][C]4[/C][C]4634[/C][C]4143.30130332614[/C][C]490.698696673864[/C][/ROW]
[ROW][C]5[/C][C]3996[/C][C]4685.13591049369[/C][C]-689.135910493687[/C][/ROW]
[ROW][C]6[/C][C]4308[/C][C]4509.64256170842[/C][C]-201.642561708424[/C][/ROW]
[ROW][C]7[/C][C]4429[/C][C]4605.22540870518[/C][C]-176.225408705179[/C][/ROW]
[ROW][C]8[/C][C]5219[/C][C]5175.25845856678[/C][C]43.7415414332157[/C][/ROW]
[ROW][C]9[/C][C]4929[/C][C]5058.45585182232[/C][C]-129.455851822320[/C][/ROW]
[ROW][C]10[/C][C]5755[/C][C]5042.76454948772[/C][C]712.235450512281[/C][/ROW]
[ROW][C]11[/C][C]5592[/C][C]5492.33007650352[/C][C]99.6699234964825[/C][/ROW]
[ROW][C]12[/C][C]4163[/C][C]4510.60036672018[/C][C]-347.600366720179[/C][/ROW]
[ROW][C]13[/C][C]4962[/C][C]4578.21124602734[/C][C]383.788753972658[/C][/ROW]
[ROW][C]14[/C][C]5208[/C][C]4547.23707597503[/C][C]660.762924024967[/C][/ROW]
[ROW][C]15[/C][C]4755[/C][C]4934.47222426914[/C][C]-179.47222426914[/C][/ROW]
[ROW][C]16[/C][C]4491[/C][C]4660.35922541686[/C][C]-169.359225416862[/C][/ROW]
[ROW][C]17[/C][C]5732[/C][C]5128.10823253225[/C][C]603.89176746775[/C][/ROW]
[ROW][C]18[/C][C]5731[/C][C]4953.51197552931[/C][C]777.488024470685[/C][/ROW]
[ROW][C]19[/C][C]5040[/C][C]5100.31183162873[/C][C]-60.311831628734[/C][/ROW]
[ROW][C]20[/C][C]6102[/C][C]5306.87751445018[/C][C]795.122485549823[/C][/ROW]
[ROW][C]21[/C][C]4904[/C][C]5124.66969486927[/C][C]-220.669694869266[/C][/ROW]
[ROW][C]22[/C][C]5369[/C][C]4994.07325493992[/C][C]374.926745060076[/C][/ROW]
[ROW][C]23[/C][C]5578[/C][C]5524.83140911207[/C][C]53.1685908879253[/C][/ROW]
[ROW][C]24[/C][C]4619[/C][C]4466.00636486694[/C][C]152.993635133062[/C][/ROW]
[ROW][C]25[/C][C]4731[/C][C]4610.86384102229[/C][C]120.136158977713[/C][/ROW]
[ROW][C]26[/C][C]5011[/C][C]4677.62926420104[/C][C]333.370735798963[/C][/ROW]
[ROW][C]27[/C][C]5299[/C][C]4866.9315025187[/C][C]432.068497481305[/C][/ROW]
[ROW][C]28[/C][C]4146[/C][C]4493.82076871535[/C][C]-347.820768715352[/C][/ROW]
[ROW][C]29[/C][C]4625[/C][C]4674.57676147297[/C][C]-49.5767614729691[/C][/ROW]
[ROW][C]30[/C][C]4736[/C][C]4528.13664291905[/C][C]207.863357080955[/C][/ROW]
[ROW][C]31[/C][C]4219[/C][C]4706.78770253227[/C][C]-487.787702532273[/C][/ROW]
[ROW][C]32[/C][C]5116[/C][C]4979.64198905432[/C][C]136.358010945684[/C][/ROW]
[ROW][C]33[/C][C]4205[/C][C]4611.84527874596[/C][C]-406.84527874596[/C][/ROW]
[ROW][C]34[/C][C]4121[/C][C]4747.42713431711[/C][C]-626.427134317115[/C][/ROW]
[ROW][C]35[/C][C]5103[/C][C]5227.85470561021[/C][C]-124.854705610210[/C][/ROW]
[ROW][C]36[/C][C]4300[/C][C]4295.12774217705[/C][C]4.87225782294966[/C][/ROW]
[ROW][C]37[/C][C]4578[/C][C]4176.06632462137[/C][C]401.933675378628[/C][/ROW]
[ROW][C]38[/C][C]3809[/C][C]4684.92202409398[/C][C]-875.922024093982[/C][/ROW]
[ROW][C]39[/C][C]5526[/C][C]4606.24302996867[/C][C]919.756970031334[/C][/ROW]
[ROW][C]40[/C][C]4247[/C][C]4214.80047113264[/C][C]32.1995288673625[/C][/ROW]
[ROW][C]41[/C][C]3830[/C][C]4526.30466966653[/C][C]-696.304669666533[/C][/ROW]
[ROW][C]42[/C][C]4394[/C][C]4326.50684120529[/C][C]67.4931587947101[/C][/ROW]
[ROW][C]43[/C][C]4826[/C][C]4097.44145714962[/C][C]728.558542850376[/C][/ROW]
[ROW][C]44[/C][C]4409[/C][C]4900.49411475478[/C][C]-491.494114754778[/C][/ROW]
[ROW][C]45[/C][C]4569[/C][C]4169.46024644293[/C][C]399.539753557066[/C][/ROW]
[ROW][C]46[/C][C]4106[/C][C]4452.09023422857[/C][C]-346.090234228566[/C][/ROW]
[ROW][C]47[/C][C]4794[/C][C]4821.9838087742[/C][C]-27.9838087741978[/C][/ROW]
[ROW][C]48[/C][C]3914[/C][C]3724.26552623583[/C][C]189.734473764168[/C][/ROW]
[ROW][C]49[/C][C]3793[/C][C]4092.5303280244[/C][C]-299.530328024404[/C][/ROW]
[ROW][C]50[/C][C]4405[/C][C]3968.36238551585[/C][C]436.637614484154[/C][/ROW]
[ROW][C]51[/C][C]4022[/C][C]4502.96413202069[/C][C]-480.964132020692[/C][/ROW]
[ROW][C]52[/C][C]4100[/C][C]4105.71823140901[/C][C]-5.71823140901141[/C][/ROW]
[ROW][C]53[/C][C]4788[/C][C]3956.87442583456[/C][C]831.12557416544[/C][/ROW]
[ROW][C]54[/C][C]3163[/C][C]4014.20197863793[/C][C]-851.201978637926[/C][/ROW]
[ROW][C]55[/C][C]3585[/C][C]3589.23359998419[/C][C]-4.23359998418977[/C][/ROW]
[ROW][C]56[/C][C]3903[/C][C]4386.72792317394[/C][C]-483.727923173945[/C][/ROW]
[ROW][C]57[/C][C]4178[/C][C]3820.56892811952[/C][C]357.431071880479[/C][/ROW]
[ROW][C]58[/C][C]3863[/C][C]3977.64482702668[/C][C]-114.644827026676[/C][/ROW]
[/TABLE]
Source: https://freestatistics.org/blog/index.php?pk=57429&T=4

Globally Unique Identifier (entire table): ba.freestatistics.org/blog/index.php?pk=57429&T=4

As an alternative you can also use a QR Code:  

The GUIDs for individual cells are displayed in the table below:

Multiple Linear Regression - Actuals, Interpolation, and Residuals
Time or IndexActualsInterpolationForecastResidualsPrediction Error
139224528.32826030459-606.328260304594
237594313.8492502141-554.849250214103
341384829.38911122281-691.389111222806
446344143.30130332614490.698696673864
539964685.13591049369-689.135910493687
643084509.64256170842-201.642561708424
744294605.22540870518-176.225408705179
852195175.2584585667843.7415414332157
949295058.45585182232-129.455851822320
1057555042.76454948772712.235450512281
1155925492.3300765035299.6699234964825
1241634510.60036672018-347.600366720179
1349624578.21124602734383.788753972658
1452084547.23707597503660.762924024967
1547554934.47222426914-179.47222426914
1644914660.35922541686-169.359225416862
1757325128.10823253225603.89176746775
1857314953.51197552931777.488024470685
1950405100.31183162873-60.311831628734
2061025306.87751445018795.122485549823
2149045124.66969486927-220.669694869266
2253694994.07325493992374.926745060076
2355785524.8314091120753.1685908879253
2446194466.00636486694152.993635133062
2547314610.86384102229120.136158977713
2650114677.62926420104333.370735798963
2752994866.9315025187432.068497481305
2841464493.82076871535-347.820768715352
2946254674.57676147297-49.5767614729691
3047364528.13664291905207.863357080955
3142194706.78770253227-487.787702532273
3251164979.64198905432136.358010945684
3342054611.84527874596-406.84527874596
3441214747.42713431711-626.427134317115
3551035227.85470561021-124.854705610210
3643004295.127742177054.87225782294966
3745784176.06632462137401.933675378628
3838094684.92202409398-875.922024093982
3955264606.24302996867919.756970031334
4042474214.8004711326432.1995288673625
4138304526.30466966653-696.304669666533
4243944326.5068412052967.4931587947101
4348264097.44145714962728.558542850376
4444094900.49411475478-491.494114754778
4545694169.46024644293399.539753557066
4641064452.09023422857-346.090234228566
4747944821.9838087742-27.9838087741978
4839143724.26552623583189.734473764168
4937934092.5303280244-299.530328024404
5044053968.36238551585436.637614484154
5140224502.96413202069-480.964132020692
5241004105.71823140901-5.71823140901141
5347883956.87442583456831.12557416544
5431634014.20197863793-851.201978637926
5535853589.23359998419-4.23359998418977
5639034386.72792317394-483.727923173945
5741783820.56892811952357.431071880479
5838633977.64482702668-114.644827026676


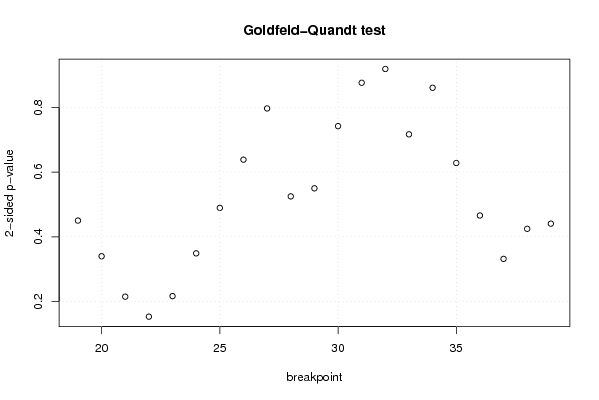
Goldfeld-Quandt test for Heteroskedasticity
p-valuesAlternative Hypothesis
breakpoint indexgreater2-sidedless
190.7749487989531220.4501024020937560.225051201046878
200.8300500586516710.3398998826966570.169949941348329
210.892471572076790.2150568558464190.107528427923210
220.9233146293438710.1533707413122570.0766853706561287
230.8916043099020730.2167913801958550.108395690097928
240.8255557778479830.3488884443040340.174444222152017
250.7553781932664170.4892436134671660.244621806733583
260.6809397499264350.638120500147130.319060250073565
270.6018491043997550.796301791200490.398150895600245
280.7376085982720660.5247828034558670.262391401727934
290.7251734110445740.5496531779108520.274826588955426
300.6291110315183880.7417779369632240.370888968481612
310.562198187431320.8756036251373610.437801812568680
320.4591501695694310.9183003391388620.540849830430569
330.3582040907858210.7164081815716410.641795909214179
340.4300824320658840.8601648641317680.569917567934116
350.3139778515688050.627955703137610.686022148431195
360.2328509484915870.4657018969831740.767149051508413
370.1659011571809020.3318023143618040.834098842819098
380.2123000870607640.4246001741215290.787699912939236
390.2202660877411300.4405321754822610.77973391225887

\begin{tabular}{lllllllll}
\hline
Goldfeld-Quandt test for Heteroskedasticity \tabularnewline
p-values & Alternative Hypothesis \tabularnewline
breakpoint index & greater & 2-sided & less \tabularnewline
19 & 0.774948798953122 & 0.450102402093756 & 0.225051201046878 \tabularnewline
20 & 0.830050058651671 & 0.339899882696657 & 0.169949941348329 \tabularnewline
21 & 0.89247157207679 & 0.215056855846419 & 0.107528427923210 \tabularnewline
22 & 0.923314629343871 & 0.153370741312257 & 0.0766853706561287 \tabularnewline
23 & 0.891604309902073 & 0.216791380195855 & 0.108395690097928 \tabularnewline
24 & 0.825555777847983 & 0.348888444304034 & 0.174444222152017 \tabularnewline
25 & 0.755378193266417 & 0.489243613467166 & 0.244621806733583 \tabularnewline
26 & 0.680939749926435 & 0.63812050014713 & 0.319060250073565 \tabularnewline
27 & 0.601849104399755 & 0.79630179120049 & 0.398150895600245 \tabularnewline
28 & 0.737608598272066 & 0.524782803455867 & 0.262391401727934 \tabularnewline
29 & 0.725173411044574 & 0.549653177910852 & 0.274826588955426 \tabularnewline
30 & 0.629111031518388 & 0.741777936963224 & 0.370888968481612 \tabularnewline
31 & 0.56219818743132 & 0.875603625137361 & 0.437801812568680 \tabularnewline
32 & 0.459150169569431 & 0.918300339138862 & 0.540849830430569 \tabularnewline
33 & 0.358204090785821 & 0.716408181571641 & 0.641795909214179 \tabularnewline
34 & 0.430082432065884 & 0.860164864131768 & 0.569917567934116 \tabularnewline
35 & 0.313977851568805 & 0.62795570313761 & 0.686022148431195 \tabularnewline
36 & 0.232850948491587 & 0.465701896983174 & 0.767149051508413 \tabularnewline
37 & 0.165901157180902 & 0.331802314361804 & 0.834098842819098 \tabularnewline
38 & 0.212300087060764 & 0.424600174121529 & 0.787699912939236 \tabularnewline
39 & 0.220266087741130 & 0.440532175482261 & 0.77973391225887 \tabularnewline
\hline
\end{tabular}
%Source: https://freestatistics.org/blog/index.php?pk=57429&T=5

[TABLE]
[ROW][C]Goldfeld-Quandt test for Heteroskedasticity[/C][/ROW]
[ROW][C]p-values[/C][C]Alternative Hypothesis[/C][/ROW]
[ROW][C]breakpoint index[/C][C]greater[/C][C]2-sided[/C][C]less[/C][/ROW]
[ROW][C]19[/C][C]0.774948798953122[/C][C]0.450102402093756[/C][C]0.225051201046878[/C][/ROW]
[ROW][C]20[/C][C]0.830050058651671[/C][C]0.339899882696657[/C][C]0.169949941348329[/C][/ROW]
[ROW][C]21[/C][C]0.89247157207679[/C][C]0.215056855846419[/C][C]0.107528427923210[/C][/ROW]
[ROW][C]22[/C][C]0.923314629343871[/C][C]0.153370741312257[/C][C]0.0766853706561287[/C][/ROW]
[ROW][C]23[/C][C]0.891604309902073[/C][C]0.216791380195855[/C][C]0.108395690097928[/C][/ROW]
[ROW][C]24[/C][C]0.825555777847983[/C][C]0.348888444304034[/C][C]0.174444222152017[/C][/ROW]
[ROW][C]25[/C][C]0.755378193266417[/C][C]0.489243613467166[/C][C]0.244621806733583[/C][/ROW]
[ROW][C]26[/C][C]0.680939749926435[/C][C]0.63812050014713[/C][C]0.319060250073565[/C][/ROW]
[ROW][C]27[/C][C]0.601849104399755[/C][C]0.79630179120049[/C][C]0.398150895600245[/C][/ROW]
[ROW][C]28[/C][C]0.737608598272066[/C][C]0.524782803455867[/C][C]0.262391401727934[/C][/ROW]
[ROW][C]29[/C][C]0.725173411044574[/C][C]0.549653177910852[/C][C]0.274826588955426[/C][/ROW]
[ROW][C]30[/C][C]0.629111031518388[/C][C]0.741777936963224[/C][C]0.370888968481612[/C][/ROW]
[ROW][C]31[/C][C]0.56219818743132[/C][C]0.875603625137361[/C][C]0.437801812568680[/C][/ROW]
[ROW][C]32[/C][C]0.459150169569431[/C][C]0.918300339138862[/C][C]0.540849830430569[/C][/ROW]
[ROW][C]33[/C][C]0.358204090785821[/C][C]0.716408181571641[/C][C]0.641795909214179[/C][/ROW]
[ROW][C]34[/C][C]0.430082432065884[/C][C]0.860164864131768[/C][C]0.569917567934116[/C][/ROW]
[ROW][C]35[/C][C]0.313977851568805[/C][C]0.62795570313761[/C][C]0.686022148431195[/C][/ROW]
[ROW][C]36[/C][C]0.232850948491587[/C][C]0.465701896983174[/C][C]0.767149051508413[/C][/ROW]
[ROW][C]37[/C][C]0.165901157180902[/C][C]0.331802314361804[/C][C]0.834098842819098[/C][/ROW]
[ROW][C]38[/C][C]0.212300087060764[/C][C]0.424600174121529[/C][C]0.787699912939236[/C][/ROW]
[ROW][C]39[/C][C]0.220266087741130[/C][C]0.440532175482261[/C][C]0.77973391225887[/C][/ROW]
[/TABLE]
Source: https://freestatistics.org/blog/index.php?pk=57429&T=5

Globally Unique Identifier (entire table): ba.freestatistics.org/blog/index.php?pk=57429&T=5

As an alternative you can also use a QR Code:  

The GUIDs for individual cells are displayed in the table below:

Goldfeld-Quandt test for Heteroskedasticity
p-valuesAlternative Hypothesis
breakpoint indexgreater2-sidedless
190.7749487989531220.4501024020937560.225051201046878
200.8300500586516710.3398998826966570.169949941348329
210.892471572076790.2150568558464190.107528427923210
220.9233146293438710.1533707413122570.0766853706561287
230.8916043099020730.2167913801958550.108395690097928
240.8255557778479830.3488884443040340.174444222152017
250.7553781932664170.4892436134671660.244621806733583
260.6809397499264350.638120500147130.319060250073565
270.6018491043997550.796301791200490.398150895600245
280.7376085982720660.5247828034558670.262391401727934
290.7251734110445740.5496531779108520.274826588955426
300.6291110315183880.7417779369632240.370888968481612
310.562198187431320.8756036251373610.437801812568680
320.4591501695694310.9183003391388620.540849830430569
330.3582040907858210.7164081815716410.641795909214179
340.4300824320658840.8601648641317680.569917567934116
350.3139778515688050.627955703137610.686022148431195
360.2328509484915870.4657018969831740.767149051508413
370.1659011571809020.3318023143618040.834098842819098
380.2123000870607640.4246001741215290.787699912939236
390.2202660877411300.4405321754822610.77973391225887


Meta Analysis of Goldfeld-Quandt test for Heteroskedasticity
Description# significant tests% significant testsOK/NOK
1% type I error level00OK
5% type I error level00OK
10% type I error level00OK

\begin{tabular}{lllllllll}
\hline
Meta Analysis of Goldfeld-Quandt test for Heteroskedasticity \tabularnewline
Description & # significant tests & % significant tests & OK/NOK \tabularnewline
1% type I error level & 0 & 0 & OK \tabularnewline
5% type I error level & 0 & 0 & OK \tabularnewline
10% type I error level & 0 & 0 & OK \tabularnewline
\hline
\end{tabular}
%Source: https://freestatistics.org/blog/index.php?pk=57429&T=6

[TABLE]
[ROW][C]Meta Analysis of Goldfeld-Quandt test for Heteroskedasticity[/C][/ROW]
[ROW][C]Description[/C][C]# significant tests[/C][C]% significant tests[/C][C]OK/NOK[/C][/ROW]
[ROW][C]1% type I error level[/C][C]0[/C][C]0[/C][C]OK[/C][/ROW]
[ROW][C]5% type I error level[/C][C]0[/C][C]0[/C][C]OK[/C][/ROW]
[ROW][C]10% type I error level[/C][C]0[/C][C]0[/C][C]OK[/C][/ROW]
[/TABLE]
Source: https://freestatistics.org/blog/index.php?pk=57429&T=6

Globally Unique Identifier (entire table): ba.freestatistics.org/blog/index.php?pk=57429&T=6

As an alternative you can also use a QR Code:  

The GUIDs for individual cells are displayed in the table below:

Meta Analysis of Goldfeld-Quandt test for Heteroskedasticity
Description# significant tests% significant testsOK/NOK
1% type I error level00OK
5% type I error level00OK
10% type I error level00OK


Parameters (Session):
par1 = 3 ; par2 = Include Monthly Dummies ; par3 = Linear Trend ;
Parameters (R input):
par1 = 3 ; par2 = Include Monthly Dummies ; par3 = Linear Trend ;
R code (references can be found in the software module):
library(lattice)
library(lmtest)
n25 <- 25 #minimum number of obs. for Goldfeld-Quandt test
par1 <- as.numeric(par1)
x <- t(y)
k <- length(x[1,])
n <- length(x[,1])
x1 <- cbind(x[,par1], x[,1:k!=par1])
mycolnames <- c(colnames(x)[par1], colnames(x)[1:k!=par1])
colnames(x1) <- mycolnames #colnames(x)[par1]
x <- x1
if (par3 == 'First Differences'){
x2 <- array(0, dim=c(n-1,k), dimnames=list(1:(n-1), paste('(1-B)',colnames(x),sep='')))
for (i in 1:n-1) {
for (j in 1:k) {
x2[i,j] <- x[i+1,j] - x[i,j]
}
}
x <- x2
}
if (par2 == 'Include Monthly Dummies'){
x2 <- array(0, dim=c(n,11), dimnames=list(1:n, paste('M', seq(1:11), sep ='')))
for (i in 1:11){
x2[seq(i,n,12),i] <- 1
}
x <- cbind(x, x2)
}
if (par2 == 'Include Quarterly Dummies'){
x2 <- array(0, dim=c(n,3), dimnames=list(1:n, paste('Q', seq(1:3), sep ='')))
for (i in 1:3){
x2[seq(i,n,4),i] <- 1
}
x <- cbind(x, x2)
}
k <- length(x[1,])
if (par3 == 'Linear Trend'){
x <- cbind(x, c(1:n))
colnames(x)[k+1] <- 't'
}
x
k <- length(x[1,])
df <- as.data.frame(x)
(mylm <- lm(df))
(mysum <- summary(mylm))
if (n > n25) {
kp3 <- k + 3
nmkm3 <- n - k - 3
gqarr <- array(NA, dim=c(nmkm3-kp3+1,3))
numgqtests <- 0
numsignificant1 <- 0
numsignificant5 <- 0
numsignificant10 <- 0
for (mypoint in kp3:nmkm3) {
j <- 0
numgqtests <- numgqtests + 1
for (myalt in c('greater', 'two.sided', 'less')) {
j <- j + 1
gqarr[mypoint-kp3+1,j] <- gqtest(mylm, point=mypoint, alternative=myalt)$p.value
}
if (gqarr[mypoint-kp3+1,2] < 0.01) numsignificant1 <- numsignificant1 + 1
if (gqarr[mypoint-kp3+1,2] < 0.05) numsignificant5 <- numsignificant5 + 1
if (gqarr[mypoint-kp3+1,2] < 0.10) numsignificant10 <- numsignificant10 + 1
}
gqarr
}
bitmap(file='test0.png')
plot(x[,1], type='l', main='Actuals and Interpolation', ylab='value of Actuals and Interpolation (dots)', xlab='time or index')
points(x[,1]-mysum$resid)
grid()
dev.off()
bitmap(file='test1.png')
plot(mysum$resid, type='b', pch=19, main='Residuals', ylab='value of Residuals', xlab='time or index')
grid()
dev.off()
bitmap(file='test2.png')
hist(mysum$resid, main='Residual Histogram', xlab='values of Residuals')
grid()
dev.off()
bitmap(file='test3.png')
densityplot(~mysum$resid,col='black',main='Residual Density Plot', xlab='values of Residuals')
dev.off()
bitmap(file='test4.png')
qqnorm(mysum$resid, main='Residual Normal Q-Q Plot')
qqline(mysum$resid)
grid()
dev.off()
(myerror <- as.ts(mysum$resid))
bitmap(file='test5.png')
dum <- cbind(lag(myerror,k=1),myerror)
dum
dum1 <- dum[2:length(myerror),]
dum1
z <- as.data.frame(dum1)
z
plot(z,main=paste('Residual Lag plot, lowess, and regression line'), ylab='values of Residuals', xlab='lagged values of Residuals')
lines(lowess(z))
abline(lm(z))
grid()
dev.off()
bitmap(file='test6.png')
acf(mysum$resid, lag.max=length(mysum$resid)/2, main='Residual Autocorrelation Function')
grid()
dev.off()
bitmap(file='test7.png')
pacf(mysum$resid, lag.max=length(mysum$resid)/2, main='Residual Partial Autocorrelation Function')
grid()
dev.off()
bitmap(file='test8.png')
opar <- par(mfrow = c(2,2), oma = c(0, 0, 1.1, 0))
plot(mylm, las = 1, sub='Residual Diagnostics')
par(opar)
dev.off()
if (n > n25) {
bitmap(file='test9.png')
plot(kp3:nmkm3,gqarr[,2], main='Goldfeld-Quandt test',ylab='2-sided p-value',xlab='breakpoint')
grid()
dev.off()
}
load(file='createtable')
a<-table.start()
a<-table.row.start(a)
a<-table.element(a, 'Multiple Linear Regression - Estimated Regression Equation', 1, TRUE)
a<-table.row.end(a)
myeq <- colnames(x)[1]
myeq <- paste(myeq, '[t] = ', sep='')
for (i in 1:k){
if (mysum$coefficients[i,1] > 0) myeq <- paste(myeq, '+', '')
myeq <- paste(myeq, mysum$coefficients[i,1], sep=' ')
if (rownames(mysum$coefficients)[i] != '(Intercept)') {
myeq <- paste(myeq, rownames(mysum$coefficients)[i], sep='')
if (rownames(mysum$coefficients)[i] != 't') myeq <- paste(myeq, '[t]', sep='')
}
}
myeq <- paste(myeq, ' + e[t]')
a<-table.row.start(a)
a<-table.element(a, myeq)
a<-table.row.end(a)
a<-table.end(a)
table.save(a,file='mytable1.tab')
a<-table.start()
a<-table.row.start(a)
a<-table.element(a,hyperlink('ols1.htm','Multiple Linear Regression - Ordinary Least Squares',''), 6, TRUE)
a<-table.row.end(a)
a<-table.row.start(a)
a<-table.element(a,'Variable',header=TRUE)
a<-table.element(a,'Parameter',header=TRUE)
a<-table.element(a,'S.D.',header=TRUE)
a<-table.element(a,'T-STAT
H0: parameter = 0',header=TRUE)
a<-table.element(a,'2-tail p-value',header=TRUE)
a<-table.element(a,'1-tail p-value',header=TRUE)
a<-table.row.end(a)
for (i in 1:k){
a<-table.row.start(a)
a<-table.element(a,rownames(mysum$coefficients)[i],header=TRUE)
a<-table.element(a,mysum$coefficients[i,1])
a<-table.element(a, round(mysum$coefficients[i,2],6))
a<-table.element(a, round(mysum$coefficients[i,3],4))
a<-table.element(a, round(mysum$coefficients[i,4],6))
a<-table.element(a, round(mysum$coefficients[i,4]/2,6))
a<-table.row.end(a)
}
a<-table.end(a)
table.save(a,file='mytable2.tab')
a<-table.start()
a<-table.row.start(a)
a<-table.element(a, 'Multiple Linear Regression - Regression Statistics', 2, TRUE)
a<-table.row.end(a)
a<-table.row.start(a)
a<-table.element(a, 'Multiple R',1,TRUE)
a<-table.element(a, sqrt(mysum$r.squared))
a<-table.row.end(a)
a<-table.row.start(a)
a<-table.element(a, 'R-squared',1,TRUE)
a<-table.element(a, mysum$r.squared)
a<-table.row.end(a)
a<-table.row.start(a)
a<-table.element(a, 'Adjusted R-squared',1,TRUE)
a<-table.element(a, mysum$adj.r.squared)
a<-table.row.end(a)
a<-table.row.start(a)
a<-table.element(a, 'F-TEST (value)',1,TRUE)
a<-table.element(a, mysum$fstatistic[1])
a<-table.row.end(a)
a<-table.row.start(a)
a<-table.element(a, 'F-TEST (DF numerator)',1,TRUE)
a<-table.element(a, mysum$fstatistic[2])
a<-table.row.end(a)
a<-table.row.start(a)
a<-table.element(a, 'F-TEST (DF denominator)',1,TRUE)
a<-table.element(a, mysum$fstatistic[3])
a<-table.row.end(a)
a<-table.row.start(a)
a<-table.element(a, 'p-value',1,TRUE)
a<-table.element(a, 1-pf(mysum$fstatistic[1],mysum$fstatistic[2],mysum$fstatistic[3]))
a<-table.row.end(a)
a<-table.row.start(a)
a<-table.element(a, 'Multiple Linear Regression - Residual Statistics', 2, TRUE)
a<-table.row.end(a)
a<-table.row.start(a)
a<-table.element(a, 'Residual Standard Deviation',1,TRUE)
a<-table.element(a, mysum$sigma)
a<-table.row.end(a)
a<-table.row.start(a)
a<-table.element(a, 'Sum Squared Residuals',1,TRUE)
a<-table.element(a, sum(myerror*myerror))
a<-table.row.end(a)
a<-table.end(a)
table.save(a,file='mytable3.tab')
a<-table.start()
a<-table.row.start(a)
a<-table.element(a, 'Multiple Linear Regression - Actuals, Interpolation, and Residuals', 4, TRUE)
a<-table.row.end(a)
a<-table.row.start(a)
a<-table.element(a, 'Time or Index', 1, TRUE)
a<-table.element(a, 'Actuals', 1, TRUE)
a<-table.element(a, 'Interpolation
Forecast', 1, TRUE)
a<-table.element(a, 'Residuals
Prediction Error', 1, TRUE)
a<-table.row.end(a)
for (i in 1:n) {
a<-table.row.start(a)
a<-table.element(a,i, 1, TRUE)
a<-table.element(a,x[i])
a<-table.element(a,x[i]-mysum$resid[i])
a<-table.element(a,mysum$resid[i])
a<-table.row.end(a)
}
a<-table.end(a)
table.save(a,file='mytable4.tab')
if (n > n25) {
a<-table.start()
a<-table.row.start(a)
a<-table.element(a,'Goldfeld-Quandt test for Heteroskedasticity',4,TRUE)
a<-table.row.end(a)
a<-table.row.start(a)
a<-table.element(a,'p-values',header=TRUE)
a<-table.element(a,'Alternative Hypothesis',3,header=TRUE)
a<-table.row.end(a)
a<-table.row.start(a)
a<-table.element(a,'breakpoint index',header=TRUE)
a<-table.element(a,'greater',header=TRUE)
a<-table.element(a,'2-sided',header=TRUE)
a<-table.element(a,'less',header=TRUE)
a<-table.row.end(a)
for (mypoint in kp3:nmkm3) {
a<-table.row.start(a)
a<-table.element(a,mypoint,header=TRUE)
a<-table.element(a,gqarr[mypoint-kp3+1,1])
a<-table.element(a,gqarr[mypoint-kp3+1,2])
a<-table.element(a,gqarr[mypoint-kp3+1,3])
a<-table.row.end(a)
}
a<-table.end(a)
table.save(a,file='mytable5.tab')
a<-table.start()
a<-table.row.start(a)
a<-table.element(a,'Meta Analysis of Goldfeld-Quandt test for Heteroskedasticity',4,TRUE)
a<-table.row.end(a)
a<-table.row.start(a)
a<-table.element(a,'Description',header=TRUE)
a<-table.element(a,'# significant tests',header=TRUE)
a<-table.element(a,'% significant tests',header=TRUE)
a<-table.element(a,'OK/NOK',header=TRUE)
a<-table.row.end(a)
a<-table.row.start(a)
a<-table.element(a,'1% type I error level',header=TRUE)
a<-table.element(a,numsignificant1)
a<-table.element(a,numsignificant1/numgqtests)
if (numsignificant1/numgqtests < 0.01) dum <- 'OK' else dum <- 'NOK'
a<-table.element(a,dum)
a<-table.row.end(a)
a<-table.row.start(a)
a<-table.element(a,'5% type I error level',header=TRUE)
a<-table.element(a,numsignificant5)
a<-table.element(a,numsignificant5/numgqtests)
if (numsignificant5/numgqtests < 0.05) dum <- 'OK' else dum <- 'NOK'
a<-table.element(a,dum)
a<-table.row.end(a)
a<-table.row.start(a)
a<-table.element(a,'10% type I error level',header=TRUE)
a<-table.element(a,numsignificant10)
a<-table.element(a,numsignificant10/numgqtests)
if (numsignificant10/numgqtests < 0.1) dum <- 'OK' else dum <- 'NOK'
a<-table.element(a,dum)
a<-table.row.end(a)
a<-table.end(a)
table.save(a,file='mytable6.tab')
}