Free Statistics

of Irreproducible Research!

Author's title

Author*The author of this computation has been verified*
R Software Modulerwasp_multipleregression.wasp
Title produced by softwareMultiple Regression
Date of computationWed, 18 Nov 2009 09:09:53 -0700
Cite this page as followsStatistical Computations at FreeStatistics.org, Office for Research Development and Education, URL https://freestatistics.org/blog/index.php?v=date/2009/Nov/18/t1258560696rfqu0a6wkspj5st.htm/, Retrieved Sun, 05 May 2024 09:45:48 +0000
Statistical Computations at FreeStatistics.org, Office for Research Development and Education, URL https://freestatistics.org/blog/index.php?pk=57496, Retrieved Sun, 05 May 2024 09:45:48 +0000
QR Codes:

Original text written by user:
IsPrivate?No (this computation is public)
User-defined keywords
Estimated Impact143
Family? (F = Feedback message, R = changed R code, M = changed R Module, P = changed Parameters, D = changed Data)
-     [Multiple Regression] [Q1 The Seatbeltlaw] [2007-11-14 19:27:43] [8cd6641b921d30ebe00b648d1481bba0]
- RMPD  [Multiple Regression] [Seatbelt] [2009-11-12 13:54:52] [b98453cac15ba1066b407e146608df68]
-   PD      [Multiple Regression] [Multiple regressi...] [2009-11-18 16:09:53] [fe2edc5b0acc9545190e03904e9be55e] [Current]
Feedback Forum

Post a new message
Dataseries X:
3.27	96.92	3.36	3.45	3.52	3.58
3.21	99.06	3.27	3.36	3.45	3.52
3.19	99.65	3.21	3.27	3.36	3.45
3.16	99.82	3.19	3.21	3.27	3.36
3.12	99.99	3.16	3.19	3.21	3.27
3.06	100.33	3.12	3.16	3.19	3.21
3.01	99.31	3.06	3.12	3.16	3.19
2.98	101.1	3.01	3.06	3.12	3.16
2.97	101.1	2.98	3.01	3.06	3.12
3.02	100.93	2.97	2.98	3.01	3.06
3.07	100.85	3.02	2.97	2.98	3.01
3.18	100.93	3.07	3.02	2.97	2.98
3.29	99.6	3.18	3.07	3.02	2.97
3.43	101.88	3.29	3.18	3.07	3.02
3.61	101.81	3.43	3.29	3.18	3.07
3.74	102.38	3.61	3.43	3.29	3.18
3.87	102.74	3.74	3.61	3.43	3.29
3.88	102.82	3.87	3.74	3.61	3.43
4.09	101.72	3.88	3.87	3.74	3.61
4.19	103.47	4.09	3.88	3.87	3.74
4.2	102.98	4.19	4.09	3.88	3.87
4.29	102.68	4.2	4.19	4.09	3.88
4.37	102.9	4.29	4.2	4.19	4.09
4.47	103.03	4.37	4.29	4.2	4.19
4.61	101.29	4.47	4.37	4.29	4.2
4.65	103.69	4.61	4.47	4.37	4.29
4.69	103.68	4.65	4.61	4.47	4.37
4.82	104.2	4.69	4.65	4.61	4.47
4.86	104.08	4.82	4.69	4.65	4.61
4.87	104.16	4.86	4.82	4.69	4.65
5.01	103.05	4.87	4.86	4.82	4.69
5.03	104.66	5.01	4.87	4.86	4.82
5.13	104.46	5.03	5.01	4.87	4.86
5.18	104.95	5.13	5.03	5.01	4.87
5.21	105.85	5.18	5.13	5.03	5.01
5.26	106.23	5.21	5.18	5.13	5.03
5.25	104.86	5.26	5.21	5.18	5.13
5.2	107.44	5.25	5.26	5.21	5.18
5.16	108.23	5.2	5.25	5.26	5.21
5.19	108.45	5.16	5.2	5.25	5.26
5.39	109.39	5.19	5.16	5.2	5.25
5.58	110.15	5.39	5.19	5.16	5.2
5.76	109.13	5.58	5.39	5.19	5.16
5.89	110.28	5.76	5.58	5.39	5.19
5.98	110.17	5.89	5.76	5.58	5.39
6.02	109.99	5.98	5.89	5.76	5.58
5.62	109.26	6.02	5.98	5.89	5.76
4.87	109.11	5.62	6.02	5.98	5.89
4.24	107.06	4.87	5.62	6.02	5.98
4.02	109.53	4.24	4.87	5.62	6.02
3.74	108.92	4.02	4.24	4.87	5.62
3.45	109.24	3.74	4.02	4.24	4.87
3.34	109.12	3.45	3.74	4.02	4.24
3.21	109	3.34	3.45	3.74	4.02
3.12	107.23	3.21	3.34	3.45	3.74
3.04	109.49	3.12	3.21	3.34	3.45


Summary of computational transaction
Raw Inputview raw input (R code)
Raw Outputview raw output of R engine
Computing time4 seconds
R Server'Gwilym Jenkins' @ 72.249.127.135

\begin{tabular}{lllllllll}
\hline
Summary of computational transaction \tabularnewline
Raw Input & view raw input (R code)  \tabularnewline
Raw Output & view raw output of R engine  \tabularnewline
Computing time & 4 seconds \tabularnewline
R Server & 'Gwilym Jenkins' @ 72.249.127.135 \tabularnewline
\hline
\end{tabular}
%Source: https://freestatistics.org/blog/index.php?pk=57496&T=0

[TABLE]
[ROW][C]Summary of computational transaction[/C][/ROW]
[ROW][C]Raw Input[/C][C]view raw input (R code) [/C][/ROW]
[ROW][C]Raw Output[/C][C]view raw output of R engine [/C][/ROW]
[ROW][C]Computing time[/C][C]4 seconds[/C][/ROW]
[ROW][C]R Server[/C][C]'Gwilym Jenkins' @ 72.249.127.135[/C][/ROW]
[/TABLE]
Source: https://freestatistics.org/blog/index.php?pk=57496&T=0

Globally Unique Identifier (entire table): ba.freestatistics.org/blog/index.php?pk=57496&T=0

As an alternative you can also use a QR Code:  

The GUIDs for individual cells are displayed in the table below:

Summary of computational transaction
Raw Inputview raw input (R code)
Raw Outputview raw output of R engine
Computing time4 seconds
R Server'Gwilym Jenkins' @ 72.249.127.135


Multiple Linear Regression - Estimated Regression Equation
Y[t] = -0.486327079223412 + 0.00611586251224402X[t] + 2.07287164902775y1[t] -1.64300868259871y2[t] + 0.856985292888784y3[t] -0.325886914504195y4[t] + 0.0311898048205206M1[t] + 0.0598635284101705M2[t] + 0.0192550274169363M3[t] + 0.0565525488623294M4[t] + 0.0670503500066354M5[t] -0.0200445648885039M6[t] + 0.127213321639962M7[t] -0.0494587964326408M8[t] + 0.0760095825978439M9[t] + 0.0356136822759580M10[t] -0.0734623990165165M11[t] -0.00057286681626014t + e[t]

\begin{tabular}{lllllllll}
\hline
Multiple Linear Regression - Estimated Regression Equation \tabularnewline
Y[t] =  -0.486327079223412 +  0.00611586251224402X[t] +  2.07287164902775y1[t] -1.64300868259871y2[t] +  0.856985292888784y3[t] -0.325886914504195y4[t] +  0.0311898048205206M1[t] +  0.0598635284101705M2[t] +  0.0192550274169363M3[t] +  0.0565525488623294M4[t] +  0.0670503500066354M5[t] -0.0200445648885039M6[t] +  0.127213321639962M7[t] -0.0494587964326408M8[t] +  0.0760095825978439M9[t] +  0.0356136822759580M10[t] -0.0734623990165165M11[t] -0.00057286681626014t  + e[t] \tabularnewline
\hline
\end{tabular}
%Source: https://freestatistics.org/blog/index.php?pk=57496&T=1

[TABLE]
[ROW][C]Multiple Linear Regression - Estimated Regression Equation[/C][/ROW]
[ROW][C]Y[t] =  -0.486327079223412 +  0.00611586251224402X[t] +  2.07287164902775y1[t] -1.64300868259871y2[t] +  0.856985292888784y3[t] -0.325886914504195y4[t] +  0.0311898048205206M1[t] +  0.0598635284101705M2[t] +  0.0192550274169363M3[t] +  0.0565525488623294M4[t] +  0.0670503500066354M5[t] -0.0200445648885039M6[t] +  0.127213321639962M7[t] -0.0494587964326408M8[t] +  0.0760095825978439M9[t] +  0.0356136822759580M10[t] -0.0734623990165165M11[t] -0.00057286681626014t  + e[t][/C][/ROW]
[/TABLE]
Source: https://freestatistics.org/blog/index.php?pk=57496&T=1

Globally Unique Identifier (entire table): ba.freestatistics.org/blog/index.php?pk=57496&T=1

As an alternative you can also use a QR Code:  

The GUIDs for individual cells are displayed in the table below:

Multiple Linear Regression - Estimated Regression Equation
Y[t] = -0.486327079223412 + 0.00611586251224402X[t] + 2.07287164902775y1[t] -1.64300868259871y2[t] + 0.856985292888784y3[t] -0.325886914504195y4[t] + 0.0311898048205206M1[t] + 0.0598635284101705M2[t] + 0.0192550274169363M3[t] + 0.0565525488623294M4[t] + 0.0670503500066354M5[t] -0.0200445648885039M6[t] + 0.127213321639962M7[t] -0.0494587964326408M8[t] + 0.0760095825978439M9[t] + 0.0356136822759580M10[t] -0.0734623990165165M11[t] -0.00057286681626014t + e[t]


Multiple Linear Regression - Ordinary Least Squares
VariableParameterS.D.T-STATH0: parameter = 02-tail p-value1-tail p-value
(Intercept)-0.4863270792234121.706052-0.28510.7771460.388573
X0.006115862512244020.0177340.34490.73210.36605
y12.072871649027750.15608413.280500
y2-1.643008682598710.347094-4.73363e-051.5e-05
y30.8569852928887840.3531572.42660.0200920.010046
y4-0.3258869145041950.172331-1.89110.0662590.033129
M10.03118980482052060.08070.38650.7012880.350644
M20.05986352841017050.0761260.78640.4365240.218262
M30.01925502741693630.0768680.25050.8035550.401777
M40.05655254886232940.0749540.75450.4552010.227601
M50.06705035000663540.0756990.88580.3813210.19066
M6-0.02004456488850390.077199-0.25960.7965360.398268
M70.1272133216399620.0743891.71010.0953990.047699
M8-0.04945879643264080.081015-0.61050.5451740.272587
M90.07600958259784390.0770450.98660.3300960.165048
M100.03561368227595800.0792330.44950.6556370.327818
M11-0.07346239901651650.078248-0.93880.3537440.176872
t-0.000572866816260140.003685-0.15550.877270.438635

\begin{tabular}{lllllllll}
\hline
Multiple Linear Regression - Ordinary Least Squares \tabularnewline
Variable & Parameter & S.D. & T-STATH0: parameter = 0 & 2-tail p-value & 1-tail p-value \tabularnewline
(Intercept) & -0.486327079223412 & 1.706052 & -0.2851 & 0.777146 & 0.388573 \tabularnewline
X & 0.00611586251224402 & 0.017734 & 0.3449 & 0.7321 & 0.36605 \tabularnewline
y1 & 2.07287164902775 & 0.156084 & 13.2805 & 0 & 0 \tabularnewline
y2 & -1.64300868259871 & 0.347094 & -4.7336 & 3e-05 & 1.5e-05 \tabularnewline
y3 & 0.856985292888784 & 0.353157 & 2.4266 & 0.020092 & 0.010046 \tabularnewline
y4 & -0.325886914504195 & 0.172331 & -1.8911 & 0.066259 & 0.033129 \tabularnewline
M1 & 0.0311898048205206 & 0.0807 & 0.3865 & 0.701288 & 0.350644 \tabularnewline
M2 & 0.0598635284101705 & 0.076126 & 0.7864 & 0.436524 & 0.218262 \tabularnewline
M3 & 0.0192550274169363 & 0.076868 & 0.2505 & 0.803555 & 0.401777 \tabularnewline
M4 & 0.0565525488623294 & 0.074954 & 0.7545 & 0.455201 & 0.227601 \tabularnewline
M5 & 0.0670503500066354 & 0.075699 & 0.8858 & 0.381321 & 0.19066 \tabularnewline
M6 & -0.0200445648885039 & 0.077199 & -0.2596 & 0.796536 & 0.398268 \tabularnewline
M7 & 0.127213321639962 & 0.074389 & 1.7101 & 0.095399 & 0.047699 \tabularnewline
M8 & -0.0494587964326408 & 0.081015 & -0.6105 & 0.545174 & 0.272587 \tabularnewline
M9 & 0.0760095825978439 & 0.077045 & 0.9866 & 0.330096 & 0.165048 \tabularnewline
M10 & 0.0356136822759580 & 0.079233 & 0.4495 & 0.655637 & 0.327818 \tabularnewline
M11 & -0.0734623990165165 & 0.078248 & -0.9388 & 0.353744 & 0.176872 \tabularnewline
t & -0.00057286681626014 & 0.003685 & -0.1555 & 0.87727 & 0.438635 \tabularnewline
\hline
\end{tabular}
%Source: https://freestatistics.org/blog/index.php?pk=57496&T=2

[TABLE]
[ROW][C]Multiple Linear Regression - Ordinary Least Squares[/C][/ROW]
[ROW][C]Variable[/C][C]Parameter[/C][C]S.D.[/C][C]T-STATH0: parameter = 0[/C][C]2-tail p-value[/C][C]1-tail p-value[/C][/ROW]
[ROW][C](Intercept)[/C][C]-0.486327079223412[/C][C]1.706052[/C][C]-0.2851[/C][C]0.777146[/C][C]0.388573[/C][/ROW]
[ROW][C]X[/C][C]0.00611586251224402[/C][C]0.017734[/C][C]0.3449[/C][C]0.7321[/C][C]0.36605[/C][/ROW]
[ROW][C]y1[/C][C]2.07287164902775[/C][C]0.156084[/C][C]13.2805[/C][C]0[/C][C]0[/C][/ROW]
[ROW][C]y2[/C][C]-1.64300868259871[/C][C]0.347094[/C][C]-4.7336[/C][C]3e-05[/C][C]1.5e-05[/C][/ROW]
[ROW][C]y3[/C][C]0.856985292888784[/C][C]0.353157[/C][C]2.4266[/C][C]0.020092[/C][C]0.010046[/C][/ROW]
[ROW][C]y4[/C][C]-0.325886914504195[/C][C]0.172331[/C][C]-1.8911[/C][C]0.066259[/C][C]0.033129[/C][/ROW]
[ROW][C]M1[/C][C]0.0311898048205206[/C][C]0.0807[/C][C]0.3865[/C][C]0.701288[/C][C]0.350644[/C][/ROW]
[ROW][C]M2[/C][C]0.0598635284101705[/C][C]0.076126[/C][C]0.7864[/C][C]0.436524[/C][C]0.218262[/C][/ROW]
[ROW][C]M3[/C][C]0.0192550274169363[/C][C]0.076868[/C][C]0.2505[/C][C]0.803555[/C][C]0.401777[/C][/ROW]
[ROW][C]M4[/C][C]0.0565525488623294[/C][C]0.074954[/C][C]0.7545[/C][C]0.455201[/C][C]0.227601[/C][/ROW]
[ROW][C]M5[/C][C]0.0670503500066354[/C][C]0.075699[/C][C]0.8858[/C][C]0.381321[/C][C]0.19066[/C][/ROW]
[ROW][C]M6[/C][C]-0.0200445648885039[/C][C]0.077199[/C][C]-0.2596[/C][C]0.796536[/C][C]0.398268[/C][/ROW]
[ROW][C]M7[/C][C]0.127213321639962[/C][C]0.074389[/C][C]1.7101[/C][C]0.095399[/C][C]0.047699[/C][/ROW]
[ROW][C]M8[/C][C]-0.0494587964326408[/C][C]0.081015[/C][C]-0.6105[/C][C]0.545174[/C][C]0.272587[/C][/ROW]
[ROW][C]M9[/C][C]0.0760095825978439[/C][C]0.077045[/C][C]0.9866[/C][C]0.330096[/C][C]0.165048[/C][/ROW]
[ROW][C]M10[/C][C]0.0356136822759580[/C][C]0.079233[/C][C]0.4495[/C][C]0.655637[/C][C]0.327818[/C][/ROW]
[ROW][C]M11[/C][C]-0.0734623990165165[/C][C]0.078248[/C][C]-0.9388[/C][C]0.353744[/C][C]0.176872[/C][/ROW]
[ROW][C]t[/C][C]-0.00057286681626014[/C][C]0.003685[/C][C]-0.1555[/C][C]0.87727[/C][C]0.438635[/C][/ROW]
[/TABLE]
Source: https://freestatistics.org/blog/index.php?pk=57496&T=2

Globally Unique Identifier (entire table): ba.freestatistics.org/blog/index.php?pk=57496&T=2

As an alternative you can also use a QR Code:  

The GUIDs for individual cells are displayed in the table below:

Multiple Linear Regression - Ordinary Least Squares
VariableParameterS.D.T-STATH0: parameter = 02-tail p-value1-tail p-value
(Intercept)-0.4863270792234121.706052-0.28510.7771460.388573
X0.006115862512244020.0177340.34490.73210.36605
y12.072871649027750.15608413.280500
y2-1.643008682598710.347094-4.73363e-051.5e-05
y30.8569852928887840.3531572.42660.0200920.010046
y4-0.3258869145041950.172331-1.89110.0662590.033129
M10.03118980482052060.08070.38650.7012880.350644
M20.05986352841017050.0761260.78640.4365240.218262
M30.01925502741693630.0768680.25050.8035550.401777
M40.05655254886232940.0749540.75450.4552010.227601
M50.06705035000663540.0756990.88580.3813210.19066
M6-0.02004456488850390.077199-0.25960.7965360.398268
M70.1272133216399620.0743891.71010.0953990.047699
M8-0.04945879643264080.081015-0.61050.5451740.272587
M90.07600958259784390.0770450.98660.3300960.165048
M100.03561368227595800.0792330.44950.6556370.327818
M11-0.07346239901651650.078248-0.93880.3537440.176872
t-0.000572866816260140.003685-0.15550.877270.438635


Multiple Linear Regression - Regression Statistics
Multiple R0.995688523872363
R-squared0.991395636571125
Adjusted R-squared0.987546316089786
F-TEST (value)257.550817443581
F-TEST (DF numerator)17
F-TEST (DF denominator)38
p-value0
Multiple Linear Regression - Residual Statistics
Residual Standard Deviation0.106935210078802
Sum Squared Residuals0.434535287874708

\begin{tabular}{lllllllll}
\hline
Multiple Linear Regression - Regression Statistics \tabularnewline
Multiple R & 0.995688523872363 \tabularnewline
R-squared & 0.991395636571125 \tabularnewline
Adjusted R-squared & 0.987546316089786 \tabularnewline
F-TEST (value) & 257.550817443581 \tabularnewline
F-TEST (DF numerator) & 17 \tabularnewline
F-TEST (DF denominator) & 38 \tabularnewline
p-value & 0 \tabularnewline
Multiple Linear Regression - Residual Statistics \tabularnewline
Residual Standard Deviation & 0.106935210078802 \tabularnewline
Sum Squared Residuals & 0.434535287874708 \tabularnewline
\hline
\end{tabular}
%Source: https://freestatistics.org/blog/index.php?pk=57496&T=3

[TABLE]
[ROW][C]Multiple Linear Regression - Regression Statistics[/C][/ROW]
[ROW][C]Multiple R[/C][C]0.995688523872363[/C][/ROW]
[ROW][C]R-squared[/C][C]0.991395636571125[/C][/ROW]
[ROW][C]Adjusted R-squared[/C][C]0.987546316089786[/C][/ROW]
[ROW][C]F-TEST (value)[/C][C]257.550817443581[/C][/ROW]
[ROW][C]F-TEST (DF numerator)[/C][C]17[/C][/ROW]
[ROW][C]F-TEST (DF denominator)[/C][C]38[/C][/ROW]
[ROW][C]p-value[/C][C]0[/C][/ROW]
[ROW][C]Multiple Linear Regression - Residual Statistics[/C][/ROW]
[ROW][C]Residual Standard Deviation[/C][C]0.106935210078802[/C][/ROW]
[ROW][C]Sum Squared Residuals[/C][C]0.434535287874708[/C][/ROW]
[/TABLE]
Source: https://freestatistics.org/blog/index.php?pk=57496&T=3

Globally Unique Identifier (entire table): ba.freestatistics.org/blog/index.php?pk=57496&T=3

As an alternative you can also use a QR Code:  

The GUIDs for individual cells are displayed in the table below:

Multiple Linear Regression - Regression Statistics
Multiple R0.995688523872363
R-squared0.991395636571125
Adjusted R-squared0.987546316089786
F-TEST (value)257.550817443581
F-TEST (DF numerator)17
F-TEST (DF denominator)38
p-value0
Multiple Linear Regression - Residual Statistics
Residual Standard Deviation0.106935210078802
Sum Squared Residuals0.434535287874708


Multiple Linear Regression - Actuals, Interpolation, and Residuals
Time or IndexActualsInterpolationForecastResidualsPrediction Error
13.273.28342111627871-0.0134211162787115
23.213.24548649621774-0.0354864962177405
33.193.177095377437990.0129046225620065
43.163.22418396261496-0.0641839626149633
53.123.18373332248328-0.0637333224832834
63.063.06693383755537-0.0069338375553739
73.013.12953690537079-0.119536905370795
82.982.933673448602960.046326551397042
92.973.04014960448313-0.0701496044831267
103.023.003406634931400.0165933650686040
113.073.00392687403760.0660731259623981
123.183.100005578066530.079994421933472
133.293.3144619999821-0.0244619999821024
143.433.43034686850983-0.000346868509831852
153.613.576182502595060.033817497404935
163.743.81790970173966-0.0779097017396562
173.873.88789847848692-0.0178984784869194
183.883.96523533610167-0.0852353361016675
194.093.965078938267640.124921061732363
204.194.28645246143504-0.0964524614350379
214.24.23681109661865-0.0368110966186523
224.294.227143461318840.0628565386811591
234.374.306230641792310.0637693582076916
244.474.373855348085960.0961446519140386
254.614.543546962828740.0664530371712579
264.654.75145605336126-0.101456053361259
274.694.622734753452470.0672652465475257
284.824.767223424799150.052776575200853
294.864.96882266638035-0.108822666380346
304.874.772211826028590.0977881739714121
315.014.965489219033910.0445107809660947
325.035.06377682965766-0.0337768296576594
335.134.994419763134890.135580236865108
345.185.24759383173793-0.0675938317379329
355.215.054307411908920.155692588091077
365.265.188737478203520.0712625217964756
375.255.27558957973346-0.0255895797334554
385.25.22600542422968-0.0260054242296767
395.165.135514749388770.0244852506112321
405.195.147956263285320.0420437367146778
415.395.251946209650260.138053790349738
425.585.516225486785410.063774513214586
435.765.7606612388975-0.000661238897494783
445.895.813015194171580.076984805828418
455.986.00861953576333-0.0286195357633292
466.026.03185607201183-0.0118560720118302
475.625.90553507226117-0.285535072261167
484.875.11740159564399-0.247401595643986
494.244.24298034117699-0.0029803411769885
504.023.856705157681490.163294842318508
513.743.8784726171257-0.138472617125699
523.453.402726647560910.0472733524390887
533.343.287599322999190.0524006770008114
543.213.27939351352896-0.0693935135289567
553.123.16923369843017-0.0492336984301682
563.043.033082066132760.00691793386723723

\begin{tabular}{lllllllll}
\hline
Multiple Linear Regression - Actuals, Interpolation, and Residuals \tabularnewline
Time or Index & Actuals & InterpolationForecast & ResidualsPrediction Error \tabularnewline
1 & 3.27 & 3.28342111627871 & -0.0134211162787115 \tabularnewline
2 & 3.21 & 3.24548649621774 & -0.0354864962177405 \tabularnewline
3 & 3.19 & 3.17709537743799 & 0.0129046225620065 \tabularnewline
4 & 3.16 & 3.22418396261496 & -0.0641839626149633 \tabularnewline
5 & 3.12 & 3.18373332248328 & -0.0637333224832834 \tabularnewline
6 & 3.06 & 3.06693383755537 & -0.0069338375553739 \tabularnewline
7 & 3.01 & 3.12953690537079 & -0.119536905370795 \tabularnewline
8 & 2.98 & 2.93367344860296 & 0.046326551397042 \tabularnewline
9 & 2.97 & 3.04014960448313 & -0.0701496044831267 \tabularnewline
10 & 3.02 & 3.00340663493140 & 0.0165933650686040 \tabularnewline
11 & 3.07 & 3.0039268740376 & 0.0660731259623981 \tabularnewline
12 & 3.18 & 3.10000557806653 & 0.079994421933472 \tabularnewline
13 & 3.29 & 3.3144619999821 & -0.0244619999821024 \tabularnewline
14 & 3.43 & 3.43034686850983 & -0.000346868509831852 \tabularnewline
15 & 3.61 & 3.57618250259506 & 0.033817497404935 \tabularnewline
16 & 3.74 & 3.81790970173966 & -0.0779097017396562 \tabularnewline
17 & 3.87 & 3.88789847848692 & -0.0178984784869194 \tabularnewline
18 & 3.88 & 3.96523533610167 & -0.0852353361016675 \tabularnewline
19 & 4.09 & 3.96507893826764 & 0.124921061732363 \tabularnewline
20 & 4.19 & 4.28645246143504 & -0.0964524614350379 \tabularnewline
21 & 4.2 & 4.23681109661865 & -0.0368110966186523 \tabularnewline
22 & 4.29 & 4.22714346131884 & 0.0628565386811591 \tabularnewline
23 & 4.37 & 4.30623064179231 & 0.0637693582076916 \tabularnewline
24 & 4.47 & 4.37385534808596 & 0.0961446519140386 \tabularnewline
25 & 4.61 & 4.54354696282874 & 0.0664530371712579 \tabularnewline
26 & 4.65 & 4.75145605336126 & -0.101456053361259 \tabularnewline
27 & 4.69 & 4.62273475345247 & 0.0672652465475257 \tabularnewline
28 & 4.82 & 4.76722342479915 & 0.052776575200853 \tabularnewline
29 & 4.86 & 4.96882266638035 & -0.108822666380346 \tabularnewline
30 & 4.87 & 4.77221182602859 & 0.0977881739714121 \tabularnewline
31 & 5.01 & 4.96548921903391 & 0.0445107809660947 \tabularnewline
32 & 5.03 & 5.06377682965766 & -0.0337768296576594 \tabularnewline
33 & 5.13 & 4.99441976313489 & 0.135580236865108 \tabularnewline
34 & 5.18 & 5.24759383173793 & -0.0675938317379329 \tabularnewline
35 & 5.21 & 5.05430741190892 & 0.155692588091077 \tabularnewline
36 & 5.26 & 5.18873747820352 & 0.0712625217964756 \tabularnewline
37 & 5.25 & 5.27558957973346 & -0.0255895797334554 \tabularnewline
38 & 5.2 & 5.22600542422968 & -0.0260054242296767 \tabularnewline
39 & 5.16 & 5.13551474938877 & 0.0244852506112321 \tabularnewline
40 & 5.19 & 5.14795626328532 & 0.0420437367146778 \tabularnewline
41 & 5.39 & 5.25194620965026 & 0.138053790349738 \tabularnewline
42 & 5.58 & 5.51622548678541 & 0.063774513214586 \tabularnewline
43 & 5.76 & 5.7606612388975 & -0.000661238897494783 \tabularnewline
44 & 5.89 & 5.81301519417158 & 0.076984805828418 \tabularnewline
45 & 5.98 & 6.00861953576333 & -0.0286195357633292 \tabularnewline
46 & 6.02 & 6.03185607201183 & -0.0118560720118302 \tabularnewline
47 & 5.62 & 5.90553507226117 & -0.285535072261167 \tabularnewline
48 & 4.87 & 5.11740159564399 & -0.247401595643986 \tabularnewline
49 & 4.24 & 4.24298034117699 & -0.0029803411769885 \tabularnewline
50 & 4.02 & 3.85670515768149 & 0.163294842318508 \tabularnewline
51 & 3.74 & 3.8784726171257 & -0.138472617125699 \tabularnewline
52 & 3.45 & 3.40272664756091 & 0.0472733524390887 \tabularnewline
53 & 3.34 & 3.28759932299919 & 0.0524006770008114 \tabularnewline
54 & 3.21 & 3.27939351352896 & -0.0693935135289567 \tabularnewline
55 & 3.12 & 3.16923369843017 & -0.0492336984301682 \tabularnewline
56 & 3.04 & 3.03308206613276 & 0.00691793386723723 \tabularnewline
\hline
\end{tabular}
%Source: https://freestatistics.org/blog/index.php?pk=57496&T=4

[TABLE]
[ROW][C]Multiple Linear Regression - Actuals, Interpolation, and Residuals[/C][/ROW]
[ROW][C]Time or Index[/C][C]Actuals[/C][C]InterpolationForecast[/C][C]ResidualsPrediction Error[/C][/ROW]
[ROW][C]1[/C][C]3.27[/C][C]3.28342111627871[/C][C]-0.0134211162787115[/C][/ROW]
[ROW][C]2[/C][C]3.21[/C][C]3.24548649621774[/C][C]-0.0354864962177405[/C][/ROW]
[ROW][C]3[/C][C]3.19[/C][C]3.17709537743799[/C][C]0.0129046225620065[/C][/ROW]
[ROW][C]4[/C][C]3.16[/C][C]3.22418396261496[/C][C]-0.0641839626149633[/C][/ROW]
[ROW][C]5[/C][C]3.12[/C][C]3.18373332248328[/C][C]-0.0637333224832834[/C][/ROW]
[ROW][C]6[/C][C]3.06[/C][C]3.06693383755537[/C][C]-0.0069338375553739[/C][/ROW]
[ROW][C]7[/C][C]3.01[/C][C]3.12953690537079[/C][C]-0.119536905370795[/C][/ROW]
[ROW][C]8[/C][C]2.98[/C][C]2.93367344860296[/C][C]0.046326551397042[/C][/ROW]
[ROW][C]9[/C][C]2.97[/C][C]3.04014960448313[/C][C]-0.0701496044831267[/C][/ROW]
[ROW][C]10[/C][C]3.02[/C][C]3.00340663493140[/C][C]0.0165933650686040[/C][/ROW]
[ROW][C]11[/C][C]3.07[/C][C]3.0039268740376[/C][C]0.0660731259623981[/C][/ROW]
[ROW][C]12[/C][C]3.18[/C][C]3.10000557806653[/C][C]0.079994421933472[/C][/ROW]
[ROW][C]13[/C][C]3.29[/C][C]3.3144619999821[/C][C]-0.0244619999821024[/C][/ROW]
[ROW][C]14[/C][C]3.43[/C][C]3.43034686850983[/C][C]-0.000346868509831852[/C][/ROW]
[ROW][C]15[/C][C]3.61[/C][C]3.57618250259506[/C][C]0.033817497404935[/C][/ROW]
[ROW][C]16[/C][C]3.74[/C][C]3.81790970173966[/C][C]-0.0779097017396562[/C][/ROW]
[ROW][C]17[/C][C]3.87[/C][C]3.88789847848692[/C][C]-0.0178984784869194[/C][/ROW]
[ROW][C]18[/C][C]3.88[/C][C]3.96523533610167[/C][C]-0.0852353361016675[/C][/ROW]
[ROW][C]19[/C][C]4.09[/C][C]3.96507893826764[/C][C]0.124921061732363[/C][/ROW]
[ROW][C]20[/C][C]4.19[/C][C]4.28645246143504[/C][C]-0.0964524614350379[/C][/ROW]
[ROW][C]21[/C][C]4.2[/C][C]4.23681109661865[/C][C]-0.0368110966186523[/C][/ROW]
[ROW][C]22[/C][C]4.29[/C][C]4.22714346131884[/C][C]0.0628565386811591[/C][/ROW]
[ROW][C]23[/C][C]4.37[/C][C]4.30623064179231[/C][C]0.0637693582076916[/C][/ROW]
[ROW][C]24[/C][C]4.47[/C][C]4.37385534808596[/C][C]0.0961446519140386[/C][/ROW]
[ROW][C]25[/C][C]4.61[/C][C]4.54354696282874[/C][C]0.0664530371712579[/C][/ROW]
[ROW][C]26[/C][C]4.65[/C][C]4.75145605336126[/C][C]-0.101456053361259[/C][/ROW]
[ROW][C]27[/C][C]4.69[/C][C]4.62273475345247[/C][C]0.0672652465475257[/C][/ROW]
[ROW][C]28[/C][C]4.82[/C][C]4.76722342479915[/C][C]0.052776575200853[/C][/ROW]
[ROW][C]29[/C][C]4.86[/C][C]4.96882266638035[/C][C]-0.108822666380346[/C][/ROW]
[ROW][C]30[/C][C]4.87[/C][C]4.77221182602859[/C][C]0.0977881739714121[/C][/ROW]
[ROW][C]31[/C][C]5.01[/C][C]4.96548921903391[/C][C]0.0445107809660947[/C][/ROW]
[ROW][C]32[/C][C]5.03[/C][C]5.06377682965766[/C][C]-0.0337768296576594[/C][/ROW]
[ROW][C]33[/C][C]5.13[/C][C]4.99441976313489[/C][C]0.135580236865108[/C][/ROW]
[ROW][C]34[/C][C]5.18[/C][C]5.24759383173793[/C][C]-0.0675938317379329[/C][/ROW]
[ROW][C]35[/C][C]5.21[/C][C]5.05430741190892[/C][C]0.155692588091077[/C][/ROW]
[ROW][C]36[/C][C]5.26[/C][C]5.18873747820352[/C][C]0.0712625217964756[/C][/ROW]
[ROW][C]37[/C][C]5.25[/C][C]5.27558957973346[/C][C]-0.0255895797334554[/C][/ROW]
[ROW][C]38[/C][C]5.2[/C][C]5.22600542422968[/C][C]-0.0260054242296767[/C][/ROW]
[ROW][C]39[/C][C]5.16[/C][C]5.13551474938877[/C][C]0.0244852506112321[/C][/ROW]
[ROW][C]40[/C][C]5.19[/C][C]5.14795626328532[/C][C]0.0420437367146778[/C][/ROW]
[ROW][C]41[/C][C]5.39[/C][C]5.25194620965026[/C][C]0.138053790349738[/C][/ROW]
[ROW][C]42[/C][C]5.58[/C][C]5.51622548678541[/C][C]0.063774513214586[/C][/ROW]
[ROW][C]43[/C][C]5.76[/C][C]5.7606612388975[/C][C]-0.000661238897494783[/C][/ROW]
[ROW][C]44[/C][C]5.89[/C][C]5.81301519417158[/C][C]0.076984805828418[/C][/ROW]
[ROW][C]45[/C][C]5.98[/C][C]6.00861953576333[/C][C]-0.0286195357633292[/C][/ROW]
[ROW][C]46[/C][C]6.02[/C][C]6.03185607201183[/C][C]-0.0118560720118302[/C][/ROW]
[ROW][C]47[/C][C]5.62[/C][C]5.90553507226117[/C][C]-0.285535072261167[/C][/ROW]
[ROW][C]48[/C][C]4.87[/C][C]5.11740159564399[/C][C]-0.247401595643986[/C][/ROW]
[ROW][C]49[/C][C]4.24[/C][C]4.24298034117699[/C][C]-0.0029803411769885[/C][/ROW]
[ROW][C]50[/C][C]4.02[/C][C]3.85670515768149[/C][C]0.163294842318508[/C][/ROW]
[ROW][C]51[/C][C]3.74[/C][C]3.8784726171257[/C][C]-0.138472617125699[/C][/ROW]
[ROW][C]52[/C][C]3.45[/C][C]3.40272664756091[/C][C]0.0472733524390887[/C][/ROW]
[ROW][C]53[/C][C]3.34[/C][C]3.28759932299919[/C][C]0.0524006770008114[/C][/ROW]
[ROW][C]54[/C][C]3.21[/C][C]3.27939351352896[/C][C]-0.0693935135289567[/C][/ROW]
[ROW][C]55[/C][C]3.12[/C][C]3.16923369843017[/C][C]-0.0492336984301682[/C][/ROW]
[ROW][C]56[/C][C]3.04[/C][C]3.03308206613276[/C][C]0.00691793386723723[/C][/ROW]
[/TABLE]
Source: https://freestatistics.org/blog/index.php?pk=57496&T=4

Globally Unique Identifier (entire table): ba.freestatistics.org/blog/index.php?pk=57496&T=4

As an alternative you can also use a QR Code:  

The GUIDs for individual cells are displayed in the table below:

Multiple Linear Regression - Actuals, Interpolation, and Residuals
Time or IndexActualsInterpolationForecastResidualsPrediction Error
13.273.28342111627871-0.0134211162787115
23.213.24548649621774-0.0354864962177405
33.193.177095377437990.0129046225620065
43.163.22418396261496-0.0641839626149633
53.123.18373332248328-0.0637333224832834
63.063.06693383755537-0.0069338375553739
73.013.12953690537079-0.119536905370795
82.982.933673448602960.046326551397042
92.973.04014960448313-0.0701496044831267
103.023.003406634931400.0165933650686040
113.073.00392687403760.0660731259623981
123.183.100005578066530.079994421933472
133.293.3144619999821-0.0244619999821024
143.433.43034686850983-0.000346868509831852
153.613.576182502595060.033817497404935
163.743.81790970173966-0.0779097017396562
173.873.88789847848692-0.0178984784869194
183.883.96523533610167-0.0852353361016675
194.093.965078938267640.124921061732363
204.194.28645246143504-0.0964524614350379
214.24.23681109661865-0.0368110966186523
224.294.227143461318840.0628565386811591
234.374.306230641792310.0637693582076916
244.474.373855348085960.0961446519140386
254.614.543546962828740.0664530371712579
264.654.75145605336126-0.101456053361259
274.694.622734753452470.0672652465475257
284.824.767223424799150.052776575200853
294.864.96882266638035-0.108822666380346
304.874.772211826028590.0977881739714121
315.014.965489219033910.0445107809660947
325.035.06377682965766-0.0337768296576594
335.134.994419763134890.135580236865108
345.185.24759383173793-0.0675938317379329
355.215.054307411908920.155692588091077
365.265.188737478203520.0712625217964756
375.255.27558957973346-0.0255895797334554
385.25.22600542422968-0.0260054242296767
395.165.135514749388770.0244852506112321
405.195.147956263285320.0420437367146778
415.395.251946209650260.138053790349738
425.585.516225486785410.063774513214586
435.765.7606612388975-0.000661238897494783
445.895.813015194171580.076984805828418
455.986.00861953576333-0.0286195357633292
466.026.03185607201183-0.0118560720118302
475.625.90553507226117-0.285535072261167
484.875.11740159564399-0.247401595643986
494.244.24298034117699-0.0029803411769885
504.023.856705157681490.163294842318508
513.743.8784726171257-0.138472617125699
523.453.402726647560910.0472733524390887
533.343.287599322999190.0524006770008114
543.213.27939351352896-0.0693935135289567
553.123.16923369843017-0.0492336984301682
563.043.033082066132760.00691793386723723


Goldfeld-Quandt test for Heteroskedasticity
p-valuesAlternative Hypothesis
breakpoint indexgreater2-sidedless
210.1201505978101170.2403011956202340.879849402189883
220.1236333480765800.2472666961531610.87636665192342
230.09473464161828350.1894692832365670.905265358381717
240.05811291947469280.1162258389493860.941887080525307
250.03199154983266110.06398309966532210.968008450167339
260.1112708419171430.2225416838342850.888729158082857
270.1059714355002020.2119428710004040.894028564499798
280.06742550505989250.1348510101197850.932574494940107
290.07523984894893270.1504796978978650.924760151051067
300.06561684571535560.1312336914307110.934383154284644
310.03950097571106140.07900195142212280.960499024288939
320.02127711236132910.04255422472265820.97872288763867
330.02693379734255850.05386759468511710.973066202657441
340.2047496900225670.4094993800451340.795250309977433
350.3431997015239800.6863994030479610.65680029847602

\begin{tabular}{lllllllll}
\hline
Goldfeld-Quandt test for Heteroskedasticity \tabularnewline
p-values & Alternative Hypothesis \tabularnewline
breakpoint index & greater & 2-sided & less \tabularnewline
21 & 0.120150597810117 & 0.240301195620234 & 0.879849402189883 \tabularnewline
22 & 0.123633348076580 & 0.247266696153161 & 0.87636665192342 \tabularnewline
23 & 0.0947346416182835 & 0.189469283236567 & 0.905265358381717 \tabularnewline
24 & 0.0581129194746928 & 0.116225838949386 & 0.941887080525307 \tabularnewline
25 & 0.0319915498326611 & 0.0639830996653221 & 0.968008450167339 \tabularnewline
26 & 0.111270841917143 & 0.222541683834285 & 0.888729158082857 \tabularnewline
27 & 0.105971435500202 & 0.211942871000404 & 0.894028564499798 \tabularnewline
28 & 0.0674255050598925 & 0.134851010119785 & 0.932574494940107 \tabularnewline
29 & 0.0752398489489327 & 0.150479697897865 & 0.924760151051067 \tabularnewline
30 & 0.0656168457153556 & 0.131233691430711 & 0.934383154284644 \tabularnewline
31 & 0.0395009757110614 & 0.0790019514221228 & 0.960499024288939 \tabularnewline
32 & 0.0212771123613291 & 0.0425542247226582 & 0.97872288763867 \tabularnewline
33 & 0.0269337973425585 & 0.0538675946851171 & 0.973066202657441 \tabularnewline
34 & 0.204749690022567 & 0.409499380045134 & 0.795250309977433 \tabularnewline
35 & 0.343199701523980 & 0.686399403047961 & 0.65680029847602 \tabularnewline
\hline
\end{tabular}
%Source: https://freestatistics.org/blog/index.php?pk=57496&T=5

[TABLE]
[ROW][C]Goldfeld-Quandt test for Heteroskedasticity[/C][/ROW]
[ROW][C]p-values[/C][C]Alternative Hypothesis[/C][/ROW]
[ROW][C]breakpoint index[/C][C]greater[/C][C]2-sided[/C][C]less[/C][/ROW]
[ROW][C]21[/C][C]0.120150597810117[/C][C]0.240301195620234[/C][C]0.879849402189883[/C][/ROW]
[ROW][C]22[/C][C]0.123633348076580[/C][C]0.247266696153161[/C][C]0.87636665192342[/C][/ROW]
[ROW][C]23[/C][C]0.0947346416182835[/C][C]0.189469283236567[/C][C]0.905265358381717[/C][/ROW]
[ROW][C]24[/C][C]0.0581129194746928[/C][C]0.116225838949386[/C][C]0.941887080525307[/C][/ROW]
[ROW][C]25[/C][C]0.0319915498326611[/C][C]0.0639830996653221[/C][C]0.968008450167339[/C][/ROW]
[ROW][C]26[/C][C]0.111270841917143[/C][C]0.222541683834285[/C][C]0.888729158082857[/C][/ROW]
[ROW][C]27[/C][C]0.105971435500202[/C][C]0.211942871000404[/C][C]0.894028564499798[/C][/ROW]
[ROW][C]28[/C][C]0.0674255050598925[/C][C]0.134851010119785[/C][C]0.932574494940107[/C][/ROW]
[ROW][C]29[/C][C]0.0752398489489327[/C][C]0.150479697897865[/C][C]0.924760151051067[/C][/ROW]
[ROW][C]30[/C][C]0.0656168457153556[/C][C]0.131233691430711[/C][C]0.934383154284644[/C][/ROW]
[ROW][C]31[/C][C]0.0395009757110614[/C][C]0.0790019514221228[/C][C]0.960499024288939[/C][/ROW]
[ROW][C]32[/C][C]0.0212771123613291[/C][C]0.0425542247226582[/C][C]0.97872288763867[/C][/ROW]
[ROW][C]33[/C][C]0.0269337973425585[/C][C]0.0538675946851171[/C][C]0.973066202657441[/C][/ROW]
[ROW][C]34[/C][C]0.204749690022567[/C][C]0.409499380045134[/C][C]0.795250309977433[/C][/ROW]
[ROW][C]35[/C][C]0.343199701523980[/C][C]0.686399403047961[/C][C]0.65680029847602[/C][/ROW]
[/TABLE]
Source: https://freestatistics.org/blog/index.php?pk=57496&T=5

Globally Unique Identifier (entire table): ba.freestatistics.org/blog/index.php?pk=57496&T=5

As an alternative you can also use a QR Code:  

The GUIDs for individual cells are displayed in the table below:

Goldfeld-Quandt test for Heteroskedasticity
p-valuesAlternative Hypothesis
breakpoint indexgreater2-sidedless
210.1201505978101170.2403011956202340.879849402189883
220.1236333480765800.2472666961531610.87636665192342
230.09473464161828350.1894692832365670.905265358381717
240.05811291947469280.1162258389493860.941887080525307
250.03199154983266110.06398309966532210.968008450167339
260.1112708419171430.2225416838342850.888729158082857
270.1059714355002020.2119428710004040.894028564499798
280.06742550505989250.1348510101197850.932574494940107
290.07523984894893270.1504796978978650.924760151051067
300.06561684571535560.1312336914307110.934383154284644
310.03950097571106140.07900195142212280.960499024288939
320.02127711236132910.04255422472265820.97872288763867
330.02693379734255850.05386759468511710.973066202657441
340.2047496900225670.4094993800451340.795250309977433
350.3431997015239800.6863994030479610.65680029847602


Meta Analysis of Goldfeld-Quandt test for Heteroskedasticity
Description# significant tests% significant testsOK/NOK
1% type I error level00OK
5% type I error level10.0666666666666667NOK
10% type I error level40.266666666666667NOK

\begin{tabular}{lllllllll}
\hline
Meta Analysis of Goldfeld-Quandt test for Heteroskedasticity \tabularnewline
Description & # significant tests & % significant tests & OK/NOK \tabularnewline
1% type I error level & 0 & 0 & OK \tabularnewline
5% type I error level & 1 & 0.0666666666666667 & NOK \tabularnewline
10% type I error level & 4 & 0.266666666666667 & NOK \tabularnewline
\hline
\end{tabular}
%Source: https://freestatistics.org/blog/index.php?pk=57496&T=6

[TABLE]
[ROW][C]Meta Analysis of Goldfeld-Quandt test for Heteroskedasticity[/C][/ROW]
[ROW][C]Description[/C][C]# significant tests[/C][C]% significant tests[/C][C]OK/NOK[/C][/ROW]
[ROW][C]1% type I error level[/C][C]0[/C][C]0[/C][C]OK[/C][/ROW]
[ROW][C]5% type I error level[/C][C]1[/C][C]0.0666666666666667[/C][C]NOK[/C][/ROW]
[ROW][C]10% type I error level[/C][C]4[/C][C]0.266666666666667[/C][C]NOK[/C][/ROW]
[/TABLE]
Source: https://freestatistics.org/blog/index.php?pk=57496&T=6

Globally Unique Identifier (entire table): ba.freestatistics.org/blog/index.php?pk=57496&T=6

As an alternative you can also use a QR Code:  

The GUIDs for individual cells are displayed in the table below:

Meta Analysis of Goldfeld-Quandt test for Heteroskedasticity
Description# significant tests% significant testsOK/NOK
1% type I error level00OK
5% type I error level10.0666666666666667NOK
10% type I error level40.266666666666667NOK


Parameters (Session):
Parameters (R input):
par1 = 1 ; par2 = Include Monthly Dummies ; par3 = Linear Trend ;
R code (references can be found in the software module):
library(lattice)
library(lmtest)
n25 <- 25 #minimum number of obs. for Goldfeld-Quandt test
par1 <- as.numeric(par1)
x <- t(y)
k <- length(x[1,])
n <- length(x[,1])
x1 <- cbind(x[,par1], x[,1:k!=par1])
mycolnames <- c(colnames(x)[par1], colnames(x)[1:k!=par1])
colnames(x1) <- mycolnames #colnames(x)[par1]
x <- x1
if (par3 == 'First Differences'){
x2 <- array(0, dim=c(n-1,k), dimnames=list(1:(n-1), paste('(1-B)',colnames(x),sep='')))
for (i in 1:n-1) {
for (j in 1:k) {
x2[i,j] <- x[i+1,j] - x[i,j]
}
}
x <- x2
}
if (par2 == 'Include Monthly Dummies'){
x2 <- array(0, dim=c(n,11), dimnames=list(1:n, paste('M', seq(1:11), sep ='')))
for (i in 1:11){
x2[seq(i,n,12),i] <- 1
}
x <- cbind(x, x2)
}
if (par2 == 'Include Quarterly Dummies'){
x2 <- array(0, dim=c(n,3), dimnames=list(1:n, paste('Q', seq(1:3), sep ='')))
for (i in 1:3){
x2[seq(i,n,4),i] <- 1
}
x <- cbind(x, x2)
}
k <- length(x[1,])
if (par3 == 'Linear Trend'){
x <- cbind(x, c(1:n))
colnames(x)[k+1] <- 't'
}
x
k <- length(x[1,])
df <- as.data.frame(x)
(mylm <- lm(df))
(mysum <- summary(mylm))
if (n > n25) {
kp3 <- k + 3
nmkm3 <- n - k - 3
gqarr <- array(NA, dim=c(nmkm3-kp3+1,3))
numgqtests <- 0
numsignificant1 <- 0
numsignificant5 <- 0
numsignificant10 <- 0
for (mypoint in kp3:nmkm3) {
j <- 0
numgqtests <- numgqtests + 1
for (myalt in c('greater', 'two.sided', 'less')) {
j <- j + 1
gqarr[mypoint-kp3+1,j] <- gqtest(mylm, point=mypoint, alternative=myalt)$p.value
}
if (gqarr[mypoint-kp3+1,2] < 0.01) numsignificant1 <- numsignificant1 + 1
if (gqarr[mypoint-kp3+1,2] < 0.05) numsignificant5 <- numsignificant5 + 1
if (gqarr[mypoint-kp3+1,2] < 0.10) numsignificant10 <- numsignificant10 + 1
}
gqarr
}
bitmap(file='test0.png')
plot(x[,1], type='l', main='Actuals and Interpolation', ylab='value of Actuals and Interpolation (dots)', xlab='time or index')
points(x[,1]-mysum$resid)
grid()
dev.off()
bitmap(file='test1.png')
plot(mysum$resid, type='b', pch=19, main='Residuals', ylab='value of Residuals', xlab='time or index')
grid()
dev.off()
bitmap(file='test2.png')
hist(mysum$resid, main='Residual Histogram', xlab='values of Residuals')
grid()
dev.off()
bitmap(file='test3.png')
densityplot(~mysum$resid,col='black',main='Residual Density Plot', xlab='values of Residuals')
dev.off()
bitmap(file='test4.png')
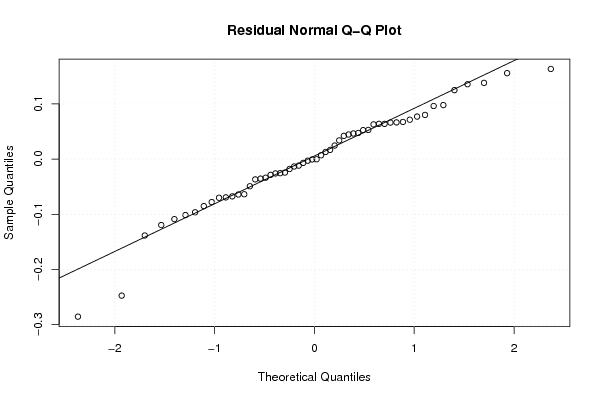
qqnorm(mysum$resid, main='Residual Normal Q-Q Plot')
qqline(mysum$resid)
grid()
dev.off()
(myerror <- as.ts(mysum$resid))
bitmap(file='test5.png')
dum <- cbind(lag(myerror,k=1),myerror)
dum
dum1 <- dum[2:length(myerror),]
dum1
z <- as.data.frame(dum1)
z
plot(z,main=paste('Residual Lag plot, lowess, and regression line'), ylab='values of Residuals', xlab='lagged values of Residuals')
lines(lowess(z))
abline(lm(z))
grid()
dev.off()
bitmap(file='test6.png')
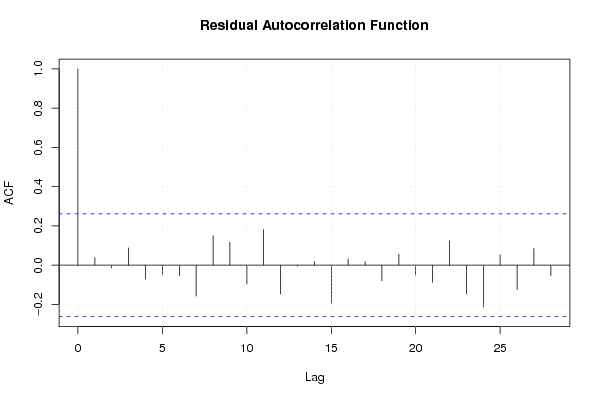
acf(mysum$resid, lag.max=length(mysum$resid)/2, main='Residual Autocorrelation Function')
grid()
dev.off()
bitmap(file='test7.png')
pacf(mysum$resid, lag.max=length(mysum$resid)/2, main='Residual Partial Autocorrelation Function')
grid()
dev.off()
bitmap(file='test8.png')
opar <- par(mfrow = c(2,2), oma = c(0, 0, 1.1, 0))
plot(mylm, las = 1, sub='Residual Diagnostics')
par(opar)
dev.off()
if (n > n25) {
bitmap(file='test9.png')
plot(kp3:nmkm3,gqarr[,2], main='Goldfeld-Quandt test',ylab='2-sided p-value',xlab='breakpoint')
grid()
dev.off()
}
load(file='createtable')
a<-table.start()
a<-table.row.start(a)
a<-table.element(a, 'Multiple Linear Regression - Estimated Regression Equation', 1, TRUE)
a<-table.row.end(a)
myeq <- colnames(x)[1]
myeq <- paste(myeq, '[t] = ', sep='')
for (i in 1:k){
if (mysum$coefficients[i,1] > 0) myeq <- paste(myeq, '+', '')
myeq <- paste(myeq, mysum$coefficients[i,1], sep=' ')
if (rownames(mysum$coefficients)[i] != '(Intercept)') {
myeq <- paste(myeq, rownames(mysum$coefficients)[i], sep='')
if (rownames(mysum$coefficients)[i] != 't') myeq <- paste(myeq, '[t]', sep='')
}
}
myeq <- paste(myeq, ' + e[t]')
a<-table.row.start(a)
a<-table.element(a, myeq)
a<-table.row.end(a)
a<-table.end(a)
table.save(a,file='mytable1.tab')
a<-table.start()
a<-table.row.start(a)
a<-table.element(a,hyperlink('ols1.htm','Multiple Linear Regression - Ordinary Least Squares',''), 6, TRUE)
a<-table.row.end(a)
a<-table.row.start(a)
a<-table.element(a,'Variable',header=TRUE)
a<-table.element(a,'Parameter',header=TRUE)
a<-table.element(a,'S.D.',header=TRUE)
a<-table.element(a,'T-STAT
H0: parameter = 0',header=TRUE)
a<-table.element(a,'2-tail p-value',header=TRUE)
a<-table.element(a,'1-tail p-value',header=TRUE)
a<-table.row.end(a)
for (i in 1:k){
a<-table.row.start(a)
a<-table.element(a,rownames(mysum$coefficients)[i],header=TRUE)
a<-table.element(a,mysum$coefficients[i,1])
a<-table.element(a, round(mysum$coefficients[i,2],6))
a<-table.element(a, round(mysum$coefficients[i,3],4))
a<-table.element(a, round(mysum$coefficients[i,4],6))
a<-table.element(a, round(mysum$coefficients[i,4]/2,6))
a<-table.row.end(a)
}
a<-table.end(a)
table.save(a,file='mytable2.tab')
a<-table.start()
a<-table.row.start(a)
a<-table.element(a, 'Multiple Linear Regression - Regression Statistics', 2, TRUE)
a<-table.row.end(a)
a<-table.row.start(a)
a<-table.element(a, 'Multiple R',1,TRUE)
a<-table.element(a, sqrt(mysum$r.squared))
a<-table.row.end(a)
a<-table.row.start(a)
a<-table.element(a, 'R-squared',1,TRUE)
a<-table.element(a, mysum$r.squared)
a<-table.row.end(a)
a<-table.row.start(a)
a<-table.element(a, 'Adjusted R-squared',1,TRUE)
a<-table.element(a, mysum$adj.r.squared)
a<-table.row.end(a)
a<-table.row.start(a)
a<-table.element(a, 'F-TEST (value)',1,TRUE)
a<-table.element(a, mysum$fstatistic[1])
a<-table.row.end(a)
a<-table.row.start(a)
a<-table.element(a, 'F-TEST (DF numerator)',1,TRUE)
a<-table.element(a, mysum$fstatistic[2])
a<-table.row.end(a)
a<-table.row.start(a)
a<-table.element(a, 'F-TEST (DF denominator)',1,TRUE)
a<-table.element(a, mysum$fstatistic[3])
a<-table.row.end(a)
a<-table.row.start(a)
a<-table.element(a, 'p-value',1,TRUE)
a<-table.element(a, 1-pf(mysum$fstatistic[1],mysum$fstatistic[2],mysum$fstatistic[3]))
a<-table.row.end(a)
a<-table.row.start(a)
a<-table.element(a, 'Multiple Linear Regression - Residual Statistics', 2, TRUE)
a<-table.row.end(a)
a<-table.row.start(a)
a<-table.element(a, 'Residual Standard Deviation',1,TRUE)
a<-table.element(a, mysum$sigma)
a<-table.row.end(a)
a<-table.row.start(a)
a<-table.element(a, 'Sum Squared Residuals',1,TRUE)
a<-table.element(a, sum(myerror*myerror))
a<-table.row.end(a)
a<-table.end(a)
table.save(a,file='mytable3.tab')
a<-table.start()
a<-table.row.start(a)
a<-table.element(a, 'Multiple Linear Regression - Actuals, Interpolation, and Residuals', 4, TRUE)
a<-table.row.end(a)
a<-table.row.start(a)
a<-table.element(a, 'Time or Index', 1, TRUE)
a<-table.element(a, 'Actuals', 1, TRUE)
a<-table.element(a, 'Interpolation
Forecast', 1, TRUE)
a<-table.element(a, 'Residuals
Prediction Error', 1, TRUE)
a<-table.row.end(a)
for (i in 1:n) {
a<-table.row.start(a)
a<-table.element(a,i, 1, TRUE)
a<-table.element(a,x[i])
a<-table.element(a,x[i]-mysum$resid[i])
a<-table.element(a,mysum$resid[i])
a<-table.row.end(a)
}
a<-table.end(a)
table.save(a,file='mytable4.tab')
if (n > n25) {
a<-table.start()
a<-table.row.start(a)
a<-table.element(a,'Goldfeld-Quandt test for Heteroskedasticity',4,TRUE)
a<-table.row.end(a)
a<-table.row.start(a)
a<-table.element(a,'p-values',header=TRUE)
a<-table.element(a,'Alternative Hypothesis',3,header=TRUE)
a<-table.row.end(a)
a<-table.row.start(a)
a<-table.element(a,'breakpoint index',header=TRUE)
a<-table.element(a,'greater',header=TRUE)
a<-table.element(a,'2-sided',header=TRUE)
a<-table.element(a,'less',header=TRUE)
a<-table.row.end(a)
for (mypoint in kp3:nmkm3) {
a<-table.row.start(a)
a<-table.element(a,mypoint,header=TRUE)
a<-table.element(a,gqarr[mypoint-kp3+1,1])
a<-table.element(a,gqarr[mypoint-kp3+1,2])
a<-table.element(a,gqarr[mypoint-kp3+1,3])
a<-table.row.end(a)
}
a<-table.end(a)
table.save(a,file='mytable5.tab')
a<-table.start()
a<-table.row.start(a)
a<-table.element(a,'Meta Analysis of Goldfeld-Quandt test for Heteroskedasticity',4,TRUE)
a<-table.row.end(a)
a<-table.row.start(a)
a<-table.element(a,'Description',header=TRUE)
a<-table.element(a,'# significant tests',header=TRUE)
a<-table.element(a,'% significant tests',header=TRUE)
a<-table.element(a,'OK/NOK',header=TRUE)
a<-table.row.end(a)
a<-table.row.start(a)
a<-table.element(a,'1% type I error level',header=TRUE)
a<-table.element(a,numsignificant1)
a<-table.element(a,numsignificant1/numgqtests)
if (numsignificant1/numgqtests < 0.01) dum <- 'OK' else dum <- 'NOK'
a<-table.element(a,dum)
a<-table.row.end(a)
a<-table.row.start(a)
a<-table.element(a,'5% type I error level',header=TRUE)
a<-table.element(a,numsignificant5)
a<-table.element(a,numsignificant5/numgqtests)
if (numsignificant5/numgqtests < 0.05) dum <- 'OK' else dum <- 'NOK'
a<-table.element(a,dum)
a<-table.row.end(a)
a<-table.row.start(a)
a<-table.element(a,'10% type I error level',header=TRUE)
a<-table.element(a,numsignificant10)
a<-table.element(a,numsignificant10/numgqtests)
if (numsignificant10/numgqtests < 0.1) dum <- 'OK' else dum <- 'NOK'
a<-table.element(a,dum)
a<-table.row.end(a)
a<-table.end(a)
table.save(a,file='mytable6.tab')
}