Free Statistics

of Irreproducible Research!

Author's title

Author*The author of this computation has been verified*
R Software Modulerwasp_multipleregression.wasp
Title produced by softwareMultiple Regression
Date of computationWed, 18 Nov 2009 09:27:25 -0700
Cite this page as followsStatistical Computations at FreeStatistics.org, Office for Research Development and Education, URL https://freestatistics.org/blog/index.php?v=date/2009/Nov/18/t1258561750aret92gsj1yc623.htm/, Retrieved Sun, 05 May 2024 16:18:49 +0000
Statistical Computations at FreeStatistics.org, Office for Research Development and Education, URL https://freestatistics.org/blog/index.php?pk=57515, Retrieved Sun, 05 May 2024 16:18:49 +0000
QR Codes:

Original text written by user:
IsPrivate?No (this computation is public)
User-defined keywords
Estimated Impact167
Family? (F = Feedback message, R = changed R code, M = changed R Module, P = changed Parameters, D = changed Data)
-     [Multiple Regression] [Q1 The Seatbeltlaw] [2007-11-14 19:27:43] [8cd6641b921d30ebe00b648d1481bba0]
- RMPD  [Multiple Regression] [Seatbelt] [2009-11-12 13:54:52] [b98453cac15ba1066b407e146608df68]
-   PD      [Multiple Regression] [ws 7 regressie an...] [2009-11-18 16:27:25] [51d49d3536f6a59f2486a67bf50b2759] [Current]
Feedback Forum

Post a new message
Dataseries X:
1751	9062	1643	1639	1395	1901
1797	8885	1751	1643	1639	1395
1373	9058	1797	1751	1643	1639
1558	9095	1373	1797	1751	1643
1555	9149	1558	1373	1797	1751
2061	9857	1555	1558	1373	1797
2010	9848	2061	1555	1558	1373
2119	10269	2010	2061	1555	1558
1985	10341	2119	2010	2061	1555
1963	9690	1985	2119	2010	2061
2017	10125	1963	1985	2119	2010
1975	9349	2017	1963	1985	2119
1589	9224	1975	2017	1963	1985
1679	9224	1589	1975	2017	1963
1392	9454	1679	1589	1975	2017
1511	9347	1392	1679	1589	1975
1449	9430	1511	1392	1679	1589
1767	9933	1449	1511	1392	1679
1899	10148	1767	1449	1511	1392
2179	10677	1899	1767	1449	1511
2217	10735	2179	1899	1767	1449
2049	9760	2217	2179	1899	1767
2343	10567	2049	2217	2179	1899
2175	9333	2343	2049	2217	2179
1607	9409	2175	2343	2049	2217
1702	9502	1607	2175	2343	2049
1764	9348	1702	1607	2175	2343
1766	9319	1764	1702	1607	2175
1615	9594	1766	1764	1702	1607
1953	10160	1615	1766	1764	1702
2091	10182	1953	1615	1766	1764
2411	10810	2091	1953	1615	1766
2550	11105	2411	2091	1953	1615
2351	9874	2550	2411	2091	1953
2786	10958	2351	2550	2411	2091
2525	9311	2786	2351	2550	2411
2474	9610	2525	2786	2351	2550
2332	9398	2474	2525	2786	2351
1978	9784	2332	2474	2525	2786
1789	9425	1978	2332	2474	2525
1904	9557	1789	1978	2332	2474
1997	10166	1904	1789	1978	2332
2207	10337	1997	1904	1789	1978
2453	10770	2207	1997	1904	1789
1948	11265	2453	2207	1997	1904
1384	10183	1948	2453	2207	1997
1989	10941	1384	1948	2453	2207
2140	9628	1989	1384	1948	2453
2100	9709	2140	1989	1384	1948
2045	9637	2100	2140	1989	1384
2083	9579	2045	2100	2140	1989
2022	9741	2083	2045	2100	2140
1950	9754	2022	2083	2045	2100
1422	10508	1950	2022	2083	2045
1859	10749	1422	1950	2022	2083
2147	11079	1859	1422	1950	2022


Summary of computational transaction
Raw Inputview raw input (R code)
Raw Outputview raw output of R engine
Computing time3 seconds
R Server'Gwilym Jenkins' @ 72.249.127.135

\begin{tabular}{lllllllll}
\hline
Summary of computational transaction \tabularnewline
Raw Input & view raw input (R code)  \tabularnewline
Raw Output & view raw output of R engine  \tabularnewline
Computing time & 3 seconds \tabularnewline
R Server & 'Gwilym Jenkins' @ 72.249.127.135 \tabularnewline
\hline
\end{tabular}
%Source: https://freestatistics.org/blog/index.php?pk=57515&T=0

[TABLE]
[ROW][C]Summary of computational transaction[/C][/ROW]
[ROW][C]Raw Input[/C][C]view raw input (R code) [/C][/ROW]
[ROW][C]Raw Output[/C][C]view raw output of R engine [/C][/ROW]
[ROW][C]Computing time[/C][C]3 seconds[/C][/ROW]
[ROW][C]R Server[/C][C]'Gwilym Jenkins' @ 72.249.127.135[/C][/ROW]
[/TABLE]
Source: https://freestatistics.org/blog/index.php?pk=57515&T=0

Globally Unique Identifier (entire table): ba.freestatistics.org/blog/index.php?pk=57515&T=0

As an alternative you can also use a QR Code:  

The GUIDs for individual cells are displayed in the table below:

Summary of computational transaction
Raw Inputview raw input (R code)
Raw Outputview raw output of R engine
Computing time3 seconds
R Server'Gwilym Jenkins' @ 72.249.127.135


Multiple Linear Regression - Estimated Regression Equation
aanbod[t] = + 903.196828297846 -0.0300536354727465invoer[t] + 0.693384135006776`y(t-1)`[t] + 0.0290846274189062`y(t-2)`[t] -0.319846239397827`Y(t-3)`[t] + 0.257255528253368`Y(t-4)`[t] -231.481323073979M1[t] + 82.690332409393M2[t] -211.948225731399M3[t] -114.242382221827M4[t] -98.9220440105658M5[t] + 23.8776125317967M6[t] + 152.685639602411M7[t] + 275.426064938505M8[t] + 107.969432124962M9[t] -134.804093406645M10[t] + 451.038230443387M11[t] + 1.65970798276155t + e[t]

\begin{tabular}{lllllllll}
\hline
Multiple Linear Regression - Estimated Regression Equation \tabularnewline
aanbod[t] =  +  903.196828297846 -0.0300536354727465invoer[t] +  0.693384135006776`y(t-1)`[t] +  0.0290846274189062`y(t-2)`[t] -0.319846239397827`Y(t-3)`[t] +  0.257255528253368`Y(t-4)`[t] -231.481323073979M1[t] +  82.690332409393M2[t] -211.948225731399M3[t] -114.242382221827M4[t] -98.9220440105658M5[t] +  23.8776125317967M6[t] +  152.685639602411M7[t] +  275.426064938505M8[t] +  107.969432124962M9[t] -134.804093406645M10[t] +  451.038230443387M11[t] +  1.65970798276155t  + e[t] \tabularnewline
\hline
\end{tabular}
%Source: https://freestatistics.org/blog/index.php?pk=57515&T=1

[TABLE]
[ROW][C]Multiple Linear Regression - Estimated Regression Equation[/C][/ROW]
[ROW][C]aanbod[t] =  +  903.196828297846 -0.0300536354727465invoer[t] +  0.693384135006776`y(t-1)`[t] +  0.0290846274189062`y(t-2)`[t] -0.319846239397827`Y(t-3)`[t] +  0.257255528253368`Y(t-4)`[t] -231.481323073979M1[t] +  82.690332409393M2[t] -211.948225731399M3[t] -114.242382221827M4[t] -98.9220440105658M5[t] +  23.8776125317967M6[t] +  152.685639602411M7[t] +  275.426064938505M8[t] +  107.969432124962M9[t] -134.804093406645M10[t] +  451.038230443387M11[t] +  1.65970798276155t  + e[t][/C][/ROW]
[/TABLE]
Source: https://freestatistics.org/blog/index.php?pk=57515&T=1

Globally Unique Identifier (entire table): ba.freestatistics.org/blog/index.php?pk=57515&T=1

As an alternative you can also use a QR Code:  

The GUIDs for individual cells are displayed in the table below:

Multiple Linear Regression - Estimated Regression Equation
aanbod[t] = + 903.196828297846 -0.0300536354727465invoer[t] + 0.693384135006776`y(t-1)`[t] + 0.0290846274189062`y(t-2)`[t] -0.319846239397827`Y(t-3)`[t] + 0.257255528253368`Y(t-4)`[t] -231.481323073979M1[t] + 82.690332409393M2[t] -211.948225731399M3[t] -114.242382221827M4[t] -98.9220440105658M5[t] + 23.8776125317967M6[t] + 152.685639602411M7[t] + 275.426064938505M8[t] + 107.969432124962M9[t] -134.804093406645M10[t] + 451.038230443387M11[t] + 1.65970798276155t + e[t]


Multiple Linear Regression - Ordinary Least Squares
VariableParameterS.D.T-STATH0: parameter = 02-tail p-value1-tail p-value
(Intercept)903.1968282978462534.1656920.35640.7235060.361753
invoer-0.03005363547274650.270351-0.11120.9120710.456035
`y(t-1)`0.6933841350067760.1706144.0640.0002330.000117
`y(t-2)`0.02908462741890620.2016760.14420.8860930.443047
`Y(t-3)`-0.3198462393978270.225218-1.42020.1637120.081856
`Y(t-4)`0.2572555282533680.1831851.40430.1683360.084168
M1-231.481323073979173.995273-1.33040.191320.09566
M282.690332409393183.8613220.44970.6554510.327725
M3-211.948225731399150.850585-1.4050.1681380.084069
M4-114.242382221827175.440654-0.65120.5188530.259426
M5-98.9220440105658163.508639-0.6050.5487780.274389
M623.8776125317967230.5913420.10350.9180710.459036
M7152.685639602411261.0947960.58480.5621450.281073
M8275.426064938505363.8972940.75690.453790.226895
M9107.969432124962435.5760050.24790.8055640.402782
M10-134.804093406645205.967184-0.65450.5167360.258368
M11451.038230443387359.0770041.25610.2167460.108373
t1.659707982761554.588140.36170.7195510.359776

\begin{tabular}{lllllllll}
\hline
Multiple Linear Regression - Ordinary Least Squares \tabularnewline
Variable & Parameter & S.D. & T-STATH0: parameter = 0 & 2-tail p-value & 1-tail p-value \tabularnewline
(Intercept) & 903.196828297846 & 2534.165692 & 0.3564 & 0.723506 & 0.361753 \tabularnewline
invoer & -0.0300536354727465 & 0.270351 & -0.1112 & 0.912071 & 0.456035 \tabularnewline
`y(t-1)` & 0.693384135006776 & 0.170614 & 4.064 & 0.000233 & 0.000117 \tabularnewline
`y(t-2)` & 0.0290846274189062 & 0.201676 & 0.1442 & 0.886093 & 0.443047 \tabularnewline
`Y(t-3)` & -0.319846239397827 & 0.225218 & -1.4202 & 0.163712 & 0.081856 \tabularnewline
`Y(t-4)` & 0.257255528253368 & 0.183185 & 1.4043 & 0.168336 & 0.084168 \tabularnewline
M1 & -231.481323073979 & 173.995273 & -1.3304 & 0.19132 & 0.09566 \tabularnewline
M2 & 82.690332409393 & 183.861322 & 0.4497 & 0.655451 & 0.327725 \tabularnewline
M3 & -211.948225731399 & 150.850585 & -1.405 & 0.168138 & 0.084069 \tabularnewline
M4 & -114.242382221827 & 175.440654 & -0.6512 & 0.518853 & 0.259426 \tabularnewline
M5 & -98.9220440105658 & 163.508639 & -0.605 & 0.548778 & 0.274389 \tabularnewline
M6 & 23.8776125317967 & 230.591342 & 0.1035 & 0.918071 & 0.459036 \tabularnewline
M7 & 152.685639602411 & 261.094796 & 0.5848 & 0.562145 & 0.281073 \tabularnewline
M8 & 275.426064938505 & 363.897294 & 0.7569 & 0.45379 & 0.226895 \tabularnewline
M9 & 107.969432124962 & 435.576005 & 0.2479 & 0.805564 & 0.402782 \tabularnewline
M10 & -134.804093406645 & 205.967184 & -0.6545 & 0.516736 & 0.258368 \tabularnewline
M11 & 451.038230443387 & 359.077004 & 1.2561 & 0.216746 & 0.108373 \tabularnewline
t & 1.65970798276155 & 4.58814 & 0.3617 & 0.719551 & 0.359776 \tabularnewline
\hline
\end{tabular}
%Source: https://freestatistics.org/blog/index.php?pk=57515&T=2

[TABLE]
[ROW][C]Multiple Linear Regression - Ordinary Least Squares[/C][/ROW]
[ROW][C]Variable[/C][C]Parameter[/C][C]S.D.[/C][C]T-STATH0: parameter = 0[/C][C]2-tail p-value[/C][C]1-tail p-value[/C][/ROW]
[ROW][C](Intercept)[/C][C]903.196828297846[/C][C]2534.165692[/C][C]0.3564[/C][C]0.723506[/C][C]0.361753[/C][/ROW]
[ROW][C]invoer[/C][C]-0.0300536354727465[/C][C]0.270351[/C][C]-0.1112[/C][C]0.912071[/C][C]0.456035[/C][/ROW]
[ROW][C]`y(t-1)`[/C][C]0.693384135006776[/C][C]0.170614[/C][C]4.064[/C][C]0.000233[/C][C]0.000117[/C][/ROW]
[ROW][C]`y(t-2)`[/C][C]0.0290846274189062[/C][C]0.201676[/C][C]0.1442[/C][C]0.886093[/C][C]0.443047[/C][/ROW]
[ROW][C]`Y(t-3)`[/C][C]-0.319846239397827[/C][C]0.225218[/C][C]-1.4202[/C][C]0.163712[/C][C]0.081856[/C][/ROW]
[ROW][C]`Y(t-4)`[/C][C]0.257255528253368[/C][C]0.183185[/C][C]1.4043[/C][C]0.168336[/C][C]0.084168[/C][/ROW]
[ROW][C]M1[/C][C]-231.481323073979[/C][C]173.995273[/C][C]-1.3304[/C][C]0.19132[/C][C]0.09566[/C][/ROW]
[ROW][C]M2[/C][C]82.690332409393[/C][C]183.861322[/C][C]0.4497[/C][C]0.655451[/C][C]0.327725[/C][/ROW]
[ROW][C]M3[/C][C]-211.948225731399[/C][C]150.850585[/C][C]-1.405[/C][C]0.168138[/C][C]0.084069[/C][/ROW]
[ROW][C]M4[/C][C]-114.242382221827[/C][C]175.440654[/C][C]-0.6512[/C][C]0.518853[/C][C]0.259426[/C][/ROW]
[ROW][C]M5[/C][C]-98.9220440105658[/C][C]163.508639[/C][C]-0.605[/C][C]0.548778[/C][C]0.274389[/C][/ROW]
[ROW][C]M6[/C][C]23.8776125317967[/C][C]230.591342[/C][C]0.1035[/C][C]0.918071[/C][C]0.459036[/C][/ROW]
[ROW][C]M7[/C][C]152.685639602411[/C][C]261.094796[/C][C]0.5848[/C][C]0.562145[/C][C]0.281073[/C][/ROW]
[ROW][C]M8[/C][C]275.426064938505[/C][C]363.897294[/C][C]0.7569[/C][C]0.45379[/C][C]0.226895[/C][/ROW]
[ROW][C]M9[/C][C]107.969432124962[/C][C]435.576005[/C][C]0.2479[/C][C]0.805564[/C][C]0.402782[/C][/ROW]
[ROW][C]M10[/C][C]-134.804093406645[/C][C]205.967184[/C][C]-0.6545[/C][C]0.516736[/C][C]0.258368[/C][/ROW]
[ROW][C]M11[/C][C]451.038230443387[/C][C]359.077004[/C][C]1.2561[/C][C]0.216746[/C][C]0.108373[/C][/ROW]
[ROW][C]t[/C][C]1.65970798276155[/C][C]4.58814[/C][C]0.3617[/C][C]0.719551[/C][C]0.359776[/C][/ROW]
[/TABLE]
Source: https://freestatistics.org/blog/index.php?pk=57515&T=2

Globally Unique Identifier (entire table): ba.freestatistics.org/blog/index.php?pk=57515&T=2

As an alternative you can also use a QR Code:  

The GUIDs for individual cells are displayed in the table below:

Multiple Linear Regression - Ordinary Least Squares
VariableParameterS.D.T-STATH0: parameter = 02-tail p-value1-tail p-value
(Intercept)903.1968282978462534.1656920.35640.7235060.361753
invoer-0.03005363547274650.270351-0.11120.9120710.456035
`y(t-1)`0.6933841350067760.1706144.0640.0002330.000117
`y(t-2)`0.02908462741890620.2016760.14420.8860930.443047
`Y(t-3)`-0.3198462393978270.225218-1.42020.1637120.081856
`Y(t-4)`0.2572555282533680.1831851.40430.1683360.084168
M1-231.481323073979173.995273-1.33040.191320.09566
M282.690332409393183.8613220.44970.6554510.327725
M3-211.948225731399150.850585-1.4050.1681380.084069
M4-114.242382221827175.440654-0.65120.5188530.259426
M5-98.9220440105658163.508639-0.6050.5487780.274389
M623.8776125317967230.5913420.10350.9180710.459036
M7152.685639602411261.0947960.58480.5621450.281073
M8275.426064938505363.8972940.75690.453790.226895
M9107.969432124962435.5760050.24790.8055640.402782
M10-134.804093406645205.967184-0.65450.5167360.258368
M11451.038230443387359.0770041.25610.2167460.108373
t1.659707982761554.588140.36170.7195510.359776


Multiple Linear Regression - Regression Statistics
Multiple R0.846111679499226
R-squared0.715904974185
Adjusted R-squared0.588809831057237
F-TEST (value)5.63282716055745
F-TEST (DF numerator)17
F-TEST (DF denominator)38
p-value4.80906334554554e-06
Multiple Linear Regression - Residual Statistics
Residual Standard Deviation207.083515112569
Sum Squared Residuals1629576.12479236

\begin{tabular}{lllllllll}
\hline
Multiple Linear Regression - Regression Statistics \tabularnewline
Multiple R & 0.846111679499226 \tabularnewline
R-squared & 0.715904974185 \tabularnewline
Adjusted R-squared & 0.588809831057237 \tabularnewline
F-TEST (value) & 5.63282716055745 \tabularnewline
F-TEST (DF numerator) & 17 \tabularnewline
F-TEST (DF denominator) & 38 \tabularnewline
p-value & 4.80906334554554e-06 \tabularnewline
Multiple Linear Regression - Residual Statistics \tabularnewline
Residual Standard Deviation & 207.083515112569 \tabularnewline
Sum Squared Residuals & 1629576.12479236 \tabularnewline
\hline
\end{tabular}
%Source: https://freestatistics.org/blog/index.php?pk=57515&T=3

[TABLE]
[ROW][C]Multiple Linear Regression - Regression Statistics[/C][/ROW]
[ROW][C]Multiple R[/C][C]0.846111679499226[/C][/ROW]
[ROW][C]R-squared[/C][C]0.715904974185[/C][/ROW]
[ROW][C]Adjusted R-squared[/C][C]0.588809831057237[/C][/ROW]
[ROW][C]F-TEST (value)[/C][C]5.63282716055745[/C][/ROW]
[ROW][C]F-TEST (DF numerator)[/C][C]17[/C][/ROW]
[ROW][C]F-TEST (DF denominator)[/C][C]38[/C][/ROW]
[ROW][C]p-value[/C][C]4.80906334554554e-06[/C][/ROW]
[ROW][C]Multiple Linear Regression - Residual Statistics[/C][/ROW]
[ROW][C]Residual Standard Deviation[/C][C]207.083515112569[/C][/ROW]
[ROW][C]Sum Squared Residuals[/C][C]1629576.12479236[/C][/ROW]
[/TABLE]
Source: https://freestatistics.org/blog/index.php?pk=57515&T=3

Globally Unique Identifier (entire table): ba.freestatistics.org/blog/index.php?pk=57515&T=3

As an alternative you can also use a QR Code:  

The GUIDs for individual cells are displayed in the table below:

Multiple Linear Regression - Regression Statistics
Multiple R0.846111679499226
R-squared0.715904974185
Adjusted R-squared0.588809831057237
F-TEST (value)5.63282716055745
F-TEST (DF numerator)17
F-TEST (DF denominator)38
p-value4.80906334554554e-06
Multiple Linear Regression - Residual Statistics
Residual Standard Deviation207.083515112569
Sum Squared Residuals1629576.12479236


Multiple Linear Regression - Actuals, Interpolation, and Residuals
Time or IndexActualsInterpolationForecastResidualsPrediction Error
117511630.786261958120.213738042000
217971818.72516428395-21.7251642839474
313731617.07480909692-244.074809096916
415581389.15702395320168.842976046798
515551533.5290268214021.4709731786024
620611787.45948090363273.540519096372
720102100.71491883940-90.7149188394047
821192240.36851365792-121.368513657921
919851983.889318070421.11068192958421
1019631819.08062301757143.919376982426
1120172326.37426034016-309.374260340155
1219752008.02048915246-33.0204891524576
1315891726.96839118647-137.968391186471
1416791751.00060563934-72.000605639338
1513921529.61266586988-137.612665869879
1615111548.46624229947-37.4662422994723
1714491509.03046529423-60.0304652942333
1817671693.7929737189773.207026281025
1918991924.59804608084-25.5980460808352
2021792184.31929827953-5.31929827952983
2122172097.10504433230119.894955667696
2220491959.3733685610089.6266314390043
2323432351.63958042612-8.63958042611544
2421752198.1933532383-23.193353238301
2516071921.65988592364-314.659885923638
2617021698.714132071053.28586792894569
2717641589.08225975286174.917740247143
2817661873.52595788052-107.525957880516
2916151708.92473669881-93.924736698813
3019531716.33971675658236.660283243418
3120912091.42848099451-0.428480994506065
3224112351.2838391405859.71616085942
3325502255.56407994859294.435920051408
3423512199.94735071943151.052649280573
3527862554.08102833630231.918971663697
3625252487.8982431356637.1017568643439
3724742180.17706479593293.822935204071
3823322269.0991560801362.9008439198704
3919782059.96176273334-81.961762733341
4017891869.69703380967-80.6970338096668
4119041773.66257455228130.337425447716
4219972030.75673975296-33.7567397529635
4322072193.297242093813.7027579061983
4424532367.596077583785.4039224162981
4519482363.44155764869-415.441557648688
4613841768.59865770200-384.598657702003
4719891902.9051308974386.0948691025735
4821402120.8879144735919.1120855264150
4921002061.4083961359638.5916038640392
5020452017.4609419255327.5390580744694
5120831794.26850254701288.731497452993
5220221965.1537420571456.8462579428565
5319501947.853196633272.14680336672787
5414221971.65108886785-549.651088867852
5518591755.96131199145103.038688008548
5621472165.43227133827-18.4322713382674

\begin{tabular}{lllllllll}
\hline
Multiple Linear Regression - Actuals, Interpolation, and Residuals \tabularnewline
Time or Index & Actuals & InterpolationForecast & ResidualsPrediction Error \tabularnewline
1 & 1751 & 1630.786261958 & 120.213738042000 \tabularnewline
2 & 1797 & 1818.72516428395 & -21.7251642839474 \tabularnewline
3 & 1373 & 1617.07480909692 & -244.074809096916 \tabularnewline
4 & 1558 & 1389.15702395320 & 168.842976046798 \tabularnewline
5 & 1555 & 1533.52902682140 & 21.4709731786024 \tabularnewline
6 & 2061 & 1787.45948090363 & 273.540519096372 \tabularnewline
7 & 2010 & 2100.71491883940 & -90.7149188394047 \tabularnewline
8 & 2119 & 2240.36851365792 & -121.368513657921 \tabularnewline
9 & 1985 & 1983.88931807042 & 1.11068192958421 \tabularnewline
10 & 1963 & 1819.08062301757 & 143.919376982426 \tabularnewline
11 & 2017 & 2326.37426034016 & -309.374260340155 \tabularnewline
12 & 1975 & 2008.02048915246 & -33.0204891524576 \tabularnewline
13 & 1589 & 1726.96839118647 & -137.968391186471 \tabularnewline
14 & 1679 & 1751.00060563934 & -72.000605639338 \tabularnewline
15 & 1392 & 1529.61266586988 & -137.612665869879 \tabularnewline
16 & 1511 & 1548.46624229947 & -37.4662422994723 \tabularnewline
17 & 1449 & 1509.03046529423 & -60.0304652942333 \tabularnewline
18 & 1767 & 1693.79297371897 & 73.207026281025 \tabularnewline
19 & 1899 & 1924.59804608084 & -25.5980460808352 \tabularnewline
20 & 2179 & 2184.31929827953 & -5.31929827952983 \tabularnewline
21 & 2217 & 2097.10504433230 & 119.894955667696 \tabularnewline
22 & 2049 & 1959.37336856100 & 89.6266314390043 \tabularnewline
23 & 2343 & 2351.63958042612 & -8.63958042611544 \tabularnewline
24 & 2175 & 2198.1933532383 & -23.193353238301 \tabularnewline
25 & 1607 & 1921.65988592364 & -314.659885923638 \tabularnewline
26 & 1702 & 1698.71413207105 & 3.28586792894569 \tabularnewline
27 & 1764 & 1589.08225975286 & 174.917740247143 \tabularnewline
28 & 1766 & 1873.52595788052 & -107.525957880516 \tabularnewline
29 & 1615 & 1708.92473669881 & -93.924736698813 \tabularnewline
30 & 1953 & 1716.33971675658 & 236.660283243418 \tabularnewline
31 & 2091 & 2091.42848099451 & -0.428480994506065 \tabularnewline
32 & 2411 & 2351.28383914058 & 59.71616085942 \tabularnewline
33 & 2550 & 2255.56407994859 & 294.435920051408 \tabularnewline
34 & 2351 & 2199.94735071943 & 151.052649280573 \tabularnewline
35 & 2786 & 2554.08102833630 & 231.918971663697 \tabularnewline
36 & 2525 & 2487.89824313566 & 37.1017568643439 \tabularnewline
37 & 2474 & 2180.17706479593 & 293.822935204071 \tabularnewline
38 & 2332 & 2269.09915608013 & 62.9008439198704 \tabularnewline
39 & 1978 & 2059.96176273334 & -81.961762733341 \tabularnewline
40 & 1789 & 1869.69703380967 & -80.6970338096668 \tabularnewline
41 & 1904 & 1773.66257455228 & 130.337425447716 \tabularnewline
42 & 1997 & 2030.75673975296 & -33.7567397529635 \tabularnewline
43 & 2207 & 2193.2972420938 & 13.7027579061983 \tabularnewline
44 & 2453 & 2367.5960775837 & 85.4039224162981 \tabularnewline
45 & 1948 & 2363.44155764869 & -415.441557648688 \tabularnewline
46 & 1384 & 1768.59865770200 & -384.598657702003 \tabularnewline
47 & 1989 & 1902.90513089743 & 86.0948691025735 \tabularnewline
48 & 2140 & 2120.88791447359 & 19.1120855264150 \tabularnewline
49 & 2100 & 2061.40839613596 & 38.5916038640392 \tabularnewline
50 & 2045 & 2017.46094192553 & 27.5390580744694 \tabularnewline
51 & 2083 & 1794.26850254701 & 288.731497452993 \tabularnewline
52 & 2022 & 1965.15374205714 & 56.8462579428565 \tabularnewline
53 & 1950 & 1947.85319663327 & 2.14680336672787 \tabularnewline
54 & 1422 & 1971.65108886785 & -549.651088867852 \tabularnewline
55 & 1859 & 1755.96131199145 & 103.038688008548 \tabularnewline
56 & 2147 & 2165.43227133827 & -18.4322713382674 \tabularnewline
\hline
\end{tabular}
%Source: https://freestatistics.org/blog/index.php?pk=57515&T=4

[TABLE]
[ROW][C]Multiple Linear Regression - Actuals, Interpolation, and Residuals[/C][/ROW]
[ROW][C]Time or Index[/C][C]Actuals[/C][C]InterpolationForecast[/C][C]ResidualsPrediction Error[/C][/ROW]
[ROW][C]1[/C][C]1751[/C][C]1630.786261958[/C][C]120.213738042000[/C][/ROW]
[ROW][C]2[/C][C]1797[/C][C]1818.72516428395[/C][C]-21.7251642839474[/C][/ROW]
[ROW][C]3[/C][C]1373[/C][C]1617.07480909692[/C][C]-244.074809096916[/C][/ROW]
[ROW][C]4[/C][C]1558[/C][C]1389.15702395320[/C][C]168.842976046798[/C][/ROW]
[ROW][C]5[/C][C]1555[/C][C]1533.52902682140[/C][C]21.4709731786024[/C][/ROW]
[ROW][C]6[/C][C]2061[/C][C]1787.45948090363[/C][C]273.540519096372[/C][/ROW]
[ROW][C]7[/C][C]2010[/C][C]2100.71491883940[/C][C]-90.7149188394047[/C][/ROW]
[ROW][C]8[/C][C]2119[/C][C]2240.36851365792[/C][C]-121.368513657921[/C][/ROW]
[ROW][C]9[/C][C]1985[/C][C]1983.88931807042[/C][C]1.11068192958421[/C][/ROW]
[ROW][C]10[/C][C]1963[/C][C]1819.08062301757[/C][C]143.919376982426[/C][/ROW]
[ROW][C]11[/C][C]2017[/C][C]2326.37426034016[/C][C]-309.374260340155[/C][/ROW]
[ROW][C]12[/C][C]1975[/C][C]2008.02048915246[/C][C]-33.0204891524576[/C][/ROW]
[ROW][C]13[/C][C]1589[/C][C]1726.96839118647[/C][C]-137.968391186471[/C][/ROW]
[ROW][C]14[/C][C]1679[/C][C]1751.00060563934[/C][C]-72.000605639338[/C][/ROW]
[ROW][C]15[/C][C]1392[/C][C]1529.61266586988[/C][C]-137.612665869879[/C][/ROW]
[ROW][C]16[/C][C]1511[/C][C]1548.46624229947[/C][C]-37.4662422994723[/C][/ROW]
[ROW][C]17[/C][C]1449[/C][C]1509.03046529423[/C][C]-60.0304652942333[/C][/ROW]
[ROW][C]18[/C][C]1767[/C][C]1693.79297371897[/C][C]73.207026281025[/C][/ROW]
[ROW][C]19[/C][C]1899[/C][C]1924.59804608084[/C][C]-25.5980460808352[/C][/ROW]
[ROW][C]20[/C][C]2179[/C][C]2184.31929827953[/C][C]-5.31929827952983[/C][/ROW]
[ROW][C]21[/C][C]2217[/C][C]2097.10504433230[/C][C]119.894955667696[/C][/ROW]
[ROW][C]22[/C][C]2049[/C][C]1959.37336856100[/C][C]89.6266314390043[/C][/ROW]
[ROW][C]23[/C][C]2343[/C][C]2351.63958042612[/C][C]-8.63958042611544[/C][/ROW]
[ROW][C]24[/C][C]2175[/C][C]2198.1933532383[/C][C]-23.193353238301[/C][/ROW]
[ROW][C]25[/C][C]1607[/C][C]1921.65988592364[/C][C]-314.659885923638[/C][/ROW]
[ROW][C]26[/C][C]1702[/C][C]1698.71413207105[/C][C]3.28586792894569[/C][/ROW]
[ROW][C]27[/C][C]1764[/C][C]1589.08225975286[/C][C]174.917740247143[/C][/ROW]
[ROW][C]28[/C][C]1766[/C][C]1873.52595788052[/C][C]-107.525957880516[/C][/ROW]
[ROW][C]29[/C][C]1615[/C][C]1708.92473669881[/C][C]-93.924736698813[/C][/ROW]
[ROW][C]30[/C][C]1953[/C][C]1716.33971675658[/C][C]236.660283243418[/C][/ROW]
[ROW][C]31[/C][C]2091[/C][C]2091.42848099451[/C][C]-0.428480994506065[/C][/ROW]
[ROW][C]32[/C][C]2411[/C][C]2351.28383914058[/C][C]59.71616085942[/C][/ROW]
[ROW][C]33[/C][C]2550[/C][C]2255.56407994859[/C][C]294.435920051408[/C][/ROW]
[ROW][C]34[/C][C]2351[/C][C]2199.94735071943[/C][C]151.052649280573[/C][/ROW]
[ROW][C]35[/C][C]2786[/C][C]2554.08102833630[/C][C]231.918971663697[/C][/ROW]
[ROW][C]36[/C][C]2525[/C][C]2487.89824313566[/C][C]37.1017568643439[/C][/ROW]
[ROW][C]37[/C][C]2474[/C][C]2180.17706479593[/C][C]293.822935204071[/C][/ROW]
[ROW][C]38[/C][C]2332[/C][C]2269.09915608013[/C][C]62.9008439198704[/C][/ROW]
[ROW][C]39[/C][C]1978[/C][C]2059.96176273334[/C][C]-81.961762733341[/C][/ROW]
[ROW][C]40[/C][C]1789[/C][C]1869.69703380967[/C][C]-80.6970338096668[/C][/ROW]
[ROW][C]41[/C][C]1904[/C][C]1773.66257455228[/C][C]130.337425447716[/C][/ROW]
[ROW][C]42[/C][C]1997[/C][C]2030.75673975296[/C][C]-33.7567397529635[/C][/ROW]
[ROW][C]43[/C][C]2207[/C][C]2193.2972420938[/C][C]13.7027579061983[/C][/ROW]
[ROW][C]44[/C][C]2453[/C][C]2367.5960775837[/C][C]85.4039224162981[/C][/ROW]
[ROW][C]45[/C][C]1948[/C][C]2363.44155764869[/C][C]-415.441557648688[/C][/ROW]
[ROW][C]46[/C][C]1384[/C][C]1768.59865770200[/C][C]-384.598657702003[/C][/ROW]
[ROW][C]47[/C][C]1989[/C][C]1902.90513089743[/C][C]86.0948691025735[/C][/ROW]
[ROW][C]48[/C][C]2140[/C][C]2120.88791447359[/C][C]19.1120855264150[/C][/ROW]
[ROW][C]49[/C][C]2100[/C][C]2061.40839613596[/C][C]38.5916038640392[/C][/ROW]
[ROW][C]50[/C][C]2045[/C][C]2017.46094192553[/C][C]27.5390580744694[/C][/ROW]
[ROW][C]51[/C][C]2083[/C][C]1794.26850254701[/C][C]288.731497452993[/C][/ROW]
[ROW][C]52[/C][C]2022[/C][C]1965.15374205714[/C][C]56.8462579428565[/C][/ROW]
[ROW][C]53[/C][C]1950[/C][C]1947.85319663327[/C][C]2.14680336672787[/C][/ROW]
[ROW][C]54[/C][C]1422[/C][C]1971.65108886785[/C][C]-549.651088867852[/C][/ROW]
[ROW][C]55[/C][C]1859[/C][C]1755.96131199145[/C][C]103.038688008548[/C][/ROW]
[ROW][C]56[/C][C]2147[/C][C]2165.43227133827[/C][C]-18.4322713382674[/C][/ROW]
[/TABLE]
Source: https://freestatistics.org/blog/index.php?pk=57515&T=4

Globally Unique Identifier (entire table): ba.freestatistics.org/blog/index.php?pk=57515&T=4

As an alternative you can also use a QR Code:  

The GUIDs for individual cells are displayed in the table below:

Multiple Linear Regression - Actuals, Interpolation, and Residuals
Time or IndexActualsInterpolationForecastResidualsPrediction Error
117511630.786261958120.213738042000
217971818.72516428395-21.7251642839474
313731617.07480909692-244.074809096916
415581389.15702395320168.842976046798
515551533.5290268214021.4709731786024
620611787.45948090363273.540519096372
720102100.71491883940-90.7149188394047
821192240.36851365792-121.368513657921
919851983.889318070421.11068192958421
1019631819.08062301757143.919376982426
1120172326.37426034016-309.374260340155
1219752008.02048915246-33.0204891524576
1315891726.96839118647-137.968391186471
1416791751.00060563934-72.000605639338
1513921529.61266586988-137.612665869879
1615111548.46624229947-37.4662422994723
1714491509.03046529423-60.0304652942333
1817671693.7929737189773.207026281025
1918991924.59804608084-25.5980460808352
2021792184.31929827953-5.31929827952983
2122172097.10504433230119.894955667696
2220491959.3733685610089.6266314390043
2323432351.63958042612-8.63958042611544
2421752198.1933532383-23.193353238301
2516071921.65988592364-314.659885923638
2617021698.714132071053.28586792894569
2717641589.08225975286174.917740247143
2817661873.52595788052-107.525957880516
2916151708.92473669881-93.924736698813
3019531716.33971675658236.660283243418
3120912091.42848099451-0.428480994506065
3224112351.2838391405859.71616085942
3325502255.56407994859294.435920051408
3423512199.94735071943151.052649280573
3527862554.08102833630231.918971663697
3625252487.8982431356637.1017568643439
3724742180.17706479593293.822935204071
3823322269.0991560801362.9008439198704
3919782059.96176273334-81.961762733341
4017891869.69703380967-80.6970338096668
4119041773.66257455228130.337425447716
4219972030.75673975296-33.7567397529635
4322072193.297242093813.7027579061983
4424532367.596077583785.4039224162981
4519482363.44155764869-415.441557648688
4613841768.59865770200-384.598657702003
4719891902.9051308974386.0948691025735
4821402120.8879144735919.1120855264150
4921002061.4083961359638.5916038640392
5020452017.4609419255327.5390580744694
5120831794.26850254701288.731497452993
5220221965.1537420571456.8462579428565
5319501947.853196633272.14680336672787
5414221971.65108886785-549.651088867852
5518591755.96131199145103.038688008548
5621472165.43227133827-18.4322713382674


Goldfeld-Quandt test for Heteroskedasticity
p-valuesAlternative Hypothesis
breakpoint indexgreater2-sidedless
210.007351915274315750.01470383054863150.992648084725684
220.01661009528953880.03322019057907750.983389904710461
230.008320313888689480.01664062777737900.99167968611131
240.02247558294777810.04495116589555610.977524417052222
250.02447278015896870.04894556031793740.975527219841031
260.01224966237480820.02449932474961630.987750337625192
270.08148298444551150.1629659688910230.918517015554489
280.04645127070921530.09290254141843050.953548729290785
290.05035638282846950.1007127656569390.94964361717153
300.02871427625296190.05742855250592390.971285723747038
310.1254544838658770.2509089677317550.874545516134122
320.07889695306403630.1577939061280730.921103046935964
330.05955658631313080.1191131726262620.94044341368687
340.04924529498715430.09849058997430860.950754705012846
350.06572701992655940.1314540398531190.93427298007344

\begin{tabular}{lllllllll}
\hline
Goldfeld-Quandt test for Heteroskedasticity \tabularnewline
p-values & Alternative Hypothesis \tabularnewline
breakpoint index & greater & 2-sided & less \tabularnewline
21 & 0.00735191527431575 & 0.0147038305486315 & 0.992648084725684 \tabularnewline
22 & 0.0166100952895388 & 0.0332201905790775 & 0.983389904710461 \tabularnewline
23 & 0.00832031388868948 & 0.0166406277773790 & 0.99167968611131 \tabularnewline
24 & 0.0224755829477781 & 0.0449511658955561 & 0.977524417052222 \tabularnewline
25 & 0.0244727801589687 & 0.0489455603179374 & 0.975527219841031 \tabularnewline
26 & 0.0122496623748082 & 0.0244993247496163 & 0.987750337625192 \tabularnewline
27 & 0.0814829844455115 & 0.162965968891023 & 0.918517015554489 \tabularnewline
28 & 0.0464512707092153 & 0.0929025414184305 & 0.953548729290785 \tabularnewline
29 & 0.0503563828284695 & 0.100712765656939 & 0.94964361717153 \tabularnewline
30 & 0.0287142762529619 & 0.0574285525059239 & 0.971285723747038 \tabularnewline
31 & 0.125454483865877 & 0.250908967731755 & 0.874545516134122 \tabularnewline
32 & 0.0788969530640363 & 0.157793906128073 & 0.921103046935964 \tabularnewline
33 & 0.0595565863131308 & 0.119113172626262 & 0.94044341368687 \tabularnewline
34 & 0.0492452949871543 & 0.0984905899743086 & 0.950754705012846 \tabularnewline
35 & 0.0657270199265594 & 0.131454039853119 & 0.93427298007344 \tabularnewline
\hline
\end{tabular}
%Source: https://freestatistics.org/blog/index.php?pk=57515&T=5

[TABLE]
[ROW][C]Goldfeld-Quandt test for Heteroskedasticity[/C][/ROW]
[ROW][C]p-values[/C][C]Alternative Hypothesis[/C][/ROW]
[ROW][C]breakpoint index[/C][C]greater[/C][C]2-sided[/C][C]less[/C][/ROW]
[ROW][C]21[/C][C]0.00735191527431575[/C][C]0.0147038305486315[/C][C]0.992648084725684[/C][/ROW]
[ROW][C]22[/C][C]0.0166100952895388[/C][C]0.0332201905790775[/C][C]0.983389904710461[/C][/ROW]
[ROW][C]23[/C][C]0.00832031388868948[/C][C]0.0166406277773790[/C][C]0.99167968611131[/C][/ROW]
[ROW][C]24[/C][C]0.0224755829477781[/C][C]0.0449511658955561[/C][C]0.977524417052222[/C][/ROW]
[ROW][C]25[/C][C]0.0244727801589687[/C][C]0.0489455603179374[/C][C]0.975527219841031[/C][/ROW]
[ROW][C]26[/C][C]0.0122496623748082[/C][C]0.0244993247496163[/C][C]0.987750337625192[/C][/ROW]
[ROW][C]27[/C][C]0.0814829844455115[/C][C]0.162965968891023[/C][C]0.918517015554489[/C][/ROW]
[ROW][C]28[/C][C]0.0464512707092153[/C][C]0.0929025414184305[/C][C]0.953548729290785[/C][/ROW]
[ROW][C]29[/C][C]0.0503563828284695[/C][C]0.100712765656939[/C][C]0.94964361717153[/C][/ROW]
[ROW][C]30[/C][C]0.0287142762529619[/C][C]0.0574285525059239[/C][C]0.971285723747038[/C][/ROW]
[ROW][C]31[/C][C]0.125454483865877[/C][C]0.250908967731755[/C][C]0.874545516134122[/C][/ROW]
[ROW][C]32[/C][C]0.0788969530640363[/C][C]0.157793906128073[/C][C]0.921103046935964[/C][/ROW]
[ROW][C]33[/C][C]0.0595565863131308[/C][C]0.119113172626262[/C][C]0.94044341368687[/C][/ROW]
[ROW][C]34[/C][C]0.0492452949871543[/C][C]0.0984905899743086[/C][C]0.950754705012846[/C][/ROW]
[ROW][C]35[/C][C]0.0657270199265594[/C][C]0.131454039853119[/C][C]0.93427298007344[/C][/ROW]
[/TABLE]
Source: https://freestatistics.org/blog/index.php?pk=57515&T=5

Globally Unique Identifier (entire table): ba.freestatistics.org/blog/index.php?pk=57515&T=5

As an alternative you can also use a QR Code:  

The GUIDs for individual cells are displayed in the table below:

Goldfeld-Quandt test for Heteroskedasticity
p-valuesAlternative Hypothesis
breakpoint indexgreater2-sidedless
210.007351915274315750.01470383054863150.992648084725684
220.01661009528953880.03322019057907750.983389904710461
230.008320313888689480.01664062777737900.99167968611131
240.02247558294777810.04495116589555610.977524417052222
250.02447278015896870.04894556031793740.975527219841031
260.01224966237480820.02449932474961630.987750337625192
270.08148298444551150.1629659688910230.918517015554489
280.04645127070921530.09290254141843050.953548729290785
290.05035638282846950.1007127656569390.94964361717153
300.02871427625296190.05742855250592390.971285723747038
310.1254544838658770.2509089677317550.874545516134122
320.07889695306403630.1577939061280730.921103046935964
330.05955658631313080.1191131726262620.94044341368687
340.04924529498715430.09849058997430860.950754705012846
350.06572701992655940.1314540398531190.93427298007344


Meta Analysis of Goldfeld-Quandt test for Heteroskedasticity
Description# significant tests% significant testsOK/NOK
1% type I error level00OK
5% type I error level60.4NOK
10% type I error level90.6NOK

\begin{tabular}{lllllllll}
\hline
Meta Analysis of Goldfeld-Quandt test for Heteroskedasticity \tabularnewline
Description & # significant tests & % significant tests & OK/NOK \tabularnewline
1% type I error level & 0 & 0 & OK \tabularnewline
5% type I error level & 6 & 0.4 & NOK \tabularnewline
10% type I error level & 9 & 0.6 & NOK \tabularnewline
\hline
\end{tabular}
%Source: https://freestatistics.org/blog/index.php?pk=57515&T=6

[TABLE]
[ROW][C]Meta Analysis of Goldfeld-Quandt test for Heteroskedasticity[/C][/ROW]
[ROW][C]Description[/C][C]# significant tests[/C][C]% significant tests[/C][C]OK/NOK[/C][/ROW]
[ROW][C]1% type I error level[/C][C]0[/C][C]0[/C][C]OK[/C][/ROW]
[ROW][C]5% type I error level[/C][C]6[/C][C]0.4[/C][C]NOK[/C][/ROW]
[ROW][C]10% type I error level[/C][C]9[/C][C]0.6[/C][C]NOK[/C][/ROW]
[/TABLE]
Source: https://freestatistics.org/blog/index.php?pk=57515&T=6

Globally Unique Identifier (entire table): ba.freestatistics.org/blog/index.php?pk=57515&T=6

As an alternative you can also use a QR Code:  

The GUIDs for individual cells are displayed in the table below:

Meta Analysis of Goldfeld-Quandt test for Heteroskedasticity
Description# significant tests% significant testsOK/NOK
1% type I error level00OK
5% type I error level60.4NOK
10% type I error level90.6NOK


Parameters (Session):
par1 = 1 ; par2 = Include Monthly Dummies ; par3 = Linear Trend ;
Parameters (R input):
par1 = 1 ; par2 = Include Monthly Dummies ; par3 = Linear Trend ;
R code (references can be found in the software module):
library(lattice)
library(lmtest)
n25 <- 25 #minimum number of obs. for Goldfeld-Quandt test
par1 <- as.numeric(par1)
x <- t(y)
k <- length(x[1,])
n <- length(x[,1])
x1 <- cbind(x[,par1], x[,1:k!=par1])
mycolnames <- c(colnames(x)[par1], colnames(x)[1:k!=par1])
colnames(x1) <- mycolnames #colnames(x)[par1]
x <- x1
if (par3 == 'First Differences'){
x2 <- array(0, dim=c(n-1,k), dimnames=list(1:(n-1), paste('(1-B)',colnames(x),sep='')))
for (i in 1:n-1) {
for (j in 1:k) {
x2[i,j] <- x[i+1,j] - x[i,j]
}
}
x <- x2
}
if (par2 == 'Include Monthly Dummies'){
x2 <- array(0, dim=c(n,11), dimnames=list(1:n, paste('M', seq(1:11), sep ='')))
for (i in 1:11){
x2[seq(i,n,12),i] <- 1
}
x <- cbind(x, x2)
}
if (par2 == 'Include Quarterly Dummies'){
x2 <- array(0, dim=c(n,3), dimnames=list(1:n, paste('Q', seq(1:3), sep ='')))
for (i in 1:3){
x2[seq(i,n,4),i] <- 1
}
x <- cbind(x, x2)
}
k <- length(x[1,])
if (par3 == 'Linear Trend'){
x <- cbind(x, c(1:n))
colnames(x)[k+1] <- 't'
}
x
k <- length(x[1,])
df <- as.data.frame(x)
(mylm <- lm(df))
(mysum <- summary(mylm))
if (n > n25) {
kp3 <- k + 3
nmkm3 <- n - k - 3
gqarr <- array(NA, dim=c(nmkm3-kp3+1,3))
numgqtests <- 0
numsignificant1 <- 0
numsignificant5 <- 0
numsignificant10 <- 0
for (mypoint in kp3:nmkm3) {
j <- 0
numgqtests <- numgqtests + 1
for (myalt in c('greater', 'two.sided', 'less')) {
j <- j + 1
gqarr[mypoint-kp3+1,j] <- gqtest(mylm, point=mypoint, alternative=myalt)$p.value
}
if (gqarr[mypoint-kp3+1,2] < 0.01) numsignificant1 <- numsignificant1 + 1
if (gqarr[mypoint-kp3+1,2] < 0.05) numsignificant5 <- numsignificant5 + 1
if (gqarr[mypoint-kp3+1,2] < 0.10) numsignificant10 <- numsignificant10 + 1
}
gqarr
}
bitmap(file='test0.png')
plot(x[,1], type='l', main='Actuals and Interpolation', ylab='value of Actuals and Interpolation (dots)', xlab='time or index')
points(x[,1]-mysum$resid)
grid()
dev.off()
bitmap(file='test1.png')
plot(mysum$resid, type='b', pch=19, main='Residuals', ylab='value of Residuals', xlab='time or index')
grid()
dev.off()
bitmap(file='test2.png')
hist(mysum$resid, main='Residual Histogram', xlab='values of Residuals')
grid()
dev.off()
bitmap(file='test3.png')
densityplot(~mysum$resid,col='black',main='Residual Density Plot', xlab='values of Residuals')
dev.off()
bitmap(file='test4.png')
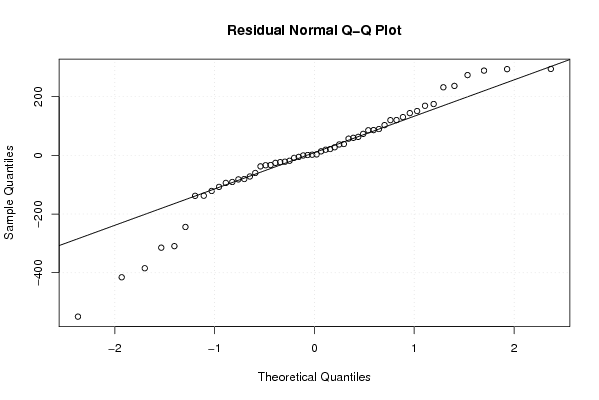
qqnorm(mysum$resid, main='Residual Normal Q-Q Plot')
qqline(mysum$resid)
grid()
dev.off()
(myerror <- as.ts(mysum$resid))
bitmap(file='test5.png')
dum <- cbind(lag(myerror,k=1),myerror)
dum
dum1 <- dum[2:length(myerror),]
dum1
z <- as.data.frame(dum1)
z
plot(z,main=paste('Residual Lag plot, lowess, and regression line'), ylab='values of Residuals', xlab='lagged values of Residuals')
lines(lowess(z))
abline(lm(z))
grid()
dev.off()
bitmap(file='test6.png')
acf(mysum$resid, lag.max=length(mysum$resid)/2, main='Residual Autocorrelation Function')
grid()
dev.off()
bitmap(file='test7.png')
pacf(mysum$resid, lag.max=length(mysum$resid)/2, main='Residual Partial Autocorrelation Function')
grid()
dev.off()
bitmap(file='test8.png')
opar <- par(mfrow = c(2,2), oma = c(0, 0, 1.1, 0))
plot(mylm, las = 1, sub='Residual Diagnostics')
par(opar)
dev.off()
if (n > n25) {
bitmap(file='test9.png')
plot(kp3:nmkm3,gqarr[,2], main='Goldfeld-Quandt test',ylab='2-sided p-value',xlab='breakpoint')
grid()
dev.off()
}
load(file='createtable')
a<-table.start()
a<-table.row.start(a)
a<-table.element(a, 'Multiple Linear Regression - Estimated Regression Equation', 1, TRUE)
a<-table.row.end(a)
myeq <- colnames(x)[1]
myeq <- paste(myeq, '[t] = ', sep='')
for (i in 1:k){
if (mysum$coefficients[i,1] > 0) myeq <- paste(myeq, '+', '')
myeq <- paste(myeq, mysum$coefficients[i,1], sep=' ')
if (rownames(mysum$coefficients)[i] != '(Intercept)') {
myeq <- paste(myeq, rownames(mysum$coefficients)[i], sep='')
if (rownames(mysum$coefficients)[i] != 't') myeq <- paste(myeq, '[t]', sep='')
}
}
myeq <- paste(myeq, ' + e[t]')
a<-table.row.start(a)
a<-table.element(a, myeq)
a<-table.row.end(a)
a<-table.end(a)
table.save(a,file='mytable1.tab')
a<-table.start()
a<-table.row.start(a)
a<-table.element(a,hyperlink('ols1.htm','Multiple Linear Regression - Ordinary Least Squares',''), 6, TRUE)
a<-table.row.end(a)
a<-table.row.start(a)
a<-table.element(a,'Variable',header=TRUE)
a<-table.element(a,'Parameter',header=TRUE)
a<-table.element(a,'S.D.',header=TRUE)
a<-table.element(a,'T-STAT
H0: parameter = 0',header=TRUE)
a<-table.element(a,'2-tail p-value',header=TRUE)
a<-table.element(a,'1-tail p-value',header=TRUE)
a<-table.row.end(a)
for (i in 1:k){
a<-table.row.start(a)
a<-table.element(a,rownames(mysum$coefficients)[i],header=TRUE)
a<-table.element(a,mysum$coefficients[i,1])
a<-table.element(a, round(mysum$coefficients[i,2],6))
a<-table.element(a, round(mysum$coefficients[i,3],4))
a<-table.element(a, round(mysum$coefficients[i,4],6))
a<-table.element(a, round(mysum$coefficients[i,4]/2,6))
a<-table.row.end(a)
}
a<-table.end(a)
table.save(a,file='mytable2.tab')
a<-table.start()
a<-table.row.start(a)
a<-table.element(a, 'Multiple Linear Regression - Regression Statistics', 2, TRUE)
a<-table.row.end(a)
a<-table.row.start(a)
a<-table.element(a, 'Multiple R',1,TRUE)
a<-table.element(a, sqrt(mysum$r.squared))
a<-table.row.end(a)
a<-table.row.start(a)
a<-table.element(a, 'R-squared',1,TRUE)
a<-table.element(a, mysum$r.squared)
a<-table.row.end(a)
a<-table.row.start(a)
a<-table.element(a, 'Adjusted R-squared',1,TRUE)
a<-table.element(a, mysum$adj.r.squared)
a<-table.row.end(a)
a<-table.row.start(a)
a<-table.element(a, 'F-TEST (value)',1,TRUE)
a<-table.element(a, mysum$fstatistic[1])
a<-table.row.end(a)
a<-table.row.start(a)
a<-table.element(a, 'F-TEST (DF numerator)',1,TRUE)
a<-table.element(a, mysum$fstatistic[2])
a<-table.row.end(a)
a<-table.row.start(a)
a<-table.element(a, 'F-TEST (DF denominator)',1,TRUE)
a<-table.element(a, mysum$fstatistic[3])
a<-table.row.end(a)
a<-table.row.start(a)
a<-table.element(a, 'p-value',1,TRUE)
a<-table.element(a, 1-pf(mysum$fstatistic[1],mysum$fstatistic[2],mysum$fstatistic[3]))
a<-table.row.end(a)
a<-table.row.start(a)
a<-table.element(a, 'Multiple Linear Regression - Residual Statistics', 2, TRUE)
a<-table.row.end(a)
a<-table.row.start(a)
a<-table.element(a, 'Residual Standard Deviation',1,TRUE)
a<-table.element(a, mysum$sigma)
a<-table.row.end(a)
a<-table.row.start(a)
a<-table.element(a, 'Sum Squared Residuals',1,TRUE)
a<-table.element(a, sum(myerror*myerror))
a<-table.row.end(a)
a<-table.end(a)
table.save(a,file='mytable3.tab')
a<-table.start()
a<-table.row.start(a)
a<-table.element(a, 'Multiple Linear Regression - Actuals, Interpolation, and Residuals', 4, TRUE)
a<-table.row.end(a)
a<-table.row.start(a)
a<-table.element(a, 'Time or Index', 1, TRUE)
a<-table.element(a, 'Actuals', 1, TRUE)
a<-table.element(a, 'Interpolation
Forecast', 1, TRUE)
a<-table.element(a, 'Residuals
Prediction Error', 1, TRUE)
a<-table.row.end(a)
for (i in 1:n) {
a<-table.row.start(a)
a<-table.element(a,i, 1, TRUE)
a<-table.element(a,x[i])
a<-table.element(a,x[i]-mysum$resid[i])
a<-table.element(a,mysum$resid[i])
a<-table.row.end(a)
}
a<-table.end(a)
table.save(a,file='mytable4.tab')
if (n > n25) {
a<-table.start()
a<-table.row.start(a)
a<-table.element(a,'Goldfeld-Quandt test for Heteroskedasticity',4,TRUE)
a<-table.row.end(a)
a<-table.row.start(a)
a<-table.element(a,'p-values',header=TRUE)
a<-table.element(a,'Alternative Hypothesis',3,header=TRUE)
a<-table.row.end(a)
a<-table.row.start(a)
a<-table.element(a,'breakpoint index',header=TRUE)
a<-table.element(a,'greater',header=TRUE)
a<-table.element(a,'2-sided',header=TRUE)
a<-table.element(a,'less',header=TRUE)
a<-table.row.end(a)
for (mypoint in kp3:nmkm3) {
a<-table.row.start(a)
a<-table.element(a,mypoint,header=TRUE)
a<-table.element(a,gqarr[mypoint-kp3+1,1])
a<-table.element(a,gqarr[mypoint-kp3+1,2])
a<-table.element(a,gqarr[mypoint-kp3+1,3])
a<-table.row.end(a)
}
a<-table.end(a)
table.save(a,file='mytable5.tab')
a<-table.start()
a<-table.row.start(a)
a<-table.element(a,'Meta Analysis of Goldfeld-Quandt test for Heteroskedasticity',4,TRUE)
a<-table.row.end(a)
a<-table.row.start(a)
a<-table.element(a,'Description',header=TRUE)
a<-table.element(a,'# significant tests',header=TRUE)
a<-table.element(a,'% significant tests',header=TRUE)
a<-table.element(a,'OK/NOK',header=TRUE)
a<-table.row.end(a)
a<-table.row.start(a)
a<-table.element(a,'1% type I error level',header=TRUE)
a<-table.element(a,numsignificant1)
a<-table.element(a,numsignificant1/numgqtests)
if (numsignificant1/numgqtests < 0.01) dum <- 'OK' else dum <- 'NOK'
a<-table.element(a,dum)
a<-table.row.end(a)
a<-table.row.start(a)
a<-table.element(a,'5% type I error level',header=TRUE)
a<-table.element(a,numsignificant5)
a<-table.element(a,numsignificant5/numgqtests)
if (numsignificant5/numgqtests < 0.05) dum <- 'OK' else dum <- 'NOK'
a<-table.element(a,dum)
a<-table.row.end(a)
a<-table.row.start(a)
a<-table.element(a,'10% type I error level',header=TRUE)
a<-table.element(a,numsignificant10)
a<-table.element(a,numsignificant10/numgqtests)
if (numsignificant10/numgqtests < 0.1) dum <- 'OK' else dum <- 'NOK'
a<-table.element(a,dum)
a<-table.row.end(a)
a<-table.end(a)
table.save(a,file='mytable6.tab')
}