Free Statistics

of Irreproducible Research!

Author's title

Author*The author of this computation has been verified*
R Software Modulerwasp_multipleregression.wasp
Title produced by softwareMultiple Regression
Date of computationWed, 18 Nov 2009 09:28:13 -0700
Cite this page as followsStatistical Computations at FreeStatistics.org, Office for Research Development and Education, URL https://freestatistics.org/blog/index.php?v=date/2009/Nov/18/t1258561844i4cnlkdwzybvjze.htm/, Retrieved Sun, 05 May 2024 18:45:43 +0000
Statistical Computations at FreeStatistics.org, Office for Research Development and Education, URL https://freestatistics.org/blog/index.php?pk=57517, Retrieved Sun, 05 May 2024 18:45:43 +0000
QR Codes:

Original text written by user:
IsPrivate?No (this computation is public)
User-defined keywords
Estimated Impact145
Family? (F = Feedback message, R = changed R code, M = changed R Module, P = changed Parameters, D = changed Data)
-     [Multiple Regression] [Q1 The Seatbeltlaw] [2007-11-14 19:27:43] [8cd6641b921d30ebe00b648d1481bba0]
- RMPD  [Multiple Regression] [Seatbelt] [2009-11-12 13:54:52] [b98453cac15ba1066b407e146608df68]
-   PD      [Multiple Regression] [Multiple regressi...] [2009-11-18 16:28:13] [fe2edc5b0acc9545190e03904e9be55e] [Current]
Feedback Forum

Post a new message
Dataseries X:
2.97	101.1	2.98	3.01	3.06	3.12	3.58
3.02	100.93	2.97	2.98	3.01	3.06	3.52
3.07	100.85	3.02	2.97	2.98	3.01	3.45
3.18	100.93	3.07	3.02	2.97	2.98	3.36
3.29	99.6	3.18	3.07	3.02	2.97	3.27
3.43	101.88	3.29	3.18	3.07	3.02	3.21
3.61	101.81	3.43	3.29	3.18	3.07	3.19
3.74	102.38	3.61	3.43	3.29	3.18	3.16
3.87	102.74	3.74	3.61	3.43	3.29	3.12
3.88	102.82	3.87	3.74	3.61	3.43	3.06
4.09	101.72	3.88	3.87	3.74	3.61	3.01
4.19	103.47	4.09	3.88	3.87	3.74	2.98
4.2	102.98	4.19	4.09	3.88	3.87	2.97
4.29	102.68	4.2	4.19	4.09	3.88	3.02
4.37	102.9	4.29	4.2	4.19	4.09	3.07
4.47	103.03	4.37	4.29	4.2	4.19	3.18
4.61	101.29	4.47	4.37	4.29	4.2	3.29
4.65	103.69	4.61	4.47	4.37	4.29	3.43
4.69	103.68	4.65	4.61	4.47	4.37	3.61
4.82	104.2	4.69	4.65	4.61	4.47	3.74
4.86	104.08	4.82	4.69	4.65	4.61	3.87
4.87	104.16	4.86	4.82	4.69	4.65	3.88
5.01	103.05	4.87	4.86	4.82	4.69	4.09
5.03	104.66	5.01	4.87	4.86	4.82	4.19
5.13	104.46	5.03	5.01	4.87	4.86	4.2
5.18	104.95	5.13	5.03	5.01	4.87	4.29
5.21	105.85	5.18	5.13	5.03	5.01	4.37
5.26	106.23	5.21	5.18	5.13	5.03	4.47
5.25	104.86	5.26	5.21	5.18	5.13	4.61
5.2	107.44	5.25	5.26	5.21	5.18	4.65
5.16	108.23	5.2	5.25	5.26	5.21	4.69
5.19	108.45	5.16	5.2	5.25	5.26	4.82
5.39	109.39	5.19	5.16	5.2	5.25	4.86
5.58	110.15	5.39	5.19	5.16	5.2	4.87
5.76	109.13	5.58	5.39	5.19	5.16	5.01
5.89	110.28	5.76	5.58	5.39	5.19	5.03
5.98	110.17	5.89	5.76	5.58	5.39	5.13
6.02	109.99	5.98	5.89	5.76	5.58	5.18
5.62	109.26	6.02	5.98	5.89	5.76	5.21
4.87	109.11	5.62	6.02	5.98	5.89	5.26
4.24	107.06	4.87	5.62	6.02	5.98	5.25
4.02	109.53	4.24	4.87	5.62	6.02	5.2
3.74	108.92	4.02	4.24	4.87	5.62	5.16
3.45	109.24	3.74	4.02	4.24	4.87	5.19
3.34	109.12	3.45	3.74	4.02	4.24	5.39
3.21	109	3.34	3.45	3.74	4.02	5.58
3.12	107.23	3.21	3.34	3.45	3.74	5.76
3.04	109.49	3.12	3.21	3.34	3.45	5.89


Summary of computational transaction
Raw Inputview raw input (R code)
Raw Outputview raw output of R engine
Computing time3 seconds
R Server'Gwilym Jenkins' @ 72.249.127.135

\begin{tabular}{lllllllll}
\hline
Summary of computational transaction \tabularnewline
Raw Input & view raw input (R code)  \tabularnewline
Raw Output & view raw output of R engine  \tabularnewline
Computing time & 3 seconds \tabularnewline
R Server & 'Gwilym Jenkins' @ 72.249.127.135 \tabularnewline
\hline
\end{tabular}
%Source: https://freestatistics.org/blog/index.php?pk=57517&T=0

[TABLE]
[ROW][C]Summary of computational transaction[/C][/ROW]
[ROW][C]Raw Input[/C][C]view raw input (R code) [/C][/ROW]
[ROW][C]Raw Output[/C][C]view raw output of R engine [/C][/ROW]
[ROW][C]Computing time[/C][C]3 seconds[/C][/ROW]
[ROW][C]R Server[/C][C]'Gwilym Jenkins' @ 72.249.127.135[/C][/ROW]
[/TABLE]
Source: https://freestatistics.org/blog/index.php?pk=57517&T=0

Globally Unique Identifier (entire table): ba.freestatistics.org/blog/index.php?pk=57517&T=0

As an alternative you can also use a QR Code:  

The GUIDs for individual cells are displayed in the table below:

Summary of computational transaction
Raw Inputview raw input (R code)
Raw Outputview raw output of R engine
Computing time3 seconds
R Server'Gwilym Jenkins' @ 72.249.127.135


Multiple Linear Regression - Estimated Regression Equation
Y[t] = -1.39732048460966 + 0.0161718963298520X[t] + 2.00157312691411y1[t] -1.56424107271801y2[t] + 0.790011335492396y3[t] -0.262256734663169y4[t] -0.0424262947310977y12[t] + 0.113985026448485M1[t] + 0.0815647206202224M2[t] -0.0294406678719151M3[t] + 0.0370825333025232M4[t] + 0.0878443689176442M5[t] + 0.0948251430698515M6[t] + 0.0467429337123727M7[t] + 0.104716315344380M8[t] + 0.124092289711188M9[t] + 0.0282583110835392M10[t] + 0.220714286663328M11[t] -0.00206216097793336t + e[t]

\begin{tabular}{lllllllll}
\hline
Multiple Linear Regression - Estimated Regression Equation \tabularnewline
Y[t] =  -1.39732048460966 +  0.0161718963298520X[t] +  2.00157312691411y1[t] -1.56424107271801y2[t] +  0.790011335492396y3[t] -0.262256734663169y4[t] -0.0424262947310977y12[t] +  0.113985026448485M1[t] +  0.0815647206202224M2[t] -0.0294406678719151M3[t] +  0.0370825333025232M4[t] +  0.0878443689176442M5[t] +  0.0948251430698515M6[t] +  0.0467429337123727M7[t] +  0.104716315344380M8[t] +  0.124092289711188M9[t] +  0.0282583110835392M10[t] +  0.220714286663328M11[t] -0.00206216097793336t  + e[t] \tabularnewline
\hline
\end{tabular}
%Source: https://freestatistics.org/blog/index.php?pk=57517&T=1

[TABLE]
[ROW][C]Multiple Linear Regression - Estimated Regression Equation[/C][/ROW]
[ROW][C]Y[t] =  -1.39732048460966 +  0.0161718963298520X[t] +  2.00157312691411y1[t] -1.56424107271801y2[t] +  0.790011335492396y3[t] -0.262256734663169y4[t] -0.0424262947310977y12[t] +  0.113985026448485M1[t] +  0.0815647206202224M2[t] -0.0294406678719151M3[t] +  0.0370825333025232M4[t] +  0.0878443689176442M5[t] +  0.0948251430698515M6[t] +  0.0467429337123727M7[t] +  0.104716315344380M8[t] +  0.124092289711188M9[t] +  0.0282583110835392M10[t] +  0.220714286663328M11[t] -0.00206216097793336t  + e[t][/C][/ROW]
[/TABLE]
Source: https://freestatistics.org/blog/index.php?pk=57517&T=1

Globally Unique Identifier (entire table): ba.freestatistics.org/blog/index.php?pk=57517&T=1

As an alternative you can also use a QR Code:  

The GUIDs for individual cells are displayed in the table below:

Multiple Linear Regression - Estimated Regression Equation
Y[t] = -1.39732048460966 + 0.0161718963298520X[t] + 2.00157312691411y1[t] -1.56424107271801y2[t] + 0.790011335492396y3[t] -0.262256734663169y4[t] -0.0424262947310977y12[t] + 0.113985026448485M1[t] + 0.0815647206202224M2[t] -0.0294406678719151M3[t] + 0.0370825333025232M4[t] + 0.0878443689176442M5[t] + 0.0948251430698515M6[t] + 0.0467429337123727M7[t] + 0.104716315344380M8[t] + 0.124092289711188M9[t] + 0.0282583110835392M10[t] + 0.220714286663328M11[t] -0.00206216097793336t + e[t]


Multiple Linear Regression - Ordinary Least Squares
VariableParameterS.D.T-STATH0: parameter = 02-tail p-value1-tail p-value
(Intercept)-1.397320484609662.096764-0.66640.5104110.255206
X0.01617189632985200.022280.72580.4737520.236876
y12.001573126914110.18484510.828400
y2-1.564241072718010.396628-3.94390.0004660.000233
y30.7900113354923960.4020151.96510.0590430.029522
y4-0.2622567346631690.201902-1.29890.2042010.102101
y12-0.04242629473109770.067502-0.62850.5345810.267291
M10.1139850264484850.0971711.1730.2503250.125162
M20.08156472062022240.0882950.92380.3632290.181614
M3-0.02944066787191510.090153-0.32660.7463420.373171
M40.03708253330252320.0983020.37720.7087480.354374
M50.08784436891764420.1052790.83440.410880.20544
M60.09482514306985150.0921531.0290.3119860.155993
M70.04674293371237270.0915470.51060.6135020.306751
M80.1047163153443800.0930431.12550.2696220.134811
M90.1240922897111880.0856371.44910.158050.079025
M100.02825831108353920.0839820.33650.7389310.369466
M110.2207142866633280.0930762.37130.0245820.012291
t-0.002062160977933360.005175-0.39850.6931670.346583

\begin{tabular}{lllllllll}
\hline
Multiple Linear Regression - Ordinary Least Squares \tabularnewline
Variable & Parameter & S.D. & T-STATH0: parameter = 0 & 2-tail p-value & 1-tail p-value \tabularnewline
(Intercept) & -1.39732048460966 & 2.096764 & -0.6664 & 0.510411 & 0.255206 \tabularnewline
X & 0.0161718963298520 & 0.02228 & 0.7258 & 0.473752 & 0.236876 \tabularnewline
y1 & 2.00157312691411 & 0.184845 & 10.8284 & 0 & 0 \tabularnewline
y2 & -1.56424107271801 & 0.396628 & -3.9439 & 0.000466 & 0.000233 \tabularnewline
y3 & 0.790011335492396 & 0.402015 & 1.9651 & 0.059043 & 0.029522 \tabularnewline
y4 & -0.262256734663169 & 0.201902 & -1.2989 & 0.204201 & 0.102101 \tabularnewline
y12 & -0.0424262947310977 & 0.067502 & -0.6285 & 0.534581 & 0.267291 \tabularnewline
M1 & 0.113985026448485 & 0.097171 & 1.173 & 0.250325 & 0.125162 \tabularnewline
M2 & 0.0815647206202224 & 0.088295 & 0.9238 & 0.363229 & 0.181614 \tabularnewline
M3 & -0.0294406678719151 & 0.090153 & -0.3266 & 0.746342 & 0.373171 \tabularnewline
M4 & 0.0370825333025232 & 0.098302 & 0.3772 & 0.708748 & 0.354374 \tabularnewline
M5 & 0.0878443689176442 & 0.105279 & 0.8344 & 0.41088 & 0.20544 \tabularnewline
M6 & 0.0948251430698515 & 0.092153 & 1.029 & 0.311986 & 0.155993 \tabularnewline
M7 & 0.0467429337123727 & 0.091547 & 0.5106 & 0.613502 & 0.306751 \tabularnewline
M8 & 0.104716315344380 & 0.093043 & 1.1255 & 0.269622 & 0.134811 \tabularnewline
M9 & 0.124092289711188 & 0.085637 & 1.4491 & 0.15805 & 0.079025 \tabularnewline
M10 & 0.0282583110835392 & 0.083982 & 0.3365 & 0.738931 & 0.369466 \tabularnewline
M11 & 0.220714286663328 & 0.093076 & 2.3713 & 0.024582 & 0.012291 \tabularnewline
t & -0.00206216097793336 & 0.005175 & -0.3985 & 0.693167 & 0.346583 \tabularnewline
\hline
\end{tabular}
%Source: https://freestatistics.org/blog/index.php?pk=57517&T=2

[TABLE]
[ROW][C]Multiple Linear Regression - Ordinary Least Squares[/C][/ROW]
[ROW][C]Variable[/C][C]Parameter[/C][C]S.D.[/C][C]T-STATH0: parameter = 0[/C][C]2-tail p-value[/C][C]1-tail p-value[/C][/ROW]
[ROW][C](Intercept)[/C][C]-1.39732048460966[/C][C]2.096764[/C][C]-0.6664[/C][C]0.510411[/C][C]0.255206[/C][/ROW]
[ROW][C]X[/C][C]0.0161718963298520[/C][C]0.02228[/C][C]0.7258[/C][C]0.473752[/C][C]0.236876[/C][/ROW]
[ROW][C]y1[/C][C]2.00157312691411[/C][C]0.184845[/C][C]10.8284[/C][C]0[/C][C]0[/C][/ROW]
[ROW][C]y2[/C][C]-1.56424107271801[/C][C]0.396628[/C][C]-3.9439[/C][C]0.000466[/C][C]0.000233[/C][/ROW]
[ROW][C]y3[/C][C]0.790011335492396[/C][C]0.402015[/C][C]1.9651[/C][C]0.059043[/C][C]0.029522[/C][/ROW]
[ROW][C]y4[/C][C]-0.262256734663169[/C][C]0.201902[/C][C]-1.2989[/C][C]0.204201[/C][C]0.102101[/C][/ROW]
[ROW][C]y12[/C][C]-0.0424262947310977[/C][C]0.067502[/C][C]-0.6285[/C][C]0.534581[/C][C]0.267291[/C][/ROW]
[ROW][C]M1[/C][C]0.113985026448485[/C][C]0.097171[/C][C]1.173[/C][C]0.250325[/C][C]0.125162[/C][/ROW]
[ROW][C]M2[/C][C]0.0815647206202224[/C][C]0.088295[/C][C]0.9238[/C][C]0.363229[/C][C]0.181614[/C][/ROW]
[ROW][C]M3[/C][C]-0.0294406678719151[/C][C]0.090153[/C][C]-0.3266[/C][C]0.746342[/C][C]0.373171[/C][/ROW]
[ROW][C]M4[/C][C]0.0370825333025232[/C][C]0.098302[/C][C]0.3772[/C][C]0.708748[/C][C]0.354374[/C][/ROW]
[ROW][C]M5[/C][C]0.0878443689176442[/C][C]0.105279[/C][C]0.8344[/C][C]0.41088[/C][C]0.20544[/C][/ROW]
[ROW][C]M6[/C][C]0.0948251430698515[/C][C]0.092153[/C][C]1.029[/C][C]0.311986[/C][C]0.155993[/C][/ROW]
[ROW][C]M7[/C][C]0.0467429337123727[/C][C]0.091547[/C][C]0.5106[/C][C]0.613502[/C][C]0.306751[/C][/ROW]
[ROW][C]M8[/C][C]0.104716315344380[/C][C]0.093043[/C][C]1.1255[/C][C]0.269622[/C][C]0.134811[/C][/ROW]
[ROW][C]M9[/C][C]0.124092289711188[/C][C]0.085637[/C][C]1.4491[/C][C]0.15805[/C][C]0.079025[/C][/ROW]
[ROW][C]M10[/C][C]0.0282583110835392[/C][C]0.083982[/C][C]0.3365[/C][C]0.738931[/C][C]0.369466[/C][/ROW]
[ROW][C]M11[/C][C]0.220714286663328[/C][C]0.093076[/C][C]2.3713[/C][C]0.024582[/C][C]0.012291[/C][/ROW]
[ROW][C]t[/C][C]-0.00206216097793336[/C][C]0.005175[/C][C]-0.3985[/C][C]0.693167[/C][C]0.346583[/C][/ROW]
[/TABLE]
Source: https://freestatistics.org/blog/index.php?pk=57517&T=2

Globally Unique Identifier (entire table): ba.freestatistics.org/blog/index.php?pk=57517&T=2

As an alternative you can also use a QR Code:  

The GUIDs for individual cells are displayed in the table below:

Multiple Linear Regression - Ordinary Least Squares
VariableParameterS.D.T-STATH0: parameter = 02-tail p-value1-tail p-value
(Intercept)-1.397320484609662.096764-0.66640.5104110.255206
X0.01617189632985200.022280.72580.4737520.236876
y12.001573126914110.18484510.828400
y2-1.564241072718010.396628-3.94390.0004660.000233
y30.7900113354923960.4020151.96510.0590430.029522
y4-0.2622567346631690.201902-1.29890.2042010.102101
y12-0.04242629473109770.067502-0.62850.5345810.267291
M10.1139850264484850.0971711.1730.2503250.125162
M20.08156472062022240.0882950.92380.3632290.181614
M3-0.02944066787191510.090153-0.32660.7463420.373171
M40.03708253330252320.0983020.37720.7087480.354374
M50.08784436891764420.1052790.83440.410880.20544
M60.09482514306985150.0921531.0290.3119860.155993
M70.04674293371237270.0915470.51060.6135020.306751
M80.1047163153443800.0930431.12550.2696220.134811
M90.1240922897111880.0856371.44910.158050.079025
M100.02825831108353920.0839820.33650.7389310.369466
M110.2207142866633280.0930762.37130.0245820.012291
t-0.002062160977933360.005175-0.39850.6931670.346583


Multiple Linear Regression - Regression Statistics
Multiple R0.995022541782589
R-squared0.990069858655483
Adjusted R-squared0.983906322648542
F-TEST (value)160.6334184696
F-TEST (DF numerator)18
F-TEST (DF denominator)29
p-value0
Multiple Linear Regression - Residual Statistics
Residual Standard Deviation0.114958626496740
Sum Squared Residuals0.38324908837449

\begin{tabular}{lllllllll}
\hline
Multiple Linear Regression - Regression Statistics \tabularnewline
Multiple R & 0.995022541782589 \tabularnewline
R-squared & 0.990069858655483 \tabularnewline
Adjusted R-squared & 0.983906322648542 \tabularnewline
F-TEST (value) & 160.6334184696 \tabularnewline
F-TEST (DF numerator) & 18 \tabularnewline
F-TEST (DF denominator) & 29 \tabularnewline
p-value & 0 \tabularnewline
Multiple Linear Regression - Residual Statistics \tabularnewline
Residual Standard Deviation & 0.114958626496740 \tabularnewline
Sum Squared Residuals & 0.38324908837449 \tabularnewline
\hline
\end{tabular}
%Source: https://freestatistics.org/blog/index.php?pk=57517&T=3

[TABLE]
[ROW][C]Multiple Linear Regression - Regression Statistics[/C][/ROW]
[ROW][C]Multiple R[/C][C]0.995022541782589[/C][/ROW]
[ROW][C]R-squared[/C][C]0.990069858655483[/C][/ROW]
[ROW][C]Adjusted R-squared[/C][C]0.983906322648542[/C][/ROW]
[ROW][C]F-TEST (value)[/C][C]160.6334184696[/C][/ROW]
[ROW][C]F-TEST (DF numerator)[/C][C]18[/C][/ROW]
[ROW][C]F-TEST (DF denominator)[/C][C]29[/C][/ROW]
[ROW][C]p-value[/C][C]0[/C][/ROW]
[ROW][C]Multiple Linear Regression - Residual Statistics[/C][/ROW]
[ROW][C]Residual Standard Deviation[/C][C]0.114958626496740[/C][/ROW]
[ROW][C]Sum Squared Residuals[/C][C]0.38324908837449[/C][/ROW]
[/TABLE]
Source: https://freestatistics.org/blog/index.php?pk=57517&T=3

Globally Unique Identifier (entire table): ba.freestatistics.org/blog/index.php?pk=57517&T=3

As an alternative you can also use a QR Code:  

The GUIDs for individual cells are displayed in the table below:

Multiple Linear Regression - Regression Statistics
Multiple R0.995022541782589
R-squared0.990069858655483
Adjusted R-squared0.983906322648542
F-TEST (value)160.6334184696
F-TEST (DF numerator)18
F-TEST (DF denominator)29
p-value0
Multiple Linear Regression - Residual Statistics
Residual Standard Deviation0.114958626496740
Sum Squared Residuals0.38324908837449


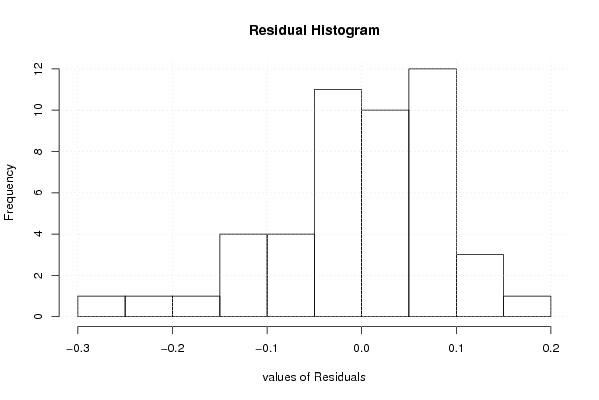
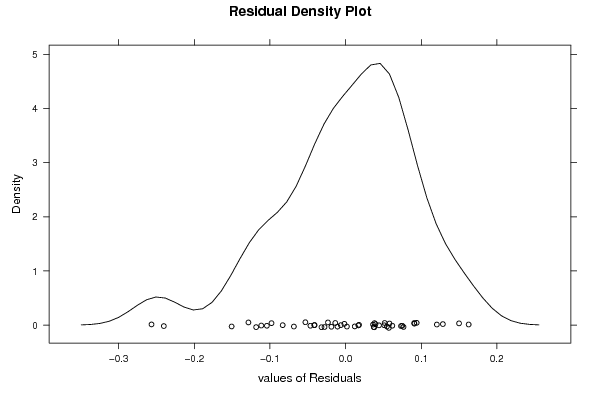
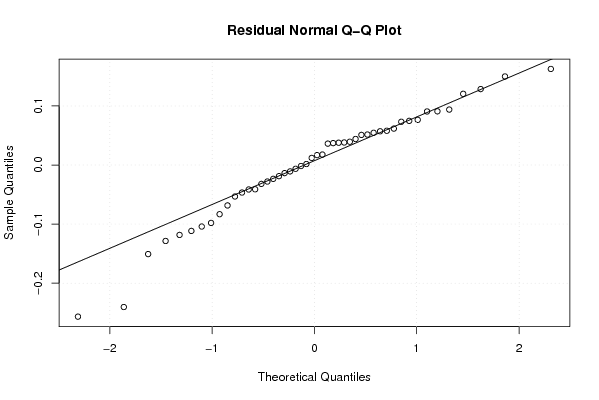
Multiple Linear Regression - Actuals, Interpolation, and Residuals
Time or IndexActualsInterpolationForecastResidualsPrediction Error
12.973.05321092845207-0.0832109284520703
23.023.02167115517124-0.00167115517124363
33.073.015413258367230.0545867416327652
43.183.10682060819070.0731793918092982
53.293.32191415168089-0.0319141516808896
63.433.44074452217412-0.0107445221741233
73.613.572258774930240.0377412250697556
83.743.8380031840895-0.0980031840894992
93.873.92323039151194-0.0532303915119448
103.883.9915128458779-0.111512845877897
114.094.038398542443910.0516014575560893
124.194.31849174625441-0.128491746254406
134.24.26838807073998-0.0683880707399832
144.294.253804157402390.0361958425976128
154.374.330599500353390.0394004996466066
164.474.393514588149470.0764854118505262
174.614.552904750473950.0570952495260492
184.654.7540901647934-0.104090164793398
194.694.615237112115320.0747628878846814
204.824.775911496216340.0440885037836637
214.864.97828863788755-0.118288637887551
224.874.779083756697440.090916243302561
235.014.992274537067530.0177254629324665
245.035.0533771179985-0.0233771179985028
255.134.980088897581930.149911102418068
265.185.22656380431092-0.0465638043109186
275.215.047395690890140.162604309109864
285.265.169350561246370.0906494387536255
295.255.25638137412178-0.00638137412177796
305.25.2136861464644-0.0136861464643993
315.165.121817141556530.0381828584434746
325.195.152906939559380.0370930604406221
335.395.269464120997230.120535879002774
345.585.518334136169760.0616658638302374
355.765.7879342242742-0.0279342242741952
365.895.796118855604340.0938811443956576
375.985.978312103226020.00168789677398566
386.026.007960883115450.0120391168845495
395.625.87659155038924-0.256591550389236
404.875.11031424241345-0.24031424241345
414.244.25879972372338-0.0187997237233816
424.023.891479166568080.128520833431921
433.743.89068697139791-0.150686971397912
443.453.433178380134790.0168216198652134
453.343.289016849603280.0509831503967224
463.213.2510692612549-0.0410692612549018
473.123.16139269621436-0.0413926962143606
483.042.982012280142750.057987719857251

\begin{tabular}{lllllllll}
\hline
Multiple Linear Regression - Actuals, Interpolation, and Residuals \tabularnewline
Time or Index & Actuals & InterpolationForecast & ResidualsPrediction Error \tabularnewline
1 & 2.97 & 3.05321092845207 & -0.0832109284520703 \tabularnewline
2 & 3.02 & 3.02167115517124 & -0.00167115517124363 \tabularnewline
3 & 3.07 & 3.01541325836723 & 0.0545867416327652 \tabularnewline
4 & 3.18 & 3.1068206081907 & 0.0731793918092982 \tabularnewline
5 & 3.29 & 3.32191415168089 & -0.0319141516808896 \tabularnewline
6 & 3.43 & 3.44074452217412 & -0.0107445221741233 \tabularnewline
7 & 3.61 & 3.57225877493024 & 0.0377412250697556 \tabularnewline
8 & 3.74 & 3.8380031840895 & -0.0980031840894992 \tabularnewline
9 & 3.87 & 3.92323039151194 & -0.0532303915119448 \tabularnewline
10 & 3.88 & 3.9915128458779 & -0.111512845877897 \tabularnewline
11 & 4.09 & 4.03839854244391 & 0.0516014575560893 \tabularnewline
12 & 4.19 & 4.31849174625441 & -0.128491746254406 \tabularnewline
13 & 4.2 & 4.26838807073998 & -0.0683880707399832 \tabularnewline
14 & 4.29 & 4.25380415740239 & 0.0361958425976128 \tabularnewline
15 & 4.37 & 4.33059950035339 & 0.0394004996466066 \tabularnewline
16 & 4.47 & 4.39351458814947 & 0.0764854118505262 \tabularnewline
17 & 4.61 & 4.55290475047395 & 0.0570952495260492 \tabularnewline
18 & 4.65 & 4.7540901647934 & -0.104090164793398 \tabularnewline
19 & 4.69 & 4.61523711211532 & 0.0747628878846814 \tabularnewline
20 & 4.82 & 4.77591149621634 & 0.0440885037836637 \tabularnewline
21 & 4.86 & 4.97828863788755 & -0.118288637887551 \tabularnewline
22 & 4.87 & 4.77908375669744 & 0.090916243302561 \tabularnewline
23 & 5.01 & 4.99227453706753 & 0.0177254629324665 \tabularnewline
24 & 5.03 & 5.0533771179985 & -0.0233771179985028 \tabularnewline
25 & 5.13 & 4.98008889758193 & 0.149911102418068 \tabularnewline
26 & 5.18 & 5.22656380431092 & -0.0465638043109186 \tabularnewline
27 & 5.21 & 5.04739569089014 & 0.162604309109864 \tabularnewline
28 & 5.26 & 5.16935056124637 & 0.0906494387536255 \tabularnewline
29 & 5.25 & 5.25638137412178 & -0.00638137412177796 \tabularnewline
30 & 5.2 & 5.2136861464644 & -0.0136861464643993 \tabularnewline
31 & 5.16 & 5.12181714155653 & 0.0381828584434746 \tabularnewline
32 & 5.19 & 5.15290693955938 & 0.0370930604406221 \tabularnewline
33 & 5.39 & 5.26946412099723 & 0.120535879002774 \tabularnewline
34 & 5.58 & 5.51833413616976 & 0.0616658638302374 \tabularnewline
35 & 5.76 & 5.7879342242742 & -0.0279342242741952 \tabularnewline
36 & 5.89 & 5.79611885560434 & 0.0938811443956576 \tabularnewline
37 & 5.98 & 5.97831210322602 & 0.00168789677398566 \tabularnewline
38 & 6.02 & 6.00796088311545 & 0.0120391168845495 \tabularnewline
39 & 5.62 & 5.87659155038924 & -0.256591550389236 \tabularnewline
40 & 4.87 & 5.11031424241345 & -0.24031424241345 \tabularnewline
41 & 4.24 & 4.25879972372338 & -0.0187997237233816 \tabularnewline
42 & 4.02 & 3.89147916656808 & 0.128520833431921 \tabularnewline
43 & 3.74 & 3.89068697139791 & -0.150686971397912 \tabularnewline
44 & 3.45 & 3.43317838013479 & 0.0168216198652134 \tabularnewline
45 & 3.34 & 3.28901684960328 & 0.0509831503967224 \tabularnewline
46 & 3.21 & 3.2510692612549 & -0.0410692612549018 \tabularnewline
47 & 3.12 & 3.16139269621436 & -0.0413926962143606 \tabularnewline
48 & 3.04 & 2.98201228014275 & 0.057987719857251 \tabularnewline
\hline
\end{tabular}
%Source: https://freestatistics.org/blog/index.php?pk=57517&T=4

[TABLE]
[ROW][C]Multiple Linear Regression - Actuals, Interpolation, and Residuals[/C][/ROW]
[ROW][C]Time or Index[/C][C]Actuals[/C][C]InterpolationForecast[/C][C]ResidualsPrediction Error[/C][/ROW]
[ROW][C]1[/C][C]2.97[/C][C]3.05321092845207[/C][C]-0.0832109284520703[/C][/ROW]
[ROW][C]2[/C][C]3.02[/C][C]3.02167115517124[/C][C]-0.00167115517124363[/C][/ROW]
[ROW][C]3[/C][C]3.07[/C][C]3.01541325836723[/C][C]0.0545867416327652[/C][/ROW]
[ROW][C]4[/C][C]3.18[/C][C]3.1068206081907[/C][C]0.0731793918092982[/C][/ROW]
[ROW][C]5[/C][C]3.29[/C][C]3.32191415168089[/C][C]-0.0319141516808896[/C][/ROW]
[ROW][C]6[/C][C]3.43[/C][C]3.44074452217412[/C][C]-0.0107445221741233[/C][/ROW]
[ROW][C]7[/C][C]3.61[/C][C]3.57225877493024[/C][C]0.0377412250697556[/C][/ROW]
[ROW][C]8[/C][C]3.74[/C][C]3.8380031840895[/C][C]-0.0980031840894992[/C][/ROW]
[ROW][C]9[/C][C]3.87[/C][C]3.92323039151194[/C][C]-0.0532303915119448[/C][/ROW]
[ROW][C]10[/C][C]3.88[/C][C]3.9915128458779[/C][C]-0.111512845877897[/C][/ROW]
[ROW][C]11[/C][C]4.09[/C][C]4.03839854244391[/C][C]0.0516014575560893[/C][/ROW]
[ROW][C]12[/C][C]4.19[/C][C]4.31849174625441[/C][C]-0.128491746254406[/C][/ROW]
[ROW][C]13[/C][C]4.2[/C][C]4.26838807073998[/C][C]-0.0683880707399832[/C][/ROW]
[ROW][C]14[/C][C]4.29[/C][C]4.25380415740239[/C][C]0.0361958425976128[/C][/ROW]
[ROW][C]15[/C][C]4.37[/C][C]4.33059950035339[/C][C]0.0394004996466066[/C][/ROW]
[ROW][C]16[/C][C]4.47[/C][C]4.39351458814947[/C][C]0.0764854118505262[/C][/ROW]
[ROW][C]17[/C][C]4.61[/C][C]4.55290475047395[/C][C]0.0570952495260492[/C][/ROW]
[ROW][C]18[/C][C]4.65[/C][C]4.7540901647934[/C][C]-0.104090164793398[/C][/ROW]
[ROW][C]19[/C][C]4.69[/C][C]4.61523711211532[/C][C]0.0747628878846814[/C][/ROW]
[ROW][C]20[/C][C]4.82[/C][C]4.77591149621634[/C][C]0.0440885037836637[/C][/ROW]
[ROW][C]21[/C][C]4.86[/C][C]4.97828863788755[/C][C]-0.118288637887551[/C][/ROW]
[ROW][C]22[/C][C]4.87[/C][C]4.77908375669744[/C][C]0.090916243302561[/C][/ROW]
[ROW][C]23[/C][C]5.01[/C][C]4.99227453706753[/C][C]0.0177254629324665[/C][/ROW]
[ROW][C]24[/C][C]5.03[/C][C]5.0533771179985[/C][C]-0.0233771179985028[/C][/ROW]
[ROW][C]25[/C][C]5.13[/C][C]4.98008889758193[/C][C]0.149911102418068[/C][/ROW]
[ROW][C]26[/C][C]5.18[/C][C]5.22656380431092[/C][C]-0.0465638043109186[/C][/ROW]
[ROW][C]27[/C][C]5.21[/C][C]5.04739569089014[/C][C]0.162604309109864[/C][/ROW]
[ROW][C]28[/C][C]5.26[/C][C]5.16935056124637[/C][C]0.0906494387536255[/C][/ROW]
[ROW][C]29[/C][C]5.25[/C][C]5.25638137412178[/C][C]-0.00638137412177796[/C][/ROW]
[ROW][C]30[/C][C]5.2[/C][C]5.2136861464644[/C][C]-0.0136861464643993[/C][/ROW]
[ROW][C]31[/C][C]5.16[/C][C]5.12181714155653[/C][C]0.0381828584434746[/C][/ROW]
[ROW][C]32[/C][C]5.19[/C][C]5.15290693955938[/C][C]0.0370930604406221[/C][/ROW]
[ROW][C]33[/C][C]5.39[/C][C]5.26946412099723[/C][C]0.120535879002774[/C][/ROW]
[ROW][C]34[/C][C]5.58[/C][C]5.51833413616976[/C][C]0.0616658638302374[/C][/ROW]
[ROW][C]35[/C][C]5.76[/C][C]5.7879342242742[/C][C]-0.0279342242741952[/C][/ROW]
[ROW][C]36[/C][C]5.89[/C][C]5.79611885560434[/C][C]0.0938811443956576[/C][/ROW]
[ROW][C]37[/C][C]5.98[/C][C]5.97831210322602[/C][C]0.00168789677398566[/C][/ROW]
[ROW][C]38[/C][C]6.02[/C][C]6.00796088311545[/C][C]0.0120391168845495[/C][/ROW]
[ROW][C]39[/C][C]5.62[/C][C]5.87659155038924[/C][C]-0.256591550389236[/C][/ROW]
[ROW][C]40[/C][C]4.87[/C][C]5.11031424241345[/C][C]-0.24031424241345[/C][/ROW]
[ROW][C]41[/C][C]4.24[/C][C]4.25879972372338[/C][C]-0.0187997237233816[/C][/ROW]
[ROW][C]42[/C][C]4.02[/C][C]3.89147916656808[/C][C]0.128520833431921[/C][/ROW]
[ROW][C]43[/C][C]3.74[/C][C]3.89068697139791[/C][C]-0.150686971397912[/C][/ROW]
[ROW][C]44[/C][C]3.45[/C][C]3.43317838013479[/C][C]0.0168216198652134[/C][/ROW]
[ROW][C]45[/C][C]3.34[/C][C]3.28901684960328[/C][C]0.0509831503967224[/C][/ROW]
[ROW][C]46[/C][C]3.21[/C][C]3.2510692612549[/C][C]-0.0410692612549018[/C][/ROW]
[ROW][C]47[/C][C]3.12[/C][C]3.16139269621436[/C][C]-0.0413926962143606[/C][/ROW]
[ROW][C]48[/C][C]3.04[/C][C]2.98201228014275[/C][C]0.057987719857251[/C][/ROW]
[/TABLE]
Source: https://freestatistics.org/blog/index.php?pk=57517&T=4

Globally Unique Identifier (entire table): ba.freestatistics.org/blog/index.php?pk=57517&T=4

As an alternative you can also use a QR Code:  

The GUIDs for individual cells are displayed in the table below:

Multiple Linear Regression - Actuals, Interpolation, and Residuals
Time or IndexActualsInterpolationForecastResidualsPrediction Error
12.973.05321092845207-0.0832109284520703
23.023.02167115517124-0.00167115517124363
33.073.015413258367230.0545867416327652
43.183.10682060819070.0731793918092982
53.293.32191415168089-0.0319141516808896
63.433.44074452217412-0.0107445221741233
73.613.572258774930240.0377412250697556
83.743.8380031840895-0.0980031840894992
93.873.92323039151194-0.0532303915119448
103.883.9915128458779-0.111512845877897
114.094.038398542443910.0516014575560893
124.194.31849174625441-0.128491746254406
134.24.26838807073998-0.0683880707399832
144.294.253804157402390.0361958425976128
154.374.330599500353390.0394004996466066
164.474.393514588149470.0764854118505262
174.614.552904750473950.0570952495260492
184.654.7540901647934-0.104090164793398
194.694.615237112115320.0747628878846814
204.824.775911496216340.0440885037836637
214.864.97828863788755-0.118288637887551
224.874.779083756697440.090916243302561
235.014.992274537067530.0177254629324665
245.035.0533771179985-0.0233771179985028
255.134.980088897581930.149911102418068
265.185.22656380431092-0.0465638043109186
275.215.047395690890140.162604309109864
285.265.169350561246370.0906494387536255
295.255.25638137412178-0.00638137412177796
305.25.2136861464644-0.0136861464643993
315.165.121817141556530.0381828584434746
325.195.152906939559380.0370930604406221
335.395.269464120997230.120535879002774
345.585.518334136169760.0616658638302374
355.765.7879342242742-0.0279342242741952
365.895.796118855604340.0938811443956576
375.985.978312103226020.00168789677398566
386.026.007960883115450.0120391168845495
395.625.87659155038924-0.256591550389236
404.875.11031424241345-0.24031424241345
414.244.25879972372338-0.0187997237233816
424.023.891479166568080.128520833431921
433.743.89068697139791-0.150686971397912
443.453.433178380134790.0168216198652134
453.343.289016849603280.0509831503967224
463.213.2510692612549-0.0410692612549018
473.123.16139269621436-0.0413926962143606
483.042.982012280142750.057987719857251


Goldfeld-Quandt test for Heteroskedasticity
p-valuesAlternative Hypothesis
breakpoint indexgreater2-sidedless
220.09726459761344160.1945291952268830.902735402386558
230.07038160526427150.1407632105285430.929618394735728
240.02468726339533230.04937452679066460.975312736604668
250.03348004152679990.06696008305359990.9665199584732
260.1888253548370660.3776507096741320.811174645162934

\begin{tabular}{lllllllll}
\hline
Goldfeld-Quandt test for Heteroskedasticity \tabularnewline
p-values & Alternative Hypothesis \tabularnewline
breakpoint index & greater & 2-sided & less \tabularnewline
22 & 0.0972645976134416 & 0.194529195226883 & 0.902735402386558 \tabularnewline
23 & 0.0703816052642715 & 0.140763210528543 & 0.929618394735728 \tabularnewline
24 & 0.0246872633953323 & 0.0493745267906646 & 0.975312736604668 \tabularnewline
25 & 0.0334800415267999 & 0.0669600830535999 & 0.9665199584732 \tabularnewline
26 & 0.188825354837066 & 0.377650709674132 & 0.811174645162934 \tabularnewline
\hline
\end{tabular}
%Source: https://freestatistics.org/blog/index.php?pk=57517&T=5

[TABLE]
[ROW][C]Goldfeld-Quandt test for Heteroskedasticity[/C][/ROW]
[ROW][C]p-values[/C][C]Alternative Hypothesis[/C][/ROW]
[ROW][C]breakpoint index[/C][C]greater[/C][C]2-sided[/C][C]less[/C][/ROW]
[ROW][C]22[/C][C]0.0972645976134416[/C][C]0.194529195226883[/C][C]0.902735402386558[/C][/ROW]
[ROW][C]23[/C][C]0.0703816052642715[/C][C]0.140763210528543[/C][C]0.929618394735728[/C][/ROW]
[ROW][C]24[/C][C]0.0246872633953323[/C][C]0.0493745267906646[/C][C]0.975312736604668[/C][/ROW]
[ROW][C]25[/C][C]0.0334800415267999[/C][C]0.0669600830535999[/C][C]0.9665199584732[/C][/ROW]
[ROW][C]26[/C][C]0.188825354837066[/C][C]0.377650709674132[/C][C]0.811174645162934[/C][/ROW]
[/TABLE]
Source: https://freestatistics.org/blog/index.php?pk=57517&T=5

Globally Unique Identifier (entire table): ba.freestatistics.org/blog/index.php?pk=57517&T=5

As an alternative you can also use a QR Code:  

The GUIDs for individual cells are displayed in the table below:

Goldfeld-Quandt test for Heteroskedasticity
p-valuesAlternative Hypothesis
breakpoint indexgreater2-sidedless
220.09726459761344160.1945291952268830.902735402386558
230.07038160526427150.1407632105285430.929618394735728
240.02468726339533230.04937452679066460.975312736604668
250.03348004152679990.06696008305359990.9665199584732
260.1888253548370660.3776507096741320.811174645162934


Meta Analysis of Goldfeld-Quandt test for Heteroskedasticity
Description# significant tests% significant testsOK/NOK
1% type I error level00OK
5% type I error level10.2NOK
10% type I error level20.4NOK

\begin{tabular}{lllllllll}
\hline
Meta Analysis of Goldfeld-Quandt test for Heteroskedasticity \tabularnewline
Description & # significant tests & % significant tests & OK/NOK \tabularnewline
1% type I error level & 0 & 0 & OK \tabularnewline
5% type I error level & 1 & 0.2 & NOK \tabularnewline
10% type I error level & 2 & 0.4 & NOK \tabularnewline
\hline
\end{tabular}
%Source: https://freestatistics.org/blog/index.php?pk=57517&T=6

[TABLE]
[ROW][C]Meta Analysis of Goldfeld-Quandt test for Heteroskedasticity[/C][/ROW]
[ROW][C]Description[/C][C]# significant tests[/C][C]% significant tests[/C][C]OK/NOK[/C][/ROW]
[ROW][C]1% type I error level[/C][C]0[/C][C]0[/C][C]OK[/C][/ROW]
[ROW][C]5% type I error level[/C][C]1[/C][C]0.2[/C][C]NOK[/C][/ROW]
[ROW][C]10% type I error level[/C][C]2[/C][C]0.4[/C][C]NOK[/C][/ROW]
[/TABLE]
Source: https://freestatistics.org/blog/index.php?pk=57517&T=6

Globally Unique Identifier (entire table): ba.freestatistics.org/blog/index.php?pk=57517&T=6

As an alternative you can also use a QR Code:  

The GUIDs for individual cells are displayed in the table below:

Meta Analysis of Goldfeld-Quandt test for Heteroskedasticity
Description# significant tests% significant testsOK/NOK
1% type I error level00OK
5% type I error level10.2NOK
10% type I error level20.4NOK


Parameters (Session):
Parameters (R input):
par1 = 1 ; par2 = Include Monthly Dummies ; par3 = Linear Trend ;
R code (references can be found in the software module):
library(lattice)
library(lmtest)
n25 <- 25 #minimum number of obs. for Goldfeld-Quandt test
par1 <- as.numeric(par1)
x <- t(y)
k <- length(x[1,])
n <- length(x[,1])
x1 <- cbind(x[,par1], x[,1:k!=par1])
mycolnames <- c(colnames(x)[par1], colnames(x)[1:k!=par1])
colnames(x1) <- mycolnames #colnames(x)[par1]
x <- x1
if (par3 == 'First Differences'){
x2 <- array(0, dim=c(n-1,k), dimnames=list(1:(n-1), paste('(1-B)',colnames(x),sep='')))
for (i in 1:n-1) {
for (j in 1:k) {
x2[i,j] <- x[i+1,j] - x[i,j]
}
}
x <- x2
}
if (par2 == 'Include Monthly Dummies'){
x2 <- array(0, dim=c(n,11), dimnames=list(1:n, paste('M', seq(1:11), sep ='')))
for (i in 1:11){
x2[seq(i,n,12),i] <- 1
}
x <- cbind(x, x2)
}
if (par2 == 'Include Quarterly Dummies'){
x2 <- array(0, dim=c(n,3), dimnames=list(1:n, paste('Q', seq(1:3), sep ='')))
for (i in 1:3){
x2[seq(i,n,4),i] <- 1
}
x <- cbind(x, x2)
}
k <- length(x[1,])
if (par3 == 'Linear Trend'){
x <- cbind(x, c(1:n))
colnames(x)[k+1] <- 't'
}
x
k <- length(x[1,])
df <- as.data.frame(x)
(mylm <- lm(df))
(mysum <- summary(mylm))
if (n > n25) {
kp3 <- k + 3
nmkm3 <- n - k - 3
gqarr <- array(NA, dim=c(nmkm3-kp3+1,3))
numgqtests <- 0
numsignificant1 <- 0
numsignificant5 <- 0
numsignificant10 <- 0
for (mypoint in kp3:nmkm3) {
j <- 0
numgqtests <- numgqtests + 1
for (myalt in c('greater', 'two.sided', 'less')) {
j <- j + 1
gqarr[mypoint-kp3+1,j] <- gqtest(mylm, point=mypoint, alternative=myalt)$p.value
}
if (gqarr[mypoint-kp3+1,2] < 0.01) numsignificant1 <- numsignificant1 + 1
if (gqarr[mypoint-kp3+1,2] < 0.05) numsignificant5 <- numsignificant5 + 1
if (gqarr[mypoint-kp3+1,2] < 0.10) numsignificant10 <- numsignificant10 + 1
}
gqarr
}
bitmap(file='test0.png')
plot(x[,1], type='l', main='Actuals and Interpolation', ylab='value of Actuals and Interpolation (dots)', xlab='time or index')
points(x[,1]-mysum$resid)
grid()
dev.off()
bitmap(file='test1.png')
plot(mysum$resid, type='b', pch=19, main='Residuals', ylab='value of Residuals', xlab='time or index')
grid()
dev.off()
bitmap(file='test2.png')
hist(mysum$resid, main='Residual Histogram', xlab='values of Residuals')
grid()
dev.off()
bitmap(file='test3.png')
densityplot(~mysum$resid,col='black',main='Residual Density Plot', xlab='values of Residuals')
dev.off()
bitmap(file='test4.png')
qqnorm(mysum$resid, main='Residual Normal Q-Q Plot')
qqline(mysum$resid)
grid()
dev.off()
(myerror <- as.ts(mysum$resid))
bitmap(file='test5.png')
dum <- cbind(lag(myerror,k=1),myerror)
dum
dum1 <- dum[2:length(myerror),]
dum1
z <- as.data.frame(dum1)
z
plot(z,main=paste('Residual Lag plot, lowess, and regression line'), ylab='values of Residuals', xlab='lagged values of Residuals')
lines(lowess(z))
abline(lm(z))
grid()
dev.off()
bitmap(file='test6.png')
acf(mysum$resid, lag.max=length(mysum$resid)/2, main='Residual Autocorrelation Function')
grid()
dev.off()
bitmap(file='test7.png')
pacf(mysum$resid, lag.max=length(mysum$resid)/2, main='Residual Partial Autocorrelation Function')
grid()
dev.off()
bitmap(file='test8.png')
opar <- par(mfrow = c(2,2), oma = c(0, 0, 1.1, 0))
plot(mylm, las = 1, sub='Residual Diagnostics')
par(opar)
dev.off()
if (n > n25) {
bitmap(file='test9.png')
plot(kp3:nmkm3,gqarr[,2], main='Goldfeld-Quandt test',ylab='2-sided p-value',xlab='breakpoint')
grid()
dev.off()
}
load(file='createtable')
a<-table.start()
a<-table.row.start(a)
a<-table.element(a, 'Multiple Linear Regression - Estimated Regression Equation', 1, TRUE)
a<-table.row.end(a)
myeq <- colnames(x)[1]
myeq <- paste(myeq, '[t] = ', sep='')
for (i in 1:k){
if (mysum$coefficients[i,1] > 0) myeq <- paste(myeq, '+', '')
myeq <- paste(myeq, mysum$coefficients[i,1], sep=' ')
if (rownames(mysum$coefficients)[i] != '(Intercept)') {
myeq <- paste(myeq, rownames(mysum$coefficients)[i], sep='')
if (rownames(mysum$coefficients)[i] != 't') myeq <- paste(myeq, '[t]', sep='')
}
}
myeq <- paste(myeq, ' + e[t]')
a<-table.row.start(a)
a<-table.element(a, myeq)
a<-table.row.end(a)
a<-table.end(a)
table.save(a,file='mytable1.tab')
a<-table.start()
a<-table.row.start(a)
a<-table.element(a,hyperlink('ols1.htm','Multiple Linear Regression - Ordinary Least Squares',''), 6, TRUE)
a<-table.row.end(a)
a<-table.row.start(a)
a<-table.element(a,'Variable',header=TRUE)
a<-table.element(a,'Parameter',header=TRUE)
a<-table.element(a,'S.D.',header=TRUE)
a<-table.element(a,'T-STAT
H0: parameter = 0',header=TRUE)
a<-table.element(a,'2-tail p-value',header=TRUE)
a<-table.element(a,'1-tail p-value',header=TRUE)
a<-table.row.end(a)
for (i in 1:k){
a<-table.row.start(a)
a<-table.element(a,rownames(mysum$coefficients)[i],header=TRUE)
a<-table.element(a,mysum$coefficients[i,1])
a<-table.element(a, round(mysum$coefficients[i,2],6))
a<-table.element(a, round(mysum$coefficients[i,3],4))
a<-table.element(a, round(mysum$coefficients[i,4],6))
a<-table.element(a, round(mysum$coefficients[i,4]/2,6))
a<-table.row.end(a)
}
a<-table.end(a)
table.save(a,file='mytable2.tab')
a<-table.start()
a<-table.row.start(a)
a<-table.element(a, 'Multiple Linear Regression - Regression Statistics', 2, TRUE)
a<-table.row.end(a)
a<-table.row.start(a)
a<-table.element(a, 'Multiple R',1,TRUE)
a<-table.element(a, sqrt(mysum$r.squared))
a<-table.row.end(a)
a<-table.row.start(a)
a<-table.element(a, 'R-squared',1,TRUE)
a<-table.element(a, mysum$r.squared)
a<-table.row.end(a)
a<-table.row.start(a)
a<-table.element(a, 'Adjusted R-squared',1,TRUE)
a<-table.element(a, mysum$adj.r.squared)
a<-table.row.end(a)
a<-table.row.start(a)
a<-table.element(a, 'F-TEST (value)',1,TRUE)
a<-table.element(a, mysum$fstatistic[1])
a<-table.row.end(a)
a<-table.row.start(a)
a<-table.element(a, 'F-TEST (DF numerator)',1,TRUE)
a<-table.element(a, mysum$fstatistic[2])
a<-table.row.end(a)
a<-table.row.start(a)
a<-table.element(a, 'F-TEST (DF denominator)',1,TRUE)
a<-table.element(a, mysum$fstatistic[3])
a<-table.row.end(a)
a<-table.row.start(a)
a<-table.element(a, 'p-value',1,TRUE)
a<-table.element(a, 1-pf(mysum$fstatistic[1],mysum$fstatistic[2],mysum$fstatistic[3]))
a<-table.row.end(a)
a<-table.row.start(a)
a<-table.element(a, 'Multiple Linear Regression - Residual Statistics', 2, TRUE)
a<-table.row.end(a)
a<-table.row.start(a)
a<-table.element(a, 'Residual Standard Deviation',1,TRUE)
a<-table.element(a, mysum$sigma)
a<-table.row.end(a)
a<-table.row.start(a)
a<-table.element(a, 'Sum Squared Residuals',1,TRUE)
a<-table.element(a, sum(myerror*myerror))
a<-table.row.end(a)
a<-table.end(a)
table.save(a,file='mytable3.tab')
a<-table.start()
a<-table.row.start(a)
a<-table.element(a, 'Multiple Linear Regression - Actuals, Interpolation, and Residuals', 4, TRUE)
a<-table.row.end(a)
a<-table.row.start(a)
a<-table.element(a, 'Time or Index', 1, TRUE)
a<-table.element(a, 'Actuals', 1, TRUE)
a<-table.element(a, 'Interpolation
Forecast', 1, TRUE)
a<-table.element(a, 'Residuals
Prediction Error', 1, TRUE)
a<-table.row.end(a)
for (i in 1:n) {
a<-table.row.start(a)
a<-table.element(a,i, 1, TRUE)
a<-table.element(a,x[i])
a<-table.element(a,x[i]-mysum$resid[i])
a<-table.element(a,mysum$resid[i])
a<-table.row.end(a)
}
a<-table.end(a)
table.save(a,file='mytable4.tab')
if (n > n25) {
a<-table.start()
a<-table.row.start(a)
a<-table.element(a,'Goldfeld-Quandt test for Heteroskedasticity',4,TRUE)
a<-table.row.end(a)
a<-table.row.start(a)
a<-table.element(a,'p-values',header=TRUE)
a<-table.element(a,'Alternative Hypothesis',3,header=TRUE)
a<-table.row.end(a)
a<-table.row.start(a)
a<-table.element(a,'breakpoint index',header=TRUE)
a<-table.element(a,'greater',header=TRUE)
a<-table.element(a,'2-sided',header=TRUE)
a<-table.element(a,'less',header=TRUE)
a<-table.row.end(a)
for (mypoint in kp3:nmkm3) {
a<-table.row.start(a)
a<-table.element(a,mypoint,header=TRUE)
a<-table.element(a,gqarr[mypoint-kp3+1,1])
a<-table.element(a,gqarr[mypoint-kp3+1,2])
a<-table.element(a,gqarr[mypoint-kp3+1,3])
a<-table.row.end(a)
}
a<-table.end(a)
table.save(a,file='mytable5.tab')
a<-table.start()
a<-table.row.start(a)
a<-table.element(a,'Meta Analysis of Goldfeld-Quandt test for Heteroskedasticity',4,TRUE)
a<-table.row.end(a)
a<-table.row.start(a)
a<-table.element(a,'Description',header=TRUE)
a<-table.element(a,'# significant tests',header=TRUE)
a<-table.element(a,'% significant tests',header=TRUE)
a<-table.element(a,'OK/NOK',header=TRUE)
a<-table.row.end(a)
a<-table.row.start(a)
a<-table.element(a,'1% type I error level',header=TRUE)
a<-table.element(a,numsignificant1)
a<-table.element(a,numsignificant1/numgqtests)
if (numsignificant1/numgqtests < 0.01) dum <- 'OK' else dum <- 'NOK'
a<-table.element(a,dum)
a<-table.row.end(a)
a<-table.row.start(a)
a<-table.element(a,'5% type I error level',header=TRUE)
a<-table.element(a,numsignificant5)
a<-table.element(a,numsignificant5/numgqtests)
if (numsignificant5/numgqtests < 0.05) dum <- 'OK' else dum <- 'NOK'
a<-table.element(a,dum)
a<-table.row.end(a)
a<-table.row.start(a)
a<-table.element(a,'10% type I error level',header=TRUE)
a<-table.element(a,numsignificant10)
a<-table.element(a,numsignificant10/numgqtests)
if (numsignificant10/numgqtests < 0.1) dum <- 'OK' else dum <- 'NOK'
a<-table.element(a,dum)
a<-table.row.end(a)
a<-table.end(a)
table.save(a,file='mytable6.tab')
}