Free Statistics

of Irreproducible Research!

Author's title

Author*The author of this computation has been verified*
R Software Modulerwasp_multipleregression.wasp
Title produced by softwareMultiple Regression
Date of computationWed, 18 Nov 2009 10:47:31 -0700
Cite this page as followsStatistical Computations at FreeStatistics.org, Office for Research Development and Education, URL https://freestatistics.org/blog/index.php?v=date/2009/Nov/18/t1258566577b3y662y6rpzaiwn.htm/, Retrieved Sun, 05 May 2024 15:15:35 +0000
Statistical Computations at FreeStatistics.org, Office for Research Development and Education, URL https://freestatistics.org/blog/index.php?pk=57552, Retrieved Sun, 05 May 2024 15:15:35 +0000
QR Codes:

Original text written by user:
IsPrivate?No (this computation is public)
User-defined keywords
Estimated Impact133
Family? (F = Feedback message, R = changed R code, M = changed R Module, P = changed Parameters, D = changed Data)
-     [Multiple Regression] [Q1 The Seatbeltlaw] [2007-11-14 19:27:43] [8cd6641b921d30ebe00b648d1481bba0]
- RMPD  [Multiple Regression] [Seatbelt] [2009-11-12 13:54:52] [b98453cac15ba1066b407e146608df68]
-   PD      [Multiple Regression] [Multiple Regressi...] [2009-11-18 17:47:31] [b58cdc967a53abb3723a2bc8f9332128] [Current]
Feedback Forum

Post a new message
Dataseries X:
4	7.2	102.9	271244
4.1	7.4	97.4	269907
4	8.8	111.4	271296
3.8	9.3	87.4	270157
4.7	9.3	96.8	271322
4.3	8.7	114.1	267179
3.9	8.2	110.3	264101
4	8.3	103.9	265518
4.3	8.5	101.6	269419
4.8	8.6	94.6	268714
4.4	8.5	95.9	272482
4.3	8.2	104.7	268351
4.7	8.1	102.8	268175
4.7	7.9	98.1	270674
4.9	8.6	113.9	272764
5	8.7	80.9	272599
4.2	8.7	95.7	270333
4.3	8.5	113.2	270846
4.8	8.4	105.9	270491
4.8	8.5	108.8	269160
4.8	8.7	102.3	274027
4.2	8.7	99	273784
4.6	8.6	100.7	276663
4.8	8.5	115.5	274525
4.5	8.3	100.7	271344
4.4	8	109.9	271115
4.3	8.2	114.6	270798
3.9	8.1	85.4	273911
3.7	8.1	100.5	273985
4	8	114.8	271917
4.1	7.9	116.5	273338
3.7	7.9	112.9	270601
3.8	8	102	273547
3.8	8	106	275363
3.8	7.9	105.3	281229
3.3	8	118.8	277793
3.3	7.7	106.1	279913
3.3	7.2	109.3	282500
3.2	7.5	117.2	280041
3.4	7.3	92.5	282166
4.2	7	104.2	290304
4.9	7	112.5	283519
5.1	7	122.4	287816
5.5	7.2	113.3	285226
5.6	7.3	100	287595
6.4	7.1	110.7	289741
6.1	6.8	112.8	289148
7.1	6.4	109.8	288301
7.8	6.1	117.3	290155
7.9	6.5	109.1	289648
7.4	7.7	115.9	288225
7.5	7.9	96	289351
6.8	7.5	99.8	294735
5.2	6.9	116.8	305333
4.7	6.6	115.7	309030
4.1	6.9	99.4	310215
3.9	7.7	94.3	321935
2.6	8	91	325734
2.7	8	93.2	320846
1.8	7.7	103.1	323023
1	7.3	94.1	319753
0.3	7.4	91.8	321753
1.3	8.1	102.7	320757
1	8.3	82.6	324479
1.1	8.2	89.1	324641


Summary of computational transaction
Raw Inputview raw input (R code)
Raw Outputview raw output of R engine
Computing time3 seconds
R Server'Gwilym Jenkins' @ 72.249.127.135

\begin{tabular}{lllllllll}
\hline
Summary of computational transaction \tabularnewline
Raw Input & view raw input (R code)  \tabularnewline
Raw Output & view raw output of R engine  \tabularnewline
Computing time & 3 seconds \tabularnewline
R Server & 'Gwilym Jenkins' @ 72.249.127.135 \tabularnewline
\hline
\end{tabular}
%Source: https://freestatistics.org/blog/index.php?pk=57552&T=0

[TABLE]
[ROW][C]Summary of computational transaction[/C][/ROW]
[ROW][C]Raw Input[/C][C]view raw input (R code) [/C][/ROW]
[ROW][C]Raw Output[/C][C]view raw output of R engine [/C][/ROW]
[ROW][C]Computing time[/C][C]3 seconds[/C][/ROW]
[ROW][C]R Server[/C][C]'Gwilym Jenkins' @ 72.249.127.135[/C][/ROW]
[/TABLE]
Source: https://freestatistics.org/blog/index.php?pk=57552&T=0

Globally Unique Identifier (entire table): ba.freestatistics.org/blog/index.php?pk=57552&T=0

As an alternative you can also use a QR Code:  

The GUIDs for individual cells are displayed in the table below:

Summary of computational transaction
Raw Inputview raw input (R code)
Raw Outputview raw output of R engine
Computing time3 seconds
R Server'Gwilym Jenkins' @ 72.249.127.135


Multiple Linear Regression - Estimated Regression Equation
Cons.index[t] = + 31.0503934631203 -0.855669637876198Werkl.graad[t] + 0.00418233696733515Industr.prod.[t] -7.5847943119858e-05BrutoSchuld[t] + 0.0336106524518894t + e[t]

\begin{tabular}{lllllllll}
\hline
Multiple Linear Regression - Estimated Regression Equation \tabularnewline
Cons.index[t] =  +  31.0503934631203 -0.855669637876198Werkl.graad[t] +  0.00418233696733515Industr.prod.[t] -7.5847943119858e-05BrutoSchuld[t] +  0.0336106524518894t  + e[t] \tabularnewline
\hline
\end{tabular}
%Source: https://freestatistics.org/blog/index.php?pk=57552&T=1

[TABLE]
[ROW][C]Multiple Linear Regression - Estimated Regression Equation[/C][/ROW]
[ROW][C]Cons.index[t] =  +  31.0503934631203 -0.855669637876198Werkl.graad[t] +  0.00418233696733515Industr.prod.[t] -7.5847943119858e-05BrutoSchuld[t] +  0.0336106524518894t  + e[t][/C][/ROW]
[/TABLE]
Source: https://freestatistics.org/blog/index.php?pk=57552&T=1

Globally Unique Identifier (entire table): ba.freestatistics.org/blog/index.php?pk=57552&T=1

As an alternative you can also use a QR Code:  

The GUIDs for individual cells are displayed in the table below:

Multiple Linear Regression - Estimated Regression Equation
Cons.index[t] = + 31.0503934631203 -0.855669637876198Werkl.graad[t] + 0.00418233696733515Industr.prod.[t] -7.5847943119858e-05BrutoSchuld[t] + 0.0336106524518894t + e[t]


Multiple Linear Regression - Ordinary Least Squares
VariableParameterS.D.T-STATH0: parameter = 02-tail p-value1-tail p-value
(Intercept)31.05039346312036.8890194.50723.1e-051.6e-05
Werkl.graad-0.8556696378761980.304314-2.81180.0066470.003323
Industr.prod.0.004182336967335150.0195470.2140.8312990.41565
BrutoSchuld-7.5847943119858e-052e-05-3.74840.0004020.000201
t0.03361065245188940.020781.61740.1110320.055516

\begin{tabular}{lllllllll}
\hline
Multiple Linear Regression - Ordinary Least Squares \tabularnewline
Variable & Parameter & S.D. & T-STATH0: parameter = 0 & 2-tail p-value & 1-tail p-value \tabularnewline
(Intercept) & 31.0503934631203 & 6.889019 & 4.5072 & 3.1e-05 & 1.6e-05 \tabularnewline
Werkl.graad & -0.855669637876198 & 0.304314 & -2.8118 & 0.006647 & 0.003323 \tabularnewline
Industr.prod. & 0.00418233696733515 & 0.019547 & 0.214 & 0.831299 & 0.41565 \tabularnewline
BrutoSchuld & -7.5847943119858e-05 & 2e-05 & -3.7484 & 0.000402 & 0.000201 \tabularnewline
t & 0.0336106524518894 & 0.02078 & 1.6174 & 0.111032 & 0.055516 \tabularnewline
\hline
\end{tabular}
%Source: https://freestatistics.org/blog/index.php?pk=57552&T=2

[TABLE]
[ROW][C]Multiple Linear Regression - Ordinary Least Squares[/C][/ROW]
[ROW][C]Variable[/C][C]Parameter[/C][C]S.D.[/C][C]T-STATH0: parameter = 0[/C][C]2-tail p-value[/C][C]1-tail p-value[/C][/ROW]
[ROW][C](Intercept)[/C][C]31.0503934631203[/C][C]6.889019[/C][C]4.5072[/C][C]3.1e-05[/C][C]1.6e-05[/C][/ROW]
[ROW][C]Werkl.graad[/C][C]-0.855669637876198[/C][C]0.304314[/C][C]-2.8118[/C][C]0.006647[/C][C]0.003323[/C][/ROW]
[ROW][C]Industr.prod.[/C][C]0.00418233696733515[/C][C]0.019547[/C][C]0.214[/C][C]0.831299[/C][C]0.41565[/C][/ROW]
[ROW][C]BrutoSchuld[/C][C]-7.5847943119858e-05[/C][C]2e-05[/C][C]-3.7484[/C][C]0.000402[/C][C]0.000201[/C][/ROW]
[ROW][C]t[/C][C]0.0336106524518894[/C][C]0.02078[/C][C]1.6174[/C][C]0.111032[/C][C]0.055516[/C][/ROW]
[/TABLE]
Source: https://freestatistics.org/blog/index.php?pk=57552&T=2

Globally Unique Identifier (entire table): ba.freestatistics.org/blog/index.php?pk=57552&T=2

As an alternative you can also use a QR Code:  

The GUIDs for individual cells are displayed in the table below:

Multiple Linear Regression - Ordinary Least Squares
VariableParameterS.D.T-STATH0: parameter = 02-tail p-value1-tail p-value
(Intercept)31.05039346312036.8890194.50723.1e-051.6e-05
Werkl.graad-0.8556696378761980.304314-2.81180.0066470.003323
Industr.prod.0.004182336967335150.0195470.2140.8312990.41565
BrutoSchuld-7.5847943119858e-052e-05-3.74840.0004020.000201
t0.03361065245188940.020781.61740.1110320.055516


Multiple Linear Regression - Regression Statistics
Multiple R0.643250979798282
R-squared0.413771823011449
Adjusted R-squared0.374689944545546
F-TEST (value)10.5873064257247
F-TEST (DF numerator)4
F-TEST (DF denominator)60
p-value1.47751398660301e-06
Multiple Linear Regression - Residual Statistics
Residual Standard Deviation1.21493556878008
Sum Squared Residuals88.5641061772192

\begin{tabular}{lllllllll}
\hline
Multiple Linear Regression - Regression Statistics \tabularnewline
Multiple R & 0.643250979798282 \tabularnewline
R-squared & 0.413771823011449 \tabularnewline
Adjusted R-squared & 0.374689944545546 \tabularnewline
F-TEST (value) & 10.5873064257247 \tabularnewline
F-TEST (DF numerator) & 4 \tabularnewline
F-TEST (DF denominator) & 60 \tabularnewline
p-value & 1.47751398660301e-06 \tabularnewline
Multiple Linear Regression - Residual Statistics \tabularnewline
Residual Standard Deviation & 1.21493556878008 \tabularnewline
Sum Squared Residuals & 88.5641061772192 \tabularnewline
\hline
\end{tabular}
%Source: https://freestatistics.org/blog/index.php?pk=57552&T=3

[TABLE]
[ROW][C]Multiple Linear Regression - Regression Statistics[/C][/ROW]
[ROW][C]Multiple R[/C][C]0.643250979798282[/C][/ROW]
[ROW][C]R-squared[/C][C]0.413771823011449[/C][/ROW]
[ROW][C]Adjusted R-squared[/C][C]0.374689944545546[/C][/ROW]
[ROW][C]F-TEST (value)[/C][C]10.5873064257247[/C][/ROW]
[ROW][C]F-TEST (DF numerator)[/C][C]4[/C][/ROW]
[ROW][C]F-TEST (DF denominator)[/C][C]60[/C][/ROW]
[ROW][C]p-value[/C][C]1.47751398660301e-06[/C][/ROW]
[ROW][C]Multiple Linear Regression - Residual Statistics[/C][/ROW]
[ROW][C]Residual Standard Deviation[/C][C]1.21493556878008[/C][/ROW]
[ROW][C]Sum Squared Residuals[/C][C]88.5641061772192[/C][/ROW]
[/TABLE]
Source: https://freestatistics.org/blog/index.php?pk=57552&T=3

Globally Unique Identifier (entire table): ba.freestatistics.org/blog/index.php?pk=57552&T=3

As an alternative you can also use a QR Code:  

The GUIDs for individual cells are displayed in the table below:

Multiple Linear Regression - Regression Statistics
Multiple R0.643250979798282
R-squared0.413771823011449
Adjusted R-squared0.374689944545546
F-TEST (value)10.5873064257247
F-TEST (DF numerator)4
F-TEST (DF denominator)60
p-value1.47751398660301e-06
Multiple Linear Regression - Residual Statistics
Residual Standard Deviation1.21493556878008
Sum Squared Residuals88.5641061772192


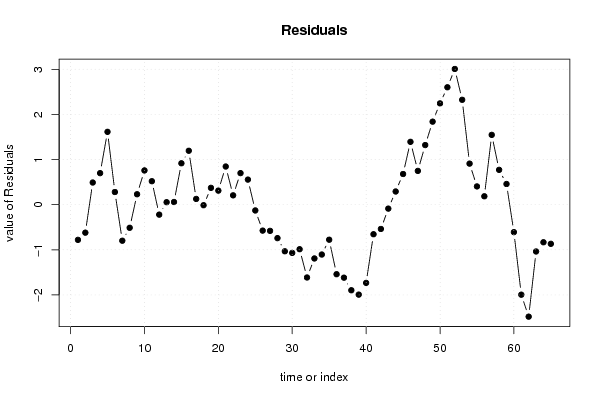
Multiple Linear Regression - Actuals, Interpolation, and Residuals
Time or IndexActualsInterpolationForecastResidualsPrediction Error
144.78024571319966-0.780245713199663
24.14.72112828470714-0.621128284707141
343.510001368681560.489998631318439
43.83.101791922192820.698208077807177
54.73.086353688403031.61364631159697
64.34.019958581461110.280041418538888
73.94.69897114129815-0.79897114129815
844.51277133797063-0.512771337970634
94.34.069745861711850.230254138288152
104.84.041985991504270.758014008495728
114.43.880805596125690.519194403874309
124.34.52124955828112-0.221249558281123
134.74.645829972271790.05417002772821
144.74.641373558695920.0586264413040822
154.93.983574187597860.916425812402138
1653.806115666954851.19388433304515
174.24.073496345632900.126503654367104
184.34.3125218277679-0.0125218277679028
194.84.428094403953410.371905596046585
204.84.489220482115490.310779517884513
214.83.955360077540110.84463992245989
224.23.993600068177920.206399931822081
234.63.901521429019830.698478570980173
244.84.244760534766150.555239465233848
254.54.62887883474099-0.128878834740988
264.44.97503705762967-0.575037057629668
274.34.88121456422179-0.58121456422179
283.94.64215329408299-0.742153294082993
293.74.73330448695077-1.03330448695077
3045.06914306819504-1.06914306819504
314.15.0876507301057-0.987650730105703
323.75.31380078979424-1.61380078979424
333.84.99280896508345-1.19280896508345
343.84.90540910069902-1.10540910069902
353.84.57673504672031-0.776735046720307
363.34.84185381700343-1.54185381700343
373.34.91825204191893-1.61825204191893
383.35.19686236275331-1.89686236275332
393.25.19332267801602-1.99332267801602
403.45.13358665582028-1.73358665582028
414.24.85558098104344-0.655580981043442
424.95.43853332439245-0.538533324392449
435.15.18763050123493-0.0876305012349274
445.55.208494132389260.291505867610741
455.64.921228962137030.678771037862972
466.45.007954861779431.39204513822057
476.15.352027143495660.747972856504344
487.15.779601848018541.32039815198146
497.85.960658832544091.83934116745591
507.95.656161373875112.24383862612489
517.44.7993399753132.60066002468700
527.54.493183410586723.00681658941328
536.84.476589472907652.32341052709235
545.24.29086513534570.9091348646543
554.74.296166262782270.403833737217734
564.13.91502411870670.184975881293299
573.92.353831248959491.54616875104051
582.61.828792962143970.77120703785603
592.72.242349501893860.457650498106138
601.82.4089452095133-0.608945209513298
6112.99520545841159-1.99520545841159
620.32.78193388581127-2.48193388581127
631.32.33770781604115-1.03770781604115
6411.83381352358225-0.833813523582252
651.11.96788896332402-0.867888963324024

\begin{tabular}{lllllllll}
\hline
Multiple Linear Regression - Actuals, Interpolation, and Residuals \tabularnewline
Time or Index & Actuals & InterpolationForecast & ResidualsPrediction Error \tabularnewline
1 & 4 & 4.78024571319966 & -0.780245713199663 \tabularnewline
2 & 4.1 & 4.72112828470714 & -0.621128284707141 \tabularnewline
3 & 4 & 3.51000136868156 & 0.489998631318439 \tabularnewline
4 & 3.8 & 3.10179192219282 & 0.698208077807177 \tabularnewline
5 & 4.7 & 3.08635368840303 & 1.61364631159697 \tabularnewline
6 & 4.3 & 4.01995858146111 & 0.280041418538888 \tabularnewline
7 & 3.9 & 4.69897114129815 & -0.79897114129815 \tabularnewline
8 & 4 & 4.51277133797063 & -0.512771337970634 \tabularnewline
9 & 4.3 & 4.06974586171185 & 0.230254138288152 \tabularnewline
10 & 4.8 & 4.04198599150427 & 0.758014008495728 \tabularnewline
11 & 4.4 & 3.88080559612569 & 0.519194403874309 \tabularnewline
12 & 4.3 & 4.52124955828112 & -0.221249558281123 \tabularnewline
13 & 4.7 & 4.64582997227179 & 0.05417002772821 \tabularnewline
14 & 4.7 & 4.64137355869592 & 0.0586264413040822 \tabularnewline
15 & 4.9 & 3.98357418759786 & 0.916425812402138 \tabularnewline
16 & 5 & 3.80611566695485 & 1.19388433304515 \tabularnewline
17 & 4.2 & 4.07349634563290 & 0.126503654367104 \tabularnewline
18 & 4.3 & 4.3125218277679 & -0.0125218277679028 \tabularnewline
19 & 4.8 & 4.42809440395341 & 0.371905596046585 \tabularnewline
20 & 4.8 & 4.48922048211549 & 0.310779517884513 \tabularnewline
21 & 4.8 & 3.95536007754011 & 0.84463992245989 \tabularnewline
22 & 4.2 & 3.99360006817792 & 0.206399931822081 \tabularnewline
23 & 4.6 & 3.90152142901983 & 0.698478570980173 \tabularnewline
24 & 4.8 & 4.24476053476615 & 0.555239465233848 \tabularnewline
25 & 4.5 & 4.62887883474099 & -0.128878834740988 \tabularnewline
26 & 4.4 & 4.97503705762967 & -0.575037057629668 \tabularnewline
27 & 4.3 & 4.88121456422179 & -0.58121456422179 \tabularnewline
28 & 3.9 & 4.64215329408299 & -0.742153294082993 \tabularnewline
29 & 3.7 & 4.73330448695077 & -1.03330448695077 \tabularnewline
30 & 4 & 5.06914306819504 & -1.06914306819504 \tabularnewline
31 & 4.1 & 5.0876507301057 & -0.987650730105703 \tabularnewline
32 & 3.7 & 5.31380078979424 & -1.61380078979424 \tabularnewline
33 & 3.8 & 4.99280896508345 & -1.19280896508345 \tabularnewline
34 & 3.8 & 4.90540910069902 & -1.10540910069902 \tabularnewline
35 & 3.8 & 4.57673504672031 & -0.776735046720307 \tabularnewline
36 & 3.3 & 4.84185381700343 & -1.54185381700343 \tabularnewline
37 & 3.3 & 4.91825204191893 & -1.61825204191893 \tabularnewline
38 & 3.3 & 5.19686236275331 & -1.89686236275332 \tabularnewline
39 & 3.2 & 5.19332267801602 & -1.99332267801602 \tabularnewline
40 & 3.4 & 5.13358665582028 & -1.73358665582028 \tabularnewline
41 & 4.2 & 4.85558098104344 & -0.655580981043442 \tabularnewline
42 & 4.9 & 5.43853332439245 & -0.538533324392449 \tabularnewline
43 & 5.1 & 5.18763050123493 & -0.0876305012349274 \tabularnewline
44 & 5.5 & 5.20849413238926 & 0.291505867610741 \tabularnewline
45 & 5.6 & 4.92122896213703 & 0.678771037862972 \tabularnewline
46 & 6.4 & 5.00795486177943 & 1.39204513822057 \tabularnewline
47 & 6.1 & 5.35202714349566 & 0.747972856504344 \tabularnewline
48 & 7.1 & 5.77960184801854 & 1.32039815198146 \tabularnewline
49 & 7.8 & 5.96065883254409 & 1.83934116745591 \tabularnewline
50 & 7.9 & 5.65616137387511 & 2.24383862612489 \tabularnewline
51 & 7.4 & 4.799339975313 & 2.60066002468700 \tabularnewline
52 & 7.5 & 4.49318341058672 & 3.00681658941328 \tabularnewline
53 & 6.8 & 4.47658947290765 & 2.32341052709235 \tabularnewline
54 & 5.2 & 4.2908651353457 & 0.9091348646543 \tabularnewline
55 & 4.7 & 4.29616626278227 & 0.403833737217734 \tabularnewline
56 & 4.1 & 3.9150241187067 & 0.184975881293299 \tabularnewline
57 & 3.9 & 2.35383124895949 & 1.54616875104051 \tabularnewline
58 & 2.6 & 1.82879296214397 & 0.77120703785603 \tabularnewline
59 & 2.7 & 2.24234950189386 & 0.457650498106138 \tabularnewline
60 & 1.8 & 2.4089452095133 & -0.608945209513298 \tabularnewline
61 & 1 & 2.99520545841159 & -1.99520545841159 \tabularnewline
62 & 0.3 & 2.78193388581127 & -2.48193388581127 \tabularnewline
63 & 1.3 & 2.33770781604115 & -1.03770781604115 \tabularnewline
64 & 1 & 1.83381352358225 & -0.833813523582252 \tabularnewline
65 & 1.1 & 1.96788896332402 & -0.867888963324024 \tabularnewline
\hline
\end{tabular}
%Source: https://freestatistics.org/blog/index.php?pk=57552&T=4

[TABLE]
[ROW][C]Multiple Linear Regression - Actuals, Interpolation, and Residuals[/C][/ROW]
[ROW][C]Time or Index[/C][C]Actuals[/C][C]InterpolationForecast[/C][C]ResidualsPrediction Error[/C][/ROW]
[ROW][C]1[/C][C]4[/C][C]4.78024571319966[/C][C]-0.780245713199663[/C][/ROW]
[ROW][C]2[/C][C]4.1[/C][C]4.72112828470714[/C][C]-0.621128284707141[/C][/ROW]
[ROW][C]3[/C][C]4[/C][C]3.51000136868156[/C][C]0.489998631318439[/C][/ROW]
[ROW][C]4[/C][C]3.8[/C][C]3.10179192219282[/C][C]0.698208077807177[/C][/ROW]
[ROW][C]5[/C][C]4.7[/C][C]3.08635368840303[/C][C]1.61364631159697[/C][/ROW]
[ROW][C]6[/C][C]4.3[/C][C]4.01995858146111[/C][C]0.280041418538888[/C][/ROW]
[ROW][C]7[/C][C]3.9[/C][C]4.69897114129815[/C][C]-0.79897114129815[/C][/ROW]
[ROW][C]8[/C][C]4[/C][C]4.51277133797063[/C][C]-0.512771337970634[/C][/ROW]
[ROW][C]9[/C][C]4.3[/C][C]4.06974586171185[/C][C]0.230254138288152[/C][/ROW]
[ROW][C]10[/C][C]4.8[/C][C]4.04198599150427[/C][C]0.758014008495728[/C][/ROW]
[ROW][C]11[/C][C]4.4[/C][C]3.88080559612569[/C][C]0.519194403874309[/C][/ROW]
[ROW][C]12[/C][C]4.3[/C][C]4.52124955828112[/C][C]-0.221249558281123[/C][/ROW]
[ROW][C]13[/C][C]4.7[/C][C]4.64582997227179[/C][C]0.05417002772821[/C][/ROW]
[ROW][C]14[/C][C]4.7[/C][C]4.64137355869592[/C][C]0.0586264413040822[/C][/ROW]
[ROW][C]15[/C][C]4.9[/C][C]3.98357418759786[/C][C]0.916425812402138[/C][/ROW]
[ROW][C]16[/C][C]5[/C][C]3.80611566695485[/C][C]1.19388433304515[/C][/ROW]
[ROW][C]17[/C][C]4.2[/C][C]4.07349634563290[/C][C]0.126503654367104[/C][/ROW]
[ROW][C]18[/C][C]4.3[/C][C]4.3125218277679[/C][C]-0.0125218277679028[/C][/ROW]
[ROW][C]19[/C][C]4.8[/C][C]4.42809440395341[/C][C]0.371905596046585[/C][/ROW]
[ROW][C]20[/C][C]4.8[/C][C]4.48922048211549[/C][C]0.310779517884513[/C][/ROW]
[ROW][C]21[/C][C]4.8[/C][C]3.95536007754011[/C][C]0.84463992245989[/C][/ROW]
[ROW][C]22[/C][C]4.2[/C][C]3.99360006817792[/C][C]0.206399931822081[/C][/ROW]
[ROW][C]23[/C][C]4.6[/C][C]3.90152142901983[/C][C]0.698478570980173[/C][/ROW]
[ROW][C]24[/C][C]4.8[/C][C]4.24476053476615[/C][C]0.555239465233848[/C][/ROW]
[ROW][C]25[/C][C]4.5[/C][C]4.62887883474099[/C][C]-0.128878834740988[/C][/ROW]
[ROW][C]26[/C][C]4.4[/C][C]4.97503705762967[/C][C]-0.575037057629668[/C][/ROW]
[ROW][C]27[/C][C]4.3[/C][C]4.88121456422179[/C][C]-0.58121456422179[/C][/ROW]
[ROW][C]28[/C][C]3.9[/C][C]4.64215329408299[/C][C]-0.742153294082993[/C][/ROW]
[ROW][C]29[/C][C]3.7[/C][C]4.73330448695077[/C][C]-1.03330448695077[/C][/ROW]
[ROW][C]30[/C][C]4[/C][C]5.06914306819504[/C][C]-1.06914306819504[/C][/ROW]
[ROW][C]31[/C][C]4.1[/C][C]5.0876507301057[/C][C]-0.987650730105703[/C][/ROW]
[ROW][C]32[/C][C]3.7[/C][C]5.31380078979424[/C][C]-1.61380078979424[/C][/ROW]
[ROW][C]33[/C][C]3.8[/C][C]4.99280896508345[/C][C]-1.19280896508345[/C][/ROW]
[ROW][C]34[/C][C]3.8[/C][C]4.90540910069902[/C][C]-1.10540910069902[/C][/ROW]
[ROW][C]35[/C][C]3.8[/C][C]4.57673504672031[/C][C]-0.776735046720307[/C][/ROW]
[ROW][C]36[/C][C]3.3[/C][C]4.84185381700343[/C][C]-1.54185381700343[/C][/ROW]
[ROW][C]37[/C][C]3.3[/C][C]4.91825204191893[/C][C]-1.61825204191893[/C][/ROW]
[ROW][C]38[/C][C]3.3[/C][C]5.19686236275331[/C][C]-1.89686236275332[/C][/ROW]
[ROW][C]39[/C][C]3.2[/C][C]5.19332267801602[/C][C]-1.99332267801602[/C][/ROW]
[ROW][C]40[/C][C]3.4[/C][C]5.13358665582028[/C][C]-1.73358665582028[/C][/ROW]
[ROW][C]41[/C][C]4.2[/C][C]4.85558098104344[/C][C]-0.655580981043442[/C][/ROW]
[ROW][C]42[/C][C]4.9[/C][C]5.43853332439245[/C][C]-0.538533324392449[/C][/ROW]
[ROW][C]43[/C][C]5.1[/C][C]5.18763050123493[/C][C]-0.0876305012349274[/C][/ROW]
[ROW][C]44[/C][C]5.5[/C][C]5.20849413238926[/C][C]0.291505867610741[/C][/ROW]
[ROW][C]45[/C][C]5.6[/C][C]4.92122896213703[/C][C]0.678771037862972[/C][/ROW]
[ROW][C]46[/C][C]6.4[/C][C]5.00795486177943[/C][C]1.39204513822057[/C][/ROW]
[ROW][C]47[/C][C]6.1[/C][C]5.35202714349566[/C][C]0.747972856504344[/C][/ROW]
[ROW][C]48[/C][C]7.1[/C][C]5.77960184801854[/C][C]1.32039815198146[/C][/ROW]
[ROW][C]49[/C][C]7.8[/C][C]5.96065883254409[/C][C]1.83934116745591[/C][/ROW]
[ROW][C]50[/C][C]7.9[/C][C]5.65616137387511[/C][C]2.24383862612489[/C][/ROW]
[ROW][C]51[/C][C]7.4[/C][C]4.799339975313[/C][C]2.60066002468700[/C][/ROW]
[ROW][C]52[/C][C]7.5[/C][C]4.49318341058672[/C][C]3.00681658941328[/C][/ROW]
[ROW][C]53[/C][C]6.8[/C][C]4.47658947290765[/C][C]2.32341052709235[/C][/ROW]
[ROW][C]54[/C][C]5.2[/C][C]4.2908651353457[/C][C]0.9091348646543[/C][/ROW]
[ROW][C]55[/C][C]4.7[/C][C]4.29616626278227[/C][C]0.403833737217734[/C][/ROW]
[ROW][C]56[/C][C]4.1[/C][C]3.9150241187067[/C][C]0.184975881293299[/C][/ROW]
[ROW][C]57[/C][C]3.9[/C][C]2.35383124895949[/C][C]1.54616875104051[/C][/ROW]
[ROW][C]58[/C][C]2.6[/C][C]1.82879296214397[/C][C]0.77120703785603[/C][/ROW]
[ROW][C]59[/C][C]2.7[/C][C]2.24234950189386[/C][C]0.457650498106138[/C][/ROW]
[ROW][C]60[/C][C]1.8[/C][C]2.4089452095133[/C][C]-0.608945209513298[/C][/ROW]
[ROW][C]61[/C][C]1[/C][C]2.99520545841159[/C][C]-1.99520545841159[/C][/ROW]
[ROW][C]62[/C][C]0.3[/C][C]2.78193388581127[/C][C]-2.48193388581127[/C][/ROW]
[ROW][C]63[/C][C]1.3[/C][C]2.33770781604115[/C][C]-1.03770781604115[/C][/ROW]
[ROW][C]64[/C][C]1[/C][C]1.83381352358225[/C][C]-0.833813523582252[/C][/ROW]
[ROW][C]65[/C][C]1.1[/C][C]1.96788896332402[/C][C]-0.867888963324024[/C][/ROW]
[/TABLE]
Source: https://freestatistics.org/blog/index.php?pk=57552&T=4

Globally Unique Identifier (entire table): ba.freestatistics.org/blog/index.php?pk=57552&T=4

As an alternative you can also use a QR Code:  

The GUIDs for individual cells are displayed in the table below:

Multiple Linear Regression - Actuals, Interpolation, and Residuals
Time or IndexActualsInterpolationForecastResidualsPrediction Error
144.78024571319966-0.780245713199663
24.14.72112828470714-0.621128284707141
343.510001368681560.489998631318439
43.83.101791922192820.698208077807177
54.73.086353688403031.61364631159697
64.34.019958581461110.280041418538888
73.94.69897114129815-0.79897114129815
844.51277133797063-0.512771337970634
94.34.069745861711850.230254138288152
104.84.041985991504270.758014008495728
114.43.880805596125690.519194403874309
124.34.52124955828112-0.221249558281123
134.74.645829972271790.05417002772821
144.74.641373558695920.0586264413040822
154.93.983574187597860.916425812402138
1653.806115666954851.19388433304515
174.24.073496345632900.126503654367104
184.34.3125218277679-0.0125218277679028
194.84.428094403953410.371905596046585
204.84.489220482115490.310779517884513
214.83.955360077540110.84463992245989
224.23.993600068177920.206399931822081
234.63.901521429019830.698478570980173
244.84.244760534766150.555239465233848
254.54.62887883474099-0.128878834740988
264.44.97503705762967-0.575037057629668
274.34.88121456422179-0.58121456422179
283.94.64215329408299-0.742153294082993
293.74.73330448695077-1.03330448695077
3045.06914306819504-1.06914306819504
314.15.0876507301057-0.987650730105703
323.75.31380078979424-1.61380078979424
333.84.99280896508345-1.19280896508345
343.84.90540910069902-1.10540910069902
353.84.57673504672031-0.776735046720307
363.34.84185381700343-1.54185381700343
373.34.91825204191893-1.61825204191893
383.35.19686236275331-1.89686236275332
393.25.19332267801602-1.99332267801602
403.45.13358665582028-1.73358665582028
414.24.85558098104344-0.655580981043442
424.95.43853332439245-0.538533324392449
435.15.18763050123493-0.0876305012349274
445.55.208494132389260.291505867610741
455.64.921228962137030.678771037862972
466.45.007954861779431.39204513822057
476.15.352027143495660.747972856504344
487.15.779601848018541.32039815198146
497.85.960658832544091.83934116745591
507.95.656161373875112.24383862612489
517.44.7993399753132.60066002468700
527.54.493183410586723.00681658941328
536.84.476589472907652.32341052709235
545.24.29086513534570.9091348646543
554.74.296166262782270.403833737217734
564.13.91502411870670.184975881293299
573.92.353831248959491.54616875104051
582.61.828792962143970.77120703785603
592.72.242349501893860.457650498106138
601.82.4089452095133-0.608945209513298
6112.99520545841159-1.99520545841159
620.32.78193388581127-2.48193388581127
631.32.33770781604115-1.03770781604115
6411.83381352358225-0.833813523582252
651.11.96788896332402-0.867888963324024


Goldfeld-Quandt test for Heteroskedasticity
p-valuesAlternative Hypothesis
breakpoint indexgreater2-sidedless
80.01720469598793210.03440939197586410.982795304012068
90.006276861517745570.01255372303549110.993723138482254
100.002102921928544650.00420584385708930.997897078071455
110.001107748236538110.002215496473076220.998892251763462
120.0002790702064196440.0005581404128392880.99972092979358
137.302159868767e-050.000146043197375340.999926978401312
141.47394775945462e-052.94789551890923e-050.999985260522405
153.09325301297538e-066.18650602595075e-060.999996906746987
167.0737454387759e-071.41474908775518e-060.999999292625456
171.58266287937083e-063.16532575874166e-060.99999841733712
189.08508717730247e-071.81701743546049e-060.999999091491282
192.27512792095077e-074.55025584190154e-070.999999772487208
205.6070071653084e-081.12140143306168e-070.999999943929928
212.00824708413005e-084.0164941682601e-080.99999997991753
226.38891300961908e-081.27778260192382e-070.99999993611087
234.39128555472575e-088.7825711094515e-080.999999956087144
242.64051840185015e-085.28103680370031e-080.999999973594816
251.48716415362895e-082.97432830725789e-080.999999985128359
267.11718967398156e-091.42343793479631e-080.99999999288281
273.93871439778569e-097.87742879557139e-090.999999996061286
281.60931078021616e-083.21862156043231e-080.999999983906892
295.69723635889324e-081.13944727177865e-070.999999943027636
303.04788362032232e-086.09576724064463e-080.999999969521164
311.19460702277785e-082.38921404555569e-080.99999998805393
328.62191959637052e-091.72438391927410e-080.99999999137808
334.30867803534006e-098.61735607068013e-090.999999995691322
342.08174394546268e-094.16348789092537e-090.999999997918256
351.23911734025070e-092.47823468050140e-090.999999998760883
361.86550481412691e-093.73100962825383e-090.999999998134495
371.27877983998987e-092.55755967997973e-090.99999999872122
386.75604726453515e-101.35120945290703e-090.999999999324395
392.59541675438056e-095.19083350876113e-090.999999997404583
404.79013685869854e-099.58027371739708e-090.999999995209863
411.46146768175156e-082.92293536350313e-080.999999985385323
427.89830856095394e-071.57966171219079e-060.999999210169144
431.04472555358398e-052.08945110716795e-050.999989552744464
440.0004488990105439610.0008977980210879220.999551100989456
450.008910459880412580.01782091976082520.991089540119587
460.08843258740636170.1768651748127230.911567412593638
470.6795517631279020.6408964737441970.320448236872098
480.9201775692953130.1596448614093740.079822430704687
490.9377077508937050.1245844982125910.0622922491062954
500.9520914939833660.0958170120332680.047908506016634
510.9663499280265030.0673001439469940.033650071973497
520.961508401266090.07698319746782090.0384915987339104
530.94718061538740.1056387692252010.0528193846126005
540.9385491291318580.1229017417362840.0614508708681419
550.9294662863835050.1410674272329900.0705337136164949
560.8913551733473510.2172896533052980.108644826652649
570.960498033479910.07900393304018160.0395019665200908

\begin{tabular}{lllllllll}
\hline
Goldfeld-Quandt test for Heteroskedasticity \tabularnewline
p-values & Alternative Hypothesis \tabularnewline
breakpoint index & greater & 2-sided & less \tabularnewline
8 & 0.0172046959879321 & 0.0344093919758641 & 0.982795304012068 \tabularnewline
9 & 0.00627686151774557 & 0.0125537230354911 & 0.993723138482254 \tabularnewline
10 & 0.00210292192854465 & 0.0042058438570893 & 0.997897078071455 \tabularnewline
11 & 0.00110774823653811 & 0.00221549647307622 & 0.998892251763462 \tabularnewline
12 & 0.000279070206419644 & 0.000558140412839288 & 0.99972092979358 \tabularnewline
13 & 7.302159868767e-05 & 0.00014604319737534 & 0.999926978401312 \tabularnewline
14 & 1.47394775945462e-05 & 2.94789551890923e-05 & 0.999985260522405 \tabularnewline
15 & 3.09325301297538e-06 & 6.18650602595075e-06 & 0.999996906746987 \tabularnewline
16 & 7.0737454387759e-07 & 1.41474908775518e-06 & 0.999999292625456 \tabularnewline
17 & 1.58266287937083e-06 & 3.16532575874166e-06 & 0.99999841733712 \tabularnewline
18 & 9.08508717730247e-07 & 1.81701743546049e-06 & 0.999999091491282 \tabularnewline
19 & 2.27512792095077e-07 & 4.55025584190154e-07 & 0.999999772487208 \tabularnewline
20 & 5.6070071653084e-08 & 1.12140143306168e-07 & 0.999999943929928 \tabularnewline
21 & 2.00824708413005e-08 & 4.0164941682601e-08 & 0.99999997991753 \tabularnewline
22 & 6.38891300961908e-08 & 1.27778260192382e-07 & 0.99999993611087 \tabularnewline
23 & 4.39128555472575e-08 & 8.7825711094515e-08 & 0.999999956087144 \tabularnewline
24 & 2.64051840185015e-08 & 5.28103680370031e-08 & 0.999999973594816 \tabularnewline
25 & 1.48716415362895e-08 & 2.97432830725789e-08 & 0.999999985128359 \tabularnewline
26 & 7.11718967398156e-09 & 1.42343793479631e-08 & 0.99999999288281 \tabularnewline
27 & 3.93871439778569e-09 & 7.87742879557139e-09 & 0.999999996061286 \tabularnewline
28 & 1.60931078021616e-08 & 3.21862156043231e-08 & 0.999999983906892 \tabularnewline
29 & 5.69723635889324e-08 & 1.13944727177865e-07 & 0.999999943027636 \tabularnewline
30 & 3.04788362032232e-08 & 6.09576724064463e-08 & 0.999999969521164 \tabularnewline
31 & 1.19460702277785e-08 & 2.38921404555569e-08 & 0.99999998805393 \tabularnewline
32 & 8.62191959637052e-09 & 1.72438391927410e-08 & 0.99999999137808 \tabularnewline
33 & 4.30867803534006e-09 & 8.61735607068013e-09 & 0.999999995691322 \tabularnewline
34 & 2.08174394546268e-09 & 4.16348789092537e-09 & 0.999999997918256 \tabularnewline
35 & 1.23911734025070e-09 & 2.47823468050140e-09 & 0.999999998760883 \tabularnewline
36 & 1.86550481412691e-09 & 3.73100962825383e-09 & 0.999999998134495 \tabularnewline
37 & 1.27877983998987e-09 & 2.55755967997973e-09 & 0.99999999872122 \tabularnewline
38 & 6.75604726453515e-10 & 1.35120945290703e-09 & 0.999999999324395 \tabularnewline
39 & 2.59541675438056e-09 & 5.19083350876113e-09 & 0.999999997404583 \tabularnewline
40 & 4.79013685869854e-09 & 9.58027371739708e-09 & 0.999999995209863 \tabularnewline
41 & 1.46146768175156e-08 & 2.92293536350313e-08 & 0.999999985385323 \tabularnewline
42 & 7.89830856095394e-07 & 1.57966171219079e-06 & 0.999999210169144 \tabularnewline
43 & 1.04472555358398e-05 & 2.08945110716795e-05 & 0.999989552744464 \tabularnewline
44 & 0.000448899010543961 & 0.000897798021087922 & 0.999551100989456 \tabularnewline
45 & 0.00891045988041258 & 0.0178209197608252 & 0.991089540119587 \tabularnewline
46 & 0.0884325874063617 & 0.176865174812723 & 0.911567412593638 \tabularnewline
47 & 0.679551763127902 & 0.640896473744197 & 0.320448236872098 \tabularnewline
48 & 0.920177569295313 & 0.159644861409374 & 0.079822430704687 \tabularnewline
49 & 0.937707750893705 & 0.124584498212591 & 0.0622922491062954 \tabularnewline
50 & 0.952091493983366 & 0.095817012033268 & 0.047908506016634 \tabularnewline
51 & 0.966349928026503 & 0.067300143946994 & 0.033650071973497 \tabularnewline
52 & 0.96150840126609 & 0.0769831974678209 & 0.0384915987339104 \tabularnewline
53 & 0.9471806153874 & 0.105638769225201 & 0.0528193846126005 \tabularnewline
54 & 0.938549129131858 & 0.122901741736284 & 0.0614508708681419 \tabularnewline
55 & 0.929466286383505 & 0.141067427232990 & 0.0705337136164949 \tabularnewline
56 & 0.891355173347351 & 0.217289653305298 & 0.108644826652649 \tabularnewline
57 & 0.96049803347991 & 0.0790039330401816 & 0.0395019665200908 \tabularnewline
\hline
\end{tabular}
%Source: https://freestatistics.org/blog/index.php?pk=57552&T=5

[TABLE]
[ROW][C]Goldfeld-Quandt test for Heteroskedasticity[/C][/ROW]
[ROW][C]p-values[/C][C]Alternative Hypothesis[/C][/ROW]
[ROW][C]breakpoint index[/C][C]greater[/C][C]2-sided[/C][C]less[/C][/ROW]
[ROW][C]8[/C][C]0.0172046959879321[/C][C]0.0344093919758641[/C][C]0.982795304012068[/C][/ROW]
[ROW][C]9[/C][C]0.00627686151774557[/C][C]0.0125537230354911[/C][C]0.993723138482254[/C][/ROW]
[ROW][C]10[/C][C]0.00210292192854465[/C][C]0.0042058438570893[/C][C]0.997897078071455[/C][/ROW]
[ROW][C]11[/C][C]0.00110774823653811[/C][C]0.00221549647307622[/C][C]0.998892251763462[/C][/ROW]
[ROW][C]12[/C][C]0.000279070206419644[/C][C]0.000558140412839288[/C][C]0.99972092979358[/C][/ROW]
[ROW][C]13[/C][C]7.302159868767e-05[/C][C]0.00014604319737534[/C][C]0.999926978401312[/C][/ROW]
[ROW][C]14[/C][C]1.47394775945462e-05[/C][C]2.94789551890923e-05[/C][C]0.999985260522405[/C][/ROW]
[ROW][C]15[/C][C]3.09325301297538e-06[/C][C]6.18650602595075e-06[/C][C]0.999996906746987[/C][/ROW]
[ROW][C]16[/C][C]7.0737454387759e-07[/C][C]1.41474908775518e-06[/C][C]0.999999292625456[/C][/ROW]
[ROW][C]17[/C][C]1.58266287937083e-06[/C][C]3.16532575874166e-06[/C][C]0.99999841733712[/C][/ROW]
[ROW][C]18[/C][C]9.08508717730247e-07[/C][C]1.81701743546049e-06[/C][C]0.999999091491282[/C][/ROW]
[ROW][C]19[/C][C]2.27512792095077e-07[/C][C]4.55025584190154e-07[/C][C]0.999999772487208[/C][/ROW]
[ROW][C]20[/C][C]5.6070071653084e-08[/C][C]1.12140143306168e-07[/C][C]0.999999943929928[/C][/ROW]
[ROW][C]21[/C][C]2.00824708413005e-08[/C][C]4.0164941682601e-08[/C][C]0.99999997991753[/C][/ROW]
[ROW][C]22[/C][C]6.38891300961908e-08[/C][C]1.27778260192382e-07[/C][C]0.99999993611087[/C][/ROW]
[ROW][C]23[/C][C]4.39128555472575e-08[/C][C]8.7825711094515e-08[/C][C]0.999999956087144[/C][/ROW]
[ROW][C]24[/C][C]2.64051840185015e-08[/C][C]5.28103680370031e-08[/C][C]0.999999973594816[/C][/ROW]
[ROW][C]25[/C][C]1.48716415362895e-08[/C][C]2.97432830725789e-08[/C][C]0.999999985128359[/C][/ROW]
[ROW][C]26[/C][C]7.11718967398156e-09[/C][C]1.42343793479631e-08[/C][C]0.99999999288281[/C][/ROW]
[ROW][C]27[/C][C]3.93871439778569e-09[/C][C]7.87742879557139e-09[/C][C]0.999999996061286[/C][/ROW]
[ROW][C]28[/C][C]1.60931078021616e-08[/C][C]3.21862156043231e-08[/C][C]0.999999983906892[/C][/ROW]
[ROW][C]29[/C][C]5.69723635889324e-08[/C][C]1.13944727177865e-07[/C][C]0.999999943027636[/C][/ROW]
[ROW][C]30[/C][C]3.04788362032232e-08[/C][C]6.09576724064463e-08[/C][C]0.999999969521164[/C][/ROW]
[ROW][C]31[/C][C]1.19460702277785e-08[/C][C]2.38921404555569e-08[/C][C]0.99999998805393[/C][/ROW]
[ROW][C]32[/C][C]8.62191959637052e-09[/C][C]1.72438391927410e-08[/C][C]0.99999999137808[/C][/ROW]
[ROW][C]33[/C][C]4.30867803534006e-09[/C][C]8.61735607068013e-09[/C][C]0.999999995691322[/C][/ROW]
[ROW][C]34[/C][C]2.08174394546268e-09[/C][C]4.16348789092537e-09[/C][C]0.999999997918256[/C][/ROW]
[ROW][C]35[/C][C]1.23911734025070e-09[/C][C]2.47823468050140e-09[/C][C]0.999999998760883[/C][/ROW]
[ROW][C]36[/C][C]1.86550481412691e-09[/C][C]3.73100962825383e-09[/C][C]0.999999998134495[/C][/ROW]
[ROW][C]37[/C][C]1.27877983998987e-09[/C][C]2.55755967997973e-09[/C][C]0.99999999872122[/C][/ROW]
[ROW][C]38[/C][C]6.75604726453515e-10[/C][C]1.35120945290703e-09[/C][C]0.999999999324395[/C][/ROW]
[ROW][C]39[/C][C]2.59541675438056e-09[/C][C]5.19083350876113e-09[/C][C]0.999999997404583[/C][/ROW]
[ROW][C]40[/C][C]4.79013685869854e-09[/C][C]9.58027371739708e-09[/C][C]0.999999995209863[/C][/ROW]
[ROW][C]41[/C][C]1.46146768175156e-08[/C][C]2.92293536350313e-08[/C][C]0.999999985385323[/C][/ROW]
[ROW][C]42[/C][C]7.89830856095394e-07[/C][C]1.57966171219079e-06[/C][C]0.999999210169144[/C][/ROW]
[ROW][C]43[/C][C]1.04472555358398e-05[/C][C]2.08945110716795e-05[/C][C]0.999989552744464[/C][/ROW]
[ROW][C]44[/C][C]0.000448899010543961[/C][C]0.000897798021087922[/C][C]0.999551100989456[/C][/ROW]
[ROW][C]45[/C][C]0.00891045988041258[/C][C]0.0178209197608252[/C][C]0.991089540119587[/C][/ROW]
[ROW][C]46[/C][C]0.0884325874063617[/C][C]0.176865174812723[/C][C]0.911567412593638[/C][/ROW]
[ROW][C]47[/C][C]0.679551763127902[/C][C]0.640896473744197[/C][C]0.320448236872098[/C][/ROW]
[ROW][C]48[/C][C]0.920177569295313[/C][C]0.159644861409374[/C][C]0.079822430704687[/C][/ROW]
[ROW][C]49[/C][C]0.937707750893705[/C][C]0.124584498212591[/C][C]0.0622922491062954[/C][/ROW]
[ROW][C]50[/C][C]0.952091493983366[/C][C]0.095817012033268[/C][C]0.047908506016634[/C][/ROW]
[ROW][C]51[/C][C]0.966349928026503[/C][C]0.067300143946994[/C][C]0.033650071973497[/C][/ROW]
[ROW][C]52[/C][C]0.96150840126609[/C][C]0.0769831974678209[/C][C]0.0384915987339104[/C][/ROW]
[ROW][C]53[/C][C]0.9471806153874[/C][C]0.105638769225201[/C][C]0.0528193846126005[/C][/ROW]
[ROW][C]54[/C][C]0.938549129131858[/C][C]0.122901741736284[/C][C]0.0614508708681419[/C][/ROW]
[ROW][C]55[/C][C]0.929466286383505[/C][C]0.141067427232990[/C][C]0.0705337136164949[/C][/ROW]
[ROW][C]56[/C][C]0.891355173347351[/C][C]0.217289653305298[/C][C]0.108644826652649[/C][/ROW]
[ROW][C]57[/C][C]0.96049803347991[/C][C]0.0790039330401816[/C][C]0.0395019665200908[/C][/ROW]
[/TABLE]
Source: https://freestatistics.org/blog/index.php?pk=57552&T=5

Globally Unique Identifier (entire table): ba.freestatistics.org/blog/index.php?pk=57552&T=5

As an alternative you can also use a QR Code:  

The GUIDs for individual cells are displayed in the table below:

Goldfeld-Quandt test for Heteroskedasticity
p-valuesAlternative Hypothesis
breakpoint indexgreater2-sidedless
80.01720469598793210.03440939197586410.982795304012068
90.006276861517745570.01255372303549110.993723138482254
100.002102921928544650.00420584385708930.997897078071455
110.001107748236538110.002215496473076220.998892251763462
120.0002790702064196440.0005581404128392880.99972092979358
137.302159868767e-050.000146043197375340.999926978401312
141.47394775945462e-052.94789551890923e-050.999985260522405
153.09325301297538e-066.18650602595075e-060.999996906746987
167.0737454387759e-071.41474908775518e-060.999999292625456
171.58266287937083e-063.16532575874166e-060.99999841733712
189.08508717730247e-071.81701743546049e-060.999999091491282
192.27512792095077e-074.55025584190154e-070.999999772487208
205.6070071653084e-081.12140143306168e-070.999999943929928
212.00824708413005e-084.0164941682601e-080.99999997991753
226.38891300961908e-081.27778260192382e-070.99999993611087
234.39128555472575e-088.7825711094515e-080.999999956087144
242.64051840185015e-085.28103680370031e-080.999999973594816
251.48716415362895e-082.97432830725789e-080.999999985128359
267.11718967398156e-091.42343793479631e-080.99999999288281
273.93871439778569e-097.87742879557139e-090.999999996061286
281.60931078021616e-083.21862156043231e-080.999999983906892
295.69723635889324e-081.13944727177865e-070.999999943027636
303.04788362032232e-086.09576724064463e-080.999999969521164
311.19460702277785e-082.38921404555569e-080.99999998805393
328.62191959637052e-091.72438391927410e-080.99999999137808
334.30867803534006e-098.61735607068013e-090.999999995691322
342.08174394546268e-094.16348789092537e-090.999999997918256
351.23911734025070e-092.47823468050140e-090.999999998760883
361.86550481412691e-093.73100962825383e-090.999999998134495
371.27877983998987e-092.55755967997973e-090.99999999872122
386.75604726453515e-101.35120945290703e-090.999999999324395
392.59541675438056e-095.19083350876113e-090.999999997404583
404.79013685869854e-099.58027371739708e-090.999999995209863
411.46146768175156e-082.92293536350313e-080.999999985385323
427.89830856095394e-071.57966171219079e-060.999999210169144
431.04472555358398e-052.08945110716795e-050.999989552744464
440.0004488990105439610.0008977980210879220.999551100989456
450.008910459880412580.01782091976082520.991089540119587
460.08843258740636170.1768651748127230.911567412593638
470.6795517631279020.6408964737441970.320448236872098
480.9201775692953130.1596448614093740.079822430704687
490.9377077508937050.1245844982125910.0622922491062954
500.9520914939833660.0958170120332680.047908506016634
510.9663499280265030.0673001439469940.033650071973497
520.961508401266090.07698319746782090.0384915987339104
530.94718061538740.1056387692252010.0528193846126005
540.9385491291318580.1229017417362840.0614508708681419
550.9294662863835050.1410674272329900.0705337136164949
560.8913551733473510.2172896533052980.108644826652649
570.960498033479910.07900393304018160.0395019665200908


Meta Analysis of Goldfeld-Quandt test for Heteroskedasticity
Description# significant tests% significant testsOK/NOK
1% type I error level350.7NOK
5% type I error level380.76NOK
10% type I error level420.84NOK

\begin{tabular}{lllllllll}
\hline
Meta Analysis of Goldfeld-Quandt test for Heteroskedasticity \tabularnewline
Description & # significant tests & % significant tests & OK/NOK \tabularnewline
1% type I error level & 35 & 0.7 & NOK \tabularnewline
5% type I error level & 38 & 0.76 & NOK \tabularnewline
10% type I error level & 42 & 0.84 & NOK \tabularnewline
\hline
\end{tabular}
%Source: https://freestatistics.org/blog/index.php?pk=57552&T=6

[TABLE]
[ROW][C]Meta Analysis of Goldfeld-Quandt test for Heteroskedasticity[/C][/ROW]
[ROW][C]Description[/C][C]# significant tests[/C][C]% significant tests[/C][C]OK/NOK[/C][/ROW]
[ROW][C]1% type I error level[/C][C]35[/C][C]0.7[/C][C]NOK[/C][/ROW]
[ROW][C]5% type I error level[/C][C]38[/C][C]0.76[/C][C]NOK[/C][/ROW]
[ROW][C]10% type I error level[/C][C]42[/C][C]0.84[/C][C]NOK[/C][/ROW]
[/TABLE]
Source: https://freestatistics.org/blog/index.php?pk=57552&T=6

Globally Unique Identifier (entire table): ba.freestatistics.org/blog/index.php?pk=57552&T=6

As an alternative you can also use a QR Code:  

The GUIDs for individual cells are displayed in the table below:

Meta Analysis of Goldfeld-Quandt test for Heteroskedasticity
Description# significant tests% significant testsOK/NOK
1% type I error level350.7NOK
5% type I error level380.76NOK
10% type I error level420.84NOK


Parameters (Session):
par1 = 1 ; par2 = Do not include Seasonal Dummies ; par3 = Linear Trend ;
Parameters (R input):
par1 = 1 ; par2 = Do not include Seasonal Dummies ; par3 = Linear Trend ;
R code (references can be found in the software module):
library(lattice)
library(lmtest)
n25 <- 25 #minimum number of obs. for Goldfeld-Quandt test
par1 <- as.numeric(par1)
x <- t(y)
k <- length(x[1,])
n <- length(x[,1])
x1 <- cbind(x[,par1], x[,1:k!=par1])
mycolnames <- c(colnames(x)[par1], colnames(x)[1:k!=par1])
colnames(x1) <- mycolnames #colnames(x)[par1]
x <- x1
if (par3 == 'First Differences'){
x2 <- array(0, dim=c(n-1,k), dimnames=list(1:(n-1), paste('(1-B)',colnames(x),sep='')))
for (i in 1:n-1) {
for (j in 1:k) {
x2[i,j] <- x[i+1,j] - x[i,j]
}
}
x <- x2
}
if (par2 == 'Include Monthly Dummies'){
x2 <- array(0, dim=c(n,11), dimnames=list(1:n, paste('M', seq(1:11), sep ='')))
for (i in 1:11){
x2[seq(i,n,12),i] <- 1
}
x <- cbind(x, x2)
}
if (par2 == 'Include Quarterly Dummies'){
x2 <- array(0, dim=c(n,3), dimnames=list(1:n, paste('Q', seq(1:3), sep ='')))
for (i in 1:3){
x2[seq(i,n,4),i] <- 1
}
x <- cbind(x, x2)
}
k <- length(x[1,])
if (par3 == 'Linear Trend'){
x <- cbind(x, c(1:n))
colnames(x)[k+1] <- 't'
}
x
k <- length(x[1,])
df <- as.data.frame(x)
(mylm <- lm(df))
(mysum <- summary(mylm))
if (n > n25) {
kp3 <- k + 3
nmkm3 <- n - k - 3
gqarr <- array(NA, dim=c(nmkm3-kp3+1,3))
numgqtests <- 0
numsignificant1 <- 0
numsignificant5 <- 0
numsignificant10 <- 0
for (mypoint in kp3:nmkm3) {
j <- 0
numgqtests <- numgqtests + 1
for (myalt in c('greater', 'two.sided', 'less')) {
j <- j + 1
gqarr[mypoint-kp3+1,j] <- gqtest(mylm, point=mypoint, alternative=myalt)$p.value
}
if (gqarr[mypoint-kp3+1,2] < 0.01) numsignificant1 <- numsignificant1 + 1
if (gqarr[mypoint-kp3+1,2] < 0.05) numsignificant5 <- numsignificant5 + 1
if (gqarr[mypoint-kp3+1,2] < 0.10) numsignificant10 <- numsignificant10 + 1
}
gqarr
}
bitmap(file='test0.png')
plot(x[,1], type='l', main='Actuals and Interpolation', ylab='value of Actuals and Interpolation (dots)', xlab='time or index')
points(x[,1]-mysum$resid)
grid()
dev.off()
bitmap(file='test1.png')
plot(mysum$resid, type='b', pch=19, main='Residuals', ylab='value of Residuals', xlab='time or index')
grid()
dev.off()
bitmap(file='test2.png')
hist(mysum$resid, main='Residual Histogram', xlab='values of Residuals')
grid()
dev.off()
bitmap(file='test3.png')
densityplot(~mysum$resid,col='black',main='Residual Density Plot', xlab='values of Residuals')
dev.off()
bitmap(file='test4.png')
qqnorm(mysum$resid, main='Residual Normal Q-Q Plot')
qqline(mysum$resid)
grid()
dev.off()
(myerror <- as.ts(mysum$resid))
bitmap(file='test5.png')
dum <- cbind(lag(myerror,k=1),myerror)
dum
dum1 <- dum[2:length(myerror),]
dum1
z <- as.data.frame(dum1)
z
plot(z,main=paste('Residual Lag plot, lowess, and regression line'), ylab='values of Residuals', xlab='lagged values of Residuals')
lines(lowess(z))
abline(lm(z))
grid()
dev.off()
bitmap(file='test6.png')
acf(mysum$resid, lag.max=length(mysum$resid)/2, main='Residual Autocorrelation Function')
grid()
dev.off()
bitmap(file='test7.png')
pacf(mysum$resid, lag.max=length(mysum$resid)/2, main='Residual Partial Autocorrelation Function')
grid()
dev.off()
bitmap(file='test8.png')
opar <- par(mfrow = c(2,2), oma = c(0, 0, 1.1, 0))
plot(mylm, las = 1, sub='Residual Diagnostics')
par(opar)
dev.off()
if (n > n25) {
bitmap(file='test9.png')
plot(kp3:nmkm3,gqarr[,2], main='Goldfeld-Quandt test',ylab='2-sided p-value',xlab='breakpoint')
grid()
dev.off()
}
load(file='createtable')
a<-table.start()
a<-table.row.start(a)
a<-table.element(a, 'Multiple Linear Regression - Estimated Regression Equation', 1, TRUE)
a<-table.row.end(a)
myeq <- colnames(x)[1]
myeq <- paste(myeq, '[t] = ', sep='')
for (i in 1:k){
if (mysum$coefficients[i,1] > 0) myeq <- paste(myeq, '+', '')
myeq <- paste(myeq, mysum$coefficients[i,1], sep=' ')
if (rownames(mysum$coefficients)[i] != '(Intercept)') {
myeq <- paste(myeq, rownames(mysum$coefficients)[i], sep='')
if (rownames(mysum$coefficients)[i] != 't') myeq <- paste(myeq, '[t]', sep='')
}
}
myeq <- paste(myeq, ' + e[t]')
a<-table.row.start(a)
a<-table.element(a, myeq)
a<-table.row.end(a)
a<-table.end(a)
table.save(a,file='mytable1.tab')
a<-table.start()
a<-table.row.start(a)
a<-table.element(a,hyperlink('ols1.htm','Multiple Linear Regression - Ordinary Least Squares',''), 6, TRUE)
a<-table.row.end(a)
a<-table.row.start(a)
a<-table.element(a,'Variable',header=TRUE)
a<-table.element(a,'Parameter',header=TRUE)
a<-table.element(a,'S.D.',header=TRUE)
a<-table.element(a,'T-STAT
H0: parameter = 0',header=TRUE)
a<-table.element(a,'2-tail p-value',header=TRUE)
a<-table.element(a,'1-tail p-value',header=TRUE)
a<-table.row.end(a)
for (i in 1:k){
a<-table.row.start(a)
a<-table.element(a,rownames(mysum$coefficients)[i],header=TRUE)
a<-table.element(a,mysum$coefficients[i,1])
a<-table.element(a, round(mysum$coefficients[i,2],6))
a<-table.element(a, round(mysum$coefficients[i,3],4))
a<-table.element(a, round(mysum$coefficients[i,4],6))
a<-table.element(a, round(mysum$coefficients[i,4]/2,6))
a<-table.row.end(a)
}
a<-table.end(a)
table.save(a,file='mytable2.tab')
a<-table.start()
a<-table.row.start(a)
a<-table.element(a, 'Multiple Linear Regression - Regression Statistics', 2, TRUE)
a<-table.row.end(a)
a<-table.row.start(a)
a<-table.element(a, 'Multiple R',1,TRUE)
a<-table.element(a, sqrt(mysum$r.squared))
a<-table.row.end(a)
a<-table.row.start(a)
a<-table.element(a, 'R-squared',1,TRUE)
a<-table.element(a, mysum$r.squared)
a<-table.row.end(a)
a<-table.row.start(a)
a<-table.element(a, 'Adjusted R-squared',1,TRUE)
a<-table.element(a, mysum$adj.r.squared)
a<-table.row.end(a)
a<-table.row.start(a)
a<-table.element(a, 'F-TEST (value)',1,TRUE)
a<-table.element(a, mysum$fstatistic[1])
a<-table.row.end(a)
a<-table.row.start(a)
a<-table.element(a, 'F-TEST (DF numerator)',1,TRUE)
a<-table.element(a, mysum$fstatistic[2])
a<-table.row.end(a)
a<-table.row.start(a)
a<-table.element(a, 'F-TEST (DF denominator)',1,TRUE)
a<-table.element(a, mysum$fstatistic[3])
a<-table.row.end(a)
a<-table.row.start(a)
a<-table.element(a, 'p-value',1,TRUE)
a<-table.element(a, 1-pf(mysum$fstatistic[1],mysum$fstatistic[2],mysum$fstatistic[3]))
a<-table.row.end(a)
a<-table.row.start(a)
a<-table.element(a, 'Multiple Linear Regression - Residual Statistics', 2, TRUE)
a<-table.row.end(a)
a<-table.row.start(a)
a<-table.element(a, 'Residual Standard Deviation',1,TRUE)
a<-table.element(a, mysum$sigma)
a<-table.row.end(a)
a<-table.row.start(a)
a<-table.element(a, 'Sum Squared Residuals',1,TRUE)
a<-table.element(a, sum(myerror*myerror))
a<-table.row.end(a)
a<-table.end(a)
table.save(a,file='mytable3.tab')
a<-table.start()
a<-table.row.start(a)
a<-table.element(a, 'Multiple Linear Regression - Actuals, Interpolation, and Residuals', 4, TRUE)
a<-table.row.end(a)
a<-table.row.start(a)
a<-table.element(a, 'Time or Index', 1, TRUE)
a<-table.element(a, 'Actuals', 1, TRUE)
a<-table.element(a, 'Interpolation
Forecast', 1, TRUE)
a<-table.element(a, 'Residuals
Prediction Error', 1, TRUE)
a<-table.row.end(a)
for (i in 1:n) {
a<-table.row.start(a)
a<-table.element(a,i, 1, TRUE)
a<-table.element(a,x[i])
a<-table.element(a,x[i]-mysum$resid[i])
a<-table.element(a,mysum$resid[i])
a<-table.row.end(a)
}
a<-table.end(a)
table.save(a,file='mytable4.tab')
if (n > n25) {
a<-table.start()
a<-table.row.start(a)
a<-table.element(a,'Goldfeld-Quandt test for Heteroskedasticity',4,TRUE)
a<-table.row.end(a)
a<-table.row.start(a)
a<-table.element(a,'p-values',header=TRUE)
a<-table.element(a,'Alternative Hypothesis',3,header=TRUE)
a<-table.row.end(a)
a<-table.row.start(a)
a<-table.element(a,'breakpoint index',header=TRUE)
a<-table.element(a,'greater',header=TRUE)
a<-table.element(a,'2-sided',header=TRUE)
a<-table.element(a,'less',header=TRUE)
a<-table.row.end(a)
for (mypoint in kp3:nmkm3) {
a<-table.row.start(a)
a<-table.element(a,mypoint,header=TRUE)
a<-table.element(a,gqarr[mypoint-kp3+1,1])
a<-table.element(a,gqarr[mypoint-kp3+1,2])
a<-table.element(a,gqarr[mypoint-kp3+1,3])
a<-table.row.end(a)
}
a<-table.end(a)
table.save(a,file='mytable5.tab')
a<-table.start()
a<-table.row.start(a)
a<-table.element(a,'Meta Analysis of Goldfeld-Quandt test for Heteroskedasticity',4,TRUE)
a<-table.row.end(a)
a<-table.row.start(a)
a<-table.element(a,'Description',header=TRUE)
a<-table.element(a,'# significant tests',header=TRUE)
a<-table.element(a,'% significant tests',header=TRUE)
a<-table.element(a,'OK/NOK',header=TRUE)
a<-table.row.end(a)
a<-table.row.start(a)
a<-table.element(a,'1% type I error level',header=TRUE)
a<-table.element(a,numsignificant1)
a<-table.element(a,numsignificant1/numgqtests)
if (numsignificant1/numgqtests < 0.01) dum <- 'OK' else dum <- 'NOK'
a<-table.element(a,dum)
a<-table.row.end(a)
a<-table.row.start(a)
a<-table.element(a,'5% type I error level',header=TRUE)
a<-table.element(a,numsignificant5)
a<-table.element(a,numsignificant5/numgqtests)
if (numsignificant5/numgqtests < 0.05) dum <- 'OK' else dum <- 'NOK'
a<-table.element(a,dum)
a<-table.row.end(a)
a<-table.row.start(a)
a<-table.element(a,'10% type I error level',header=TRUE)
a<-table.element(a,numsignificant10)
a<-table.element(a,numsignificant10/numgqtests)
if (numsignificant10/numgqtests < 0.1) dum <- 'OK' else dum <- 'NOK'
a<-table.element(a,dum)
a<-table.row.end(a)
a<-table.end(a)
table.save(a,file='mytable6.tab')
}