Free Statistics

of Irreproducible Research!

Author's title

Author*The author of this computation has been verified*
R Software Modulerwasp_multipleregression.wasp
Title produced by softwareMultiple Regression
Date of computationWed, 18 Nov 2009 11:51:21 -0700
Cite this page as followsStatistical Computations at FreeStatistics.org, Office for Research Development and Education, URL https://freestatistics.org/blog/index.php?v=date/2009/Nov/18/t1258570351wukqw6zd42uj3cw.htm/, Retrieved Sun, 05 May 2024 13:46:29 +0000
Statistical Computations at FreeStatistics.org, Office for Research Development and Education, URL https://freestatistics.org/blog/index.php?pk=57591, Retrieved Sun, 05 May 2024 13:46:29 +0000
QR Codes:

Original text written by user:
IsPrivate?No (this computation is public)
User-defined keywords
Estimated Impact146
Family? (F = Feedback message, R = changed R code, M = changed R Module, P = changed Parameters, D = changed Data)
-     [Multiple Regression] [Q1 The Seatbeltlaw] [2007-11-14 19:27:43] [8cd6641b921d30ebe00b648d1481bba0]
- RMPD  [Multiple Regression] [Seatbelt] [2009-11-12 13:54:52] [b98453cac15ba1066b407e146608df68]
- R PD      [Multiple Regression] [] [2009-11-18 18:51:21] [d5837f25ec8937f9733a894c487f865c] [Current]
-    D        [Multiple Regression] [Model 4] [2009-11-18 18:59:07] [c0117c881d5fcd069841276db0c34efe]
Feedback Forum

Post a new message
Dataseries X:
2863.36	99.9	100.1	100.7	101.1	101.2
2897.06	99.7	99.9	100.1	100.7	101.1
3012.61	99.5	99.7	99.9	100.1	100.7
3142.95	99.2	99.5	99.7	99.9	100.1
3032.93	99	99.2	99.5	99.7	99.9
3045.78	99	99	99.2	99.5	99.7
3110.52	99.3	99	99	99.2	99.5
3013.24	99.5	99.3	99	99	99.2
2987.10	99.7	99.5	99.3	99	99
2995.55	100	99.7	99.5	99.3	99
2833.18	100.4	100	99.7	99.5	99.3
2848.96	100.6	100.4	100	99.7	99.5
2794.83	100.7	100.6	100.4	100	99.7
2845.26	100.7	100.7	100.6	100.4	100
2915.02	100.6	100.7	100.7	100.6	100.4
2892.63	100.5	100.6	100.7	100.7	100.6
2604.42	100.6	100.5	100.6	100.7	100.7
2641.65	100.5	100.6	100.5	100.6	100.7
2659.81	100.4	100.5	100.6	100.5	100.6
2638.53	100.3	100.4	100.5	100.6	100.5
2720.25	100.4	100.3	100.4	100.5	100.6
2745.88	100.4	100.4	100.3	100.4	100.5
2735.7	100.4	100.4	100.4	100.3	100.4
2811.7	100.4	100.4	100.4	100.4	100.3
2799.43	100.4	100.4	100.4	100.4	100.4
2555.28	100.5	100.4	100.4	100.4	100.4
2304.98	100.6	100.5	100.4	100.4	100.4
2214.95	100.6	100.6	100.5	100.4	100.4
2065.81	100.5	100.6	100.6	100.5	100.4
1940.49	100.5	100.5	100.6	100.6	100.5
2042.00	100.7	100.5	100.5	100.6	100.6
1995.37	101.1	100.7	100.5	100.5	100.6
1946.81	101.5	101.1	100.7	100.5	100.5
1765.9	101.9	101.5	101.1	100.7	100.5
1635.25	102.1	101.9	101.5	101.1	100.7
1833.42	102.1	102.1	101.9	101.5	101.1
1910.43	102.1	102.1	102.1	101.9	101.5
1959.67	102.4	102.1	102.1	102.1	101.9
1969.6	102.8	102.4	102.1	102.1	102.1
2061.41	103.1	102.8	102.4	102.1	102.1
2093.48	103.1	103.1	102.8	102.4	102.1
2120.88	102.9	103.1	103.1	102.8	102.4
2174.56	102.4	102.9	103.1	103.1	102.8
2196.72	101.9	102.4	102.9	103.1	103.1
2350.44	101.3	101.9	102.4	102.9	103.1
2440.25	100.7	101.3	101.9	102.4	102.9
2408.64	100.6	100.7	101.3	101.9	102.4
2472.81	101	100.6	100.7	101.3	101.9
2407.6	101.5	101	100.6	100.7	101.3
2454.62	101.9	101.5	101	100.6	100.7
2448.05	102.1	101.9	101.5	101	100.6
2497.84	102.3	102.1	101.9	101.5	101
2645.64	102.5	102.3	102.1	101.9	101.5
2756.76	102.9	102.5	102.3	102.1	101.9
2849.27	103.6	102.9	102.5	102.3	102.1
2921.44	104.3	103.6	102.9	102.5	102.3


Summary of computational transaction
Raw Inputview raw input (R code)
Raw Outputview raw output of R engine
Computing time4 seconds
R Server'Gwilym Jenkins' @ 72.249.127.135

\begin{tabular}{lllllllll}
\hline
Summary of computational transaction \tabularnewline
Raw Input & view raw input (R code)  \tabularnewline
Raw Output & view raw output of R engine  \tabularnewline
Computing time & 4 seconds \tabularnewline
R Server & 'Gwilym Jenkins' @ 72.249.127.135 \tabularnewline
\hline
\end{tabular}
%Source: https://freestatistics.org/blog/index.php?pk=57591&T=0

[TABLE]
[ROW][C]Summary of computational transaction[/C][/ROW]
[ROW][C]Raw Input[/C][C]view raw input (R code) [/C][/ROW]
[ROW][C]Raw Output[/C][C]view raw output of R engine [/C][/ROW]
[ROW][C]Computing time[/C][C]4 seconds[/C][/ROW]
[ROW][C]R Server[/C][C]'Gwilym Jenkins' @ 72.249.127.135[/C][/ROW]
[/TABLE]
Source: https://freestatistics.org/blog/index.php?pk=57591&T=0

Globally Unique Identifier (entire table): ba.freestatistics.org/blog/index.php?pk=57591&T=0

As an alternative you can also use a QR Code:  

The GUIDs for individual cells are displayed in the table below:

Summary of computational transaction
Raw Inputview raw input (R code)
Raw Outputview raw output of R engine
Computing time4 seconds
R Server'Gwilym Jenkins' @ 72.249.127.135


Multiple Linear Regression - Estimated Regression Equation
G.indx[t] = + 9.00524964939543 + 3.79035267848712e-05Bel20[t] + 2.05758680536144Y1[t] -1.65019256489537Y2[t] + 0.666098296679429Y3[t] -0.165203885369296Y4[t] + 0.00662830373229754t + e[t]

\begin{tabular}{lllllllll}
\hline
Multiple Linear Regression - Estimated Regression Equation \tabularnewline
G.indx[t] =  +  9.00524964939543 +  3.79035267848712e-05Bel20[t] +  2.05758680536144Y1[t] -1.65019256489537Y2[t] +  0.666098296679429Y3[t] -0.165203885369296Y4[t] +  0.00662830373229754t  + e[t] \tabularnewline
\hline
\end{tabular}
%Source: https://freestatistics.org/blog/index.php?pk=57591&T=1

[TABLE]
[ROW][C]Multiple Linear Regression - Estimated Regression Equation[/C][/ROW]
[ROW][C]G.indx[t] =  +  9.00524964939543 +  3.79035267848712e-05Bel20[t] +  2.05758680536144Y1[t] -1.65019256489537Y2[t] +  0.666098296679429Y3[t] -0.165203885369296Y4[t] +  0.00662830373229754t  + e[t][/C][/ROW]
[/TABLE]
Source: https://freestatistics.org/blog/index.php?pk=57591&T=1

Globally Unique Identifier (entire table): ba.freestatistics.org/blog/index.php?pk=57591&T=1

As an alternative you can also use a QR Code:  

The GUIDs for individual cells are displayed in the table below:

Multiple Linear Regression - Estimated Regression Equation
G.indx[t] = + 9.00524964939543 + 3.79035267848712e-05Bel20[t] + 2.05758680536144Y1[t] -1.65019256489537Y2[t] + 0.666098296679429Y3[t] -0.165203885369296Y4[t] + 0.00662830373229754t + e[t]


Multiple Linear Regression - Ordinary Least Squares
VariableParameterS.D.T-STATH0: parameter = 02-tail p-value1-tail p-value
(Intercept)9.005249649395433.8825422.31940.0245830.012292
Bel203.79035267848712e-056e-050.62750.5332380.266619
Y12.057586805361440.14096814.596100
Y2-1.650192564895370.314024-5.2553e-062e-06
Y30.6660982966794290.3173122.09920.0409750.020487
Y4-0.1652038853692960.144246-1.14530.257650.128825
t0.006628303732297540.0024952.65660.0106250.005312

\begin{tabular}{lllllllll}
\hline
Multiple Linear Regression - Ordinary Least Squares \tabularnewline
Variable & Parameter & S.D. & T-STATH0: parameter = 0 & 2-tail p-value & 1-tail p-value \tabularnewline
(Intercept) & 9.00524964939543 & 3.882542 & 2.3194 & 0.024583 & 0.012292 \tabularnewline
Bel20 & 3.79035267848712e-05 & 6e-05 & 0.6275 & 0.533238 & 0.266619 \tabularnewline
Y1 & 2.05758680536144 & 0.140968 & 14.5961 & 0 & 0 \tabularnewline
Y2 & -1.65019256489537 & 0.314024 & -5.255 & 3e-06 & 2e-06 \tabularnewline
Y3 & 0.666098296679429 & 0.317312 & 2.0992 & 0.040975 & 0.020487 \tabularnewline
Y4 & -0.165203885369296 & 0.144246 & -1.1453 & 0.25765 & 0.128825 \tabularnewline
t & 0.00662830373229754 & 0.002495 & 2.6566 & 0.010625 & 0.005312 \tabularnewline
\hline
\end{tabular}
%Source: https://freestatistics.org/blog/index.php?pk=57591&T=2

[TABLE]
[ROW][C]Multiple Linear Regression - Ordinary Least Squares[/C][/ROW]
[ROW][C]Variable[/C][C]Parameter[/C][C]S.D.[/C][C]T-STATH0: parameter = 0[/C][C]2-tail p-value[/C][C]1-tail p-value[/C][/ROW]
[ROW][C](Intercept)[/C][C]9.00524964939543[/C][C]3.882542[/C][C]2.3194[/C][C]0.024583[/C][C]0.012292[/C][/ROW]
[ROW][C]Bel20[/C][C]3.79035267848712e-05[/C][C]6e-05[/C][C]0.6275[/C][C]0.533238[/C][C]0.266619[/C][/ROW]
[ROW][C]Y1[/C][C]2.05758680536144[/C][C]0.140968[/C][C]14.5961[/C][C]0[/C][C]0[/C][/ROW]
[ROW][C]Y2[/C][C]-1.65019256489537[/C][C]0.314024[/C][C]-5.255[/C][C]3e-06[/C][C]2e-06[/C][/ROW]
[ROW][C]Y3[/C][C]0.666098296679429[/C][C]0.317312[/C][C]2.0992[/C][C]0.040975[/C][C]0.020487[/C][/ROW]
[ROW][C]Y4[/C][C]-0.165203885369296[/C][C]0.144246[/C][C]-1.1453[/C][C]0.25765[/C][C]0.128825[/C][/ROW]
[ROW][C]t[/C][C]0.00662830373229754[/C][C]0.002495[/C][C]2.6566[/C][C]0.010625[/C][C]0.005312[/C][/ROW]
[/TABLE]
Source: https://freestatistics.org/blog/index.php?pk=57591&T=2

Globally Unique Identifier (entire table): ba.freestatistics.org/blog/index.php?pk=57591&T=2

As an alternative you can also use a QR Code:  

The GUIDs for individual cells are displayed in the table below:

Multiple Linear Regression - Ordinary Least Squares
VariableParameterS.D.T-STATH0: parameter = 02-tail p-value1-tail p-value
(Intercept)9.005249649395433.8825422.31940.0245830.012292
Bel203.79035267848712e-056e-050.62750.5332380.266619
Y12.057586805361440.14096814.596100
Y2-1.650192564895370.314024-5.2553e-062e-06
Y30.6660982966794290.3173122.09920.0409750.020487
Y4-0.1652038853692960.144246-1.14530.257650.128825
t0.006628303732297540.0024952.65660.0106250.005312


Multiple Linear Regression - Regression Statistics
Multiple R0.993572100402516
R-squared0.987185518698267
Adjusted R-squared0.985616398538871
F-TEST (value)629.13315642975
F-TEST (DF numerator)6
F-TEST (DF denominator)49
p-value0
Multiple Linear Regression - Residual Statistics
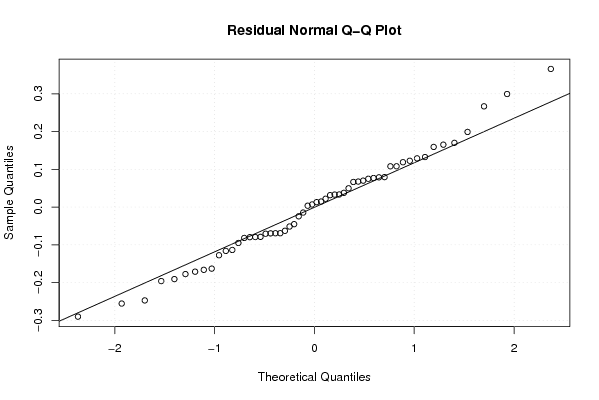
Residual Standard Deviation0.146643848096271
Sum Squared Residuals1.05371649103963

\begin{tabular}{lllllllll}
\hline
Multiple Linear Regression - Regression Statistics \tabularnewline
Multiple R & 0.993572100402516 \tabularnewline
R-squared & 0.987185518698267 \tabularnewline
Adjusted R-squared & 0.985616398538871 \tabularnewline
F-TEST (value) & 629.13315642975 \tabularnewline
F-TEST (DF numerator) & 6 \tabularnewline
F-TEST (DF denominator) & 49 \tabularnewline
p-value & 0 \tabularnewline
Multiple Linear Regression - Residual Statistics \tabularnewline
Residual Standard Deviation & 0.146643848096271 \tabularnewline
Sum Squared Residuals & 1.05371649103963 \tabularnewline
\hline
\end{tabular}
%Source: https://freestatistics.org/blog/index.php?pk=57591&T=3

[TABLE]
[ROW][C]Multiple Linear Regression - Regression Statistics[/C][/ROW]
[ROW][C]Multiple R[/C][C]0.993572100402516[/C][/ROW]
[ROW][C]R-squared[/C][C]0.987185518698267[/C][/ROW]
[ROW][C]Adjusted R-squared[/C][C]0.985616398538871[/C][/ROW]
[ROW][C]F-TEST (value)[/C][C]629.13315642975[/C][/ROW]
[ROW][C]F-TEST (DF numerator)[/C][C]6[/C][/ROW]
[ROW][C]F-TEST (DF denominator)[/C][C]49[/C][/ROW]
[ROW][C]p-value[/C][C]0[/C][/ROW]
[ROW][C]Multiple Linear Regression - Residual Statistics[/C][/ROW]
[ROW][C]Residual Standard Deviation[/C][C]0.146643848096271[/C][/ROW]
[ROW][C]Sum Squared Residuals[/C][C]1.05371649103963[/C][/ROW]
[/TABLE]
Source: https://freestatistics.org/blog/index.php?pk=57591&T=3

Globally Unique Identifier (entire table): ba.freestatistics.org/blog/index.php?pk=57591&T=3

As an alternative you can also use a QR Code:  

The GUIDs for individual cells are displayed in the table below:

Multiple Linear Regression - Regression Statistics
Multiple R0.993572100402516
R-squared0.987185518698267
Adjusted R-squared0.985616398538871
F-TEST (value)629.13315642975
F-TEST (DF numerator)6
F-TEST (DF denominator)49
p-value0
Multiple Linear Regression - Residual Statistics
Residual Standard Deviation0.146643848096271
Sum Squared Residuals1.05371649103963


Multiple Linear Regression - Actuals, Interpolation, and Residuals
Time or IndexActualsInterpolationForecastResidualsPrediction Error
199.999.53436192221630.365638077783737
299.799.8709468225314-0.170946822531342
399.599.46689860683040.0331013931695523
499.299.3628910800364-0.162891080036366
59998.97793282686040.0220671731395807
69998.96840971704620.0315902829538136
799.399.14074169615170.159258303848349
899.599.6773002926816-0.177300292681640
999.799.63243816690130.067561833098675
1010099.9206950925320.079304907468001
11100.4100.2920650229750.107934977025322
12100.6100.727447279298-0.127447279297661
13100.7100.6502529121690.0497470878308407
14100.7100.751391011375-0.0513910113753113
15100.6100.662782313835-0.0627823138347382
16100.5100.4963723296600.00362767033975323
17100.6100.4348166453540.165183354645630
18100.5100.747024204747-0.247024204746573
19100.4100.3334734583690.066526541631389
20100.3100.381685969209-0.081685969209198
21100.4100.2675421068990.132457893101155
22100.4100.595830373917-0.195830373917341
23100.4100.3869641221260.0130358778736025
24100.4100.479603312099-0.0796033120992248
25100.4100.469246151021-0.069246151020941
26100.5100.4666203086890.033379691311282
27100.6100.669520040203-0.0695200402028997
28100.6100.713475313465-0.11347531346536
29100.5100.616041258391-0.116041258391368
30100.5100.4622502527420.0377497472581364
31100.7100.6212250114310.0787749885693103
32101.1100.9709934051130.129006594886629
33101.5101.4852977112870.0147022887126028
34101.9101.7812462435110.118753756488621
35102.1102.179278689254-0.0792786892535808
36102.1102.145216434527-0.0452164345270023
37102.1102.0250829404020.0749170595979964
38102.4102.1007157189810.299284281018664
39102.8102.6919556692690.108044330730787
40103.1103.0300408484720.069959151528439
41103.1103.194913222962-0.0949132229619776
42102.9102.924400466921-0.0244004669205389
43102.4102.655294005754-0.255294005754493
44101.9101.914446196328-0.0144461963278918
45101.3101.589984250629-0.289984250628655
46100.7100.890552498066-0.190552498066444
47100.6100.4010989213820.198901078617602
48101100.8774593175070.12254068249349
49101.5101.569133264105-0.0691332641052293
50101.9101.978772669943-0.078772669943136
51102.1102.26605009441-0.166050094410077
52102.3102.2929735440470.00702645595290673
53102.5102.570520213119-0.0705202131185575
54102.9102.7299773100290.170022689971441
55103.6103.3332871604510.266712839548725
56104.3104.2230635817680.0769364182315131

\begin{tabular}{lllllllll}
\hline
Multiple Linear Regression - Actuals, Interpolation, and Residuals \tabularnewline
Time or Index & Actuals & InterpolationForecast & ResidualsPrediction Error \tabularnewline
1 & 99.9 & 99.5343619222163 & 0.365638077783737 \tabularnewline
2 & 99.7 & 99.8709468225314 & -0.170946822531342 \tabularnewline
3 & 99.5 & 99.4668986068304 & 0.0331013931695523 \tabularnewline
4 & 99.2 & 99.3628910800364 & -0.162891080036366 \tabularnewline
5 & 99 & 98.9779328268604 & 0.0220671731395807 \tabularnewline
6 & 99 & 98.9684097170462 & 0.0315902829538136 \tabularnewline
7 & 99.3 & 99.1407416961517 & 0.159258303848349 \tabularnewline
8 & 99.5 & 99.6773002926816 & -0.177300292681640 \tabularnewline
9 & 99.7 & 99.6324381669013 & 0.067561833098675 \tabularnewline
10 & 100 & 99.920695092532 & 0.079304907468001 \tabularnewline
11 & 100.4 & 100.292065022975 & 0.107934977025322 \tabularnewline
12 & 100.6 & 100.727447279298 & -0.127447279297661 \tabularnewline
13 & 100.7 & 100.650252912169 & 0.0497470878308407 \tabularnewline
14 & 100.7 & 100.751391011375 & -0.0513910113753113 \tabularnewline
15 & 100.6 & 100.662782313835 & -0.0627823138347382 \tabularnewline
16 & 100.5 & 100.496372329660 & 0.00362767033975323 \tabularnewline
17 & 100.6 & 100.434816645354 & 0.165183354645630 \tabularnewline
18 & 100.5 & 100.747024204747 & -0.247024204746573 \tabularnewline
19 & 100.4 & 100.333473458369 & 0.066526541631389 \tabularnewline
20 & 100.3 & 100.381685969209 & -0.081685969209198 \tabularnewline
21 & 100.4 & 100.267542106899 & 0.132457893101155 \tabularnewline
22 & 100.4 & 100.595830373917 & -0.195830373917341 \tabularnewline
23 & 100.4 & 100.386964122126 & 0.0130358778736025 \tabularnewline
24 & 100.4 & 100.479603312099 & -0.0796033120992248 \tabularnewline
25 & 100.4 & 100.469246151021 & -0.069246151020941 \tabularnewline
26 & 100.5 & 100.466620308689 & 0.033379691311282 \tabularnewline
27 & 100.6 & 100.669520040203 & -0.0695200402028997 \tabularnewline
28 & 100.6 & 100.713475313465 & -0.11347531346536 \tabularnewline
29 & 100.5 & 100.616041258391 & -0.116041258391368 \tabularnewline
30 & 100.5 & 100.462250252742 & 0.0377497472581364 \tabularnewline
31 & 100.7 & 100.621225011431 & 0.0787749885693103 \tabularnewline
32 & 101.1 & 100.970993405113 & 0.129006594886629 \tabularnewline
33 & 101.5 & 101.485297711287 & 0.0147022887126028 \tabularnewline
34 & 101.9 & 101.781246243511 & 0.118753756488621 \tabularnewline
35 & 102.1 & 102.179278689254 & -0.0792786892535808 \tabularnewline
36 & 102.1 & 102.145216434527 & -0.0452164345270023 \tabularnewline
37 & 102.1 & 102.025082940402 & 0.0749170595979964 \tabularnewline
38 & 102.4 & 102.100715718981 & 0.299284281018664 \tabularnewline
39 & 102.8 & 102.691955669269 & 0.108044330730787 \tabularnewline
40 & 103.1 & 103.030040848472 & 0.069959151528439 \tabularnewline
41 & 103.1 & 103.194913222962 & -0.0949132229619776 \tabularnewline
42 & 102.9 & 102.924400466921 & -0.0244004669205389 \tabularnewline
43 & 102.4 & 102.655294005754 & -0.255294005754493 \tabularnewline
44 & 101.9 & 101.914446196328 & -0.0144461963278918 \tabularnewline
45 & 101.3 & 101.589984250629 & -0.289984250628655 \tabularnewline
46 & 100.7 & 100.890552498066 & -0.190552498066444 \tabularnewline
47 & 100.6 & 100.401098921382 & 0.198901078617602 \tabularnewline
48 & 101 & 100.877459317507 & 0.12254068249349 \tabularnewline
49 & 101.5 & 101.569133264105 & -0.0691332641052293 \tabularnewline
50 & 101.9 & 101.978772669943 & -0.078772669943136 \tabularnewline
51 & 102.1 & 102.26605009441 & -0.166050094410077 \tabularnewline
52 & 102.3 & 102.292973544047 & 0.00702645595290673 \tabularnewline
53 & 102.5 & 102.570520213119 & -0.0705202131185575 \tabularnewline
54 & 102.9 & 102.729977310029 & 0.170022689971441 \tabularnewline
55 & 103.6 & 103.333287160451 & 0.266712839548725 \tabularnewline
56 & 104.3 & 104.223063581768 & 0.0769364182315131 \tabularnewline
\hline
\end{tabular}
%Source: https://freestatistics.org/blog/index.php?pk=57591&T=4

[TABLE]
[ROW][C]Multiple Linear Regression - Actuals, Interpolation, and Residuals[/C][/ROW]
[ROW][C]Time or Index[/C][C]Actuals[/C][C]InterpolationForecast[/C][C]ResidualsPrediction Error[/C][/ROW]
[ROW][C]1[/C][C]99.9[/C][C]99.5343619222163[/C][C]0.365638077783737[/C][/ROW]
[ROW][C]2[/C][C]99.7[/C][C]99.8709468225314[/C][C]-0.170946822531342[/C][/ROW]
[ROW][C]3[/C][C]99.5[/C][C]99.4668986068304[/C][C]0.0331013931695523[/C][/ROW]
[ROW][C]4[/C][C]99.2[/C][C]99.3628910800364[/C][C]-0.162891080036366[/C][/ROW]
[ROW][C]5[/C][C]99[/C][C]98.9779328268604[/C][C]0.0220671731395807[/C][/ROW]
[ROW][C]6[/C][C]99[/C][C]98.9684097170462[/C][C]0.0315902829538136[/C][/ROW]
[ROW][C]7[/C][C]99.3[/C][C]99.1407416961517[/C][C]0.159258303848349[/C][/ROW]
[ROW][C]8[/C][C]99.5[/C][C]99.6773002926816[/C][C]-0.177300292681640[/C][/ROW]
[ROW][C]9[/C][C]99.7[/C][C]99.6324381669013[/C][C]0.067561833098675[/C][/ROW]
[ROW][C]10[/C][C]100[/C][C]99.920695092532[/C][C]0.079304907468001[/C][/ROW]
[ROW][C]11[/C][C]100.4[/C][C]100.292065022975[/C][C]0.107934977025322[/C][/ROW]
[ROW][C]12[/C][C]100.6[/C][C]100.727447279298[/C][C]-0.127447279297661[/C][/ROW]
[ROW][C]13[/C][C]100.7[/C][C]100.650252912169[/C][C]0.0497470878308407[/C][/ROW]
[ROW][C]14[/C][C]100.7[/C][C]100.751391011375[/C][C]-0.0513910113753113[/C][/ROW]
[ROW][C]15[/C][C]100.6[/C][C]100.662782313835[/C][C]-0.0627823138347382[/C][/ROW]
[ROW][C]16[/C][C]100.5[/C][C]100.496372329660[/C][C]0.00362767033975323[/C][/ROW]
[ROW][C]17[/C][C]100.6[/C][C]100.434816645354[/C][C]0.165183354645630[/C][/ROW]
[ROW][C]18[/C][C]100.5[/C][C]100.747024204747[/C][C]-0.247024204746573[/C][/ROW]
[ROW][C]19[/C][C]100.4[/C][C]100.333473458369[/C][C]0.066526541631389[/C][/ROW]
[ROW][C]20[/C][C]100.3[/C][C]100.381685969209[/C][C]-0.081685969209198[/C][/ROW]
[ROW][C]21[/C][C]100.4[/C][C]100.267542106899[/C][C]0.132457893101155[/C][/ROW]
[ROW][C]22[/C][C]100.4[/C][C]100.595830373917[/C][C]-0.195830373917341[/C][/ROW]
[ROW][C]23[/C][C]100.4[/C][C]100.386964122126[/C][C]0.0130358778736025[/C][/ROW]
[ROW][C]24[/C][C]100.4[/C][C]100.479603312099[/C][C]-0.0796033120992248[/C][/ROW]
[ROW][C]25[/C][C]100.4[/C][C]100.469246151021[/C][C]-0.069246151020941[/C][/ROW]
[ROW][C]26[/C][C]100.5[/C][C]100.466620308689[/C][C]0.033379691311282[/C][/ROW]
[ROW][C]27[/C][C]100.6[/C][C]100.669520040203[/C][C]-0.0695200402028997[/C][/ROW]
[ROW][C]28[/C][C]100.6[/C][C]100.713475313465[/C][C]-0.11347531346536[/C][/ROW]
[ROW][C]29[/C][C]100.5[/C][C]100.616041258391[/C][C]-0.116041258391368[/C][/ROW]
[ROW][C]30[/C][C]100.5[/C][C]100.462250252742[/C][C]0.0377497472581364[/C][/ROW]
[ROW][C]31[/C][C]100.7[/C][C]100.621225011431[/C][C]0.0787749885693103[/C][/ROW]
[ROW][C]32[/C][C]101.1[/C][C]100.970993405113[/C][C]0.129006594886629[/C][/ROW]
[ROW][C]33[/C][C]101.5[/C][C]101.485297711287[/C][C]0.0147022887126028[/C][/ROW]
[ROW][C]34[/C][C]101.9[/C][C]101.781246243511[/C][C]0.118753756488621[/C][/ROW]
[ROW][C]35[/C][C]102.1[/C][C]102.179278689254[/C][C]-0.0792786892535808[/C][/ROW]
[ROW][C]36[/C][C]102.1[/C][C]102.145216434527[/C][C]-0.0452164345270023[/C][/ROW]
[ROW][C]37[/C][C]102.1[/C][C]102.025082940402[/C][C]0.0749170595979964[/C][/ROW]
[ROW][C]38[/C][C]102.4[/C][C]102.100715718981[/C][C]0.299284281018664[/C][/ROW]
[ROW][C]39[/C][C]102.8[/C][C]102.691955669269[/C][C]0.108044330730787[/C][/ROW]
[ROW][C]40[/C][C]103.1[/C][C]103.030040848472[/C][C]0.069959151528439[/C][/ROW]
[ROW][C]41[/C][C]103.1[/C][C]103.194913222962[/C][C]-0.0949132229619776[/C][/ROW]
[ROW][C]42[/C][C]102.9[/C][C]102.924400466921[/C][C]-0.0244004669205389[/C][/ROW]
[ROW][C]43[/C][C]102.4[/C][C]102.655294005754[/C][C]-0.255294005754493[/C][/ROW]
[ROW][C]44[/C][C]101.9[/C][C]101.914446196328[/C][C]-0.0144461963278918[/C][/ROW]
[ROW][C]45[/C][C]101.3[/C][C]101.589984250629[/C][C]-0.289984250628655[/C][/ROW]
[ROW][C]46[/C][C]100.7[/C][C]100.890552498066[/C][C]-0.190552498066444[/C][/ROW]
[ROW][C]47[/C][C]100.6[/C][C]100.401098921382[/C][C]0.198901078617602[/C][/ROW]
[ROW][C]48[/C][C]101[/C][C]100.877459317507[/C][C]0.12254068249349[/C][/ROW]
[ROW][C]49[/C][C]101.5[/C][C]101.569133264105[/C][C]-0.0691332641052293[/C][/ROW]
[ROW][C]50[/C][C]101.9[/C][C]101.978772669943[/C][C]-0.078772669943136[/C][/ROW]
[ROW][C]51[/C][C]102.1[/C][C]102.26605009441[/C][C]-0.166050094410077[/C][/ROW]
[ROW][C]52[/C][C]102.3[/C][C]102.292973544047[/C][C]0.00702645595290673[/C][/ROW]
[ROW][C]53[/C][C]102.5[/C][C]102.570520213119[/C][C]-0.0705202131185575[/C][/ROW]
[ROW][C]54[/C][C]102.9[/C][C]102.729977310029[/C][C]0.170022689971441[/C][/ROW]
[ROW][C]55[/C][C]103.6[/C][C]103.333287160451[/C][C]0.266712839548725[/C][/ROW]
[ROW][C]56[/C][C]104.3[/C][C]104.223063581768[/C][C]0.0769364182315131[/C][/ROW]
[/TABLE]
Source: https://freestatistics.org/blog/index.php?pk=57591&T=4

Globally Unique Identifier (entire table): ba.freestatistics.org/blog/index.php?pk=57591&T=4

As an alternative you can also use a QR Code:  

The GUIDs for individual cells are displayed in the table below:

Multiple Linear Regression - Actuals, Interpolation, and Residuals
Time or IndexActualsInterpolationForecastResidualsPrediction Error
199.999.53436192221630.365638077783737
299.799.8709468225314-0.170946822531342
399.599.46689860683040.0331013931695523
499.299.3628910800364-0.162891080036366
59998.97793282686040.0220671731395807
69998.96840971704620.0315902829538136
799.399.14074169615170.159258303848349
899.599.6773002926816-0.177300292681640
999.799.63243816690130.067561833098675
1010099.9206950925320.079304907468001
11100.4100.2920650229750.107934977025322
12100.6100.727447279298-0.127447279297661
13100.7100.6502529121690.0497470878308407
14100.7100.751391011375-0.0513910113753113
15100.6100.662782313835-0.0627823138347382
16100.5100.4963723296600.00362767033975323
17100.6100.4348166453540.165183354645630
18100.5100.747024204747-0.247024204746573
19100.4100.3334734583690.066526541631389
20100.3100.381685969209-0.081685969209198
21100.4100.2675421068990.132457893101155
22100.4100.595830373917-0.195830373917341
23100.4100.3869641221260.0130358778736025
24100.4100.479603312099-0.0796033120992248
25100.4100.469246151021-0.069246151020941
26100.5100.4666203086890.033379691311282
27100.6100.669520040203-0.0695200402028997
28100.6100.713475313465-0.11347531346536
29100.5100.616041258391-0.116041258391368
30100.5100.4622502527420.0377497472581364
31100.7100.6212250114310.0787749885693103
32101.1100.9709934051130.129006594886629
33101.5101.4852977112870.0147022887126028
34101.9101.7812462435110.118753756488621
35102.1102.179278689254-0.0792786892535808
36102.1102.145216434527-0.0452164345270023
37102.1102.0250829404020.0749170595979964
38102.4102.1007157189810.299284281018664
39102.8102.6919556692690.108044330730787
40103.1103.0300408484720.069959151528439
41103.1103.194913222962-0.0949132229619776
42102.9102.924400466921-0.0244004669205389
43102.4102.655294005754-0.255294005754493
44101.9101.914446196328-0.0144461963278918
45101.3101.589984250629-0.289984250628655
46100.7100.890552498066-0.190552498066444
47100.6100.4010989213820.198901078617602
48101100.8774593175070.12254068249349
49101.5101.569133264105-0.0691332641052293
50101.9101.978772669943-0.078772669943136
51102.1102.26605009441-0.166050094410077
52102.3102.2929735440470.00702645595290673
53102.5102.570520213119-0.0705202131185575
54102.9102.7299773100290.170022689971441
55103.6103.3332871604510.266712839548725
56104.3104.2230635817680.0769364182315131


Goldfeld-Quandt test for Heteroskedasticity
p-valuesAlternative Hypothesis
breakpoint indexgreater2-sidedless
100.7025810033693480.5948379932613050.297418996630652
110.647899424651660.704201150696680.35210057534834
120.6505841704461240.6988316591077520.349415829553876
130.5595547379118730.8808905241762530.440445262088127
140.4349419766895880.8698839533791760.565058023310412
150.3312494249632270.6624988499264540.668750575036773
160.2371221335366960.4742442670733920.762877866463304
170.1988721744332790.3977443488665590.80112782556672
180.2968904687370800.5937809374741600.70310953126292
190.2443564741541530.4887129483083050.755643525845847
200.2209281543515750.441856308703150.779071845648425
210.2857882408016150.5715764816032290.714211759198385
220.2572211993732600.5144423987465190.74277880062674
230.2083895451218530.4167790902437070.791610454878147
240.1501481424558690.3002962849117390.849851857544131
250.1045937936659140.2091875873318280.895406206334086
260.07282442427068590.1456488485413720.927175575729314
270.0660857458544360.1321714917088720.933914254145564
280.07348861404126320.1469772280825260.926511385958737
290.09660708552306020.1932141710461200.90339291447694
300.06410516687985560.1282103337597110.935894833120144
310.05913913666288460.1182782733257690.940860863337115
320.08325931070878250.1665186214175650.916740689291218
330.1042068451441500.2084136902883010.89579315485585
340.07657721466593470.1531544293318690.923422785334065
350.05759677183397680.1151935436679540.942403228166023
360.0440846382891590.0881692765783180.95591536171084
370.02913743044033270.05827486088066550.970862569559667
380.1019441976473960.2038883952947910.898055802352604
390.1073291284758300.2146582569516610.89267087152417
400.1036824944169050.2073649888338100.896317505583095
410.083124476822040.166248953644080.91687552317796
420.2416074250532520.4832148501065040.758392574946748
430.3137057201499650.627411440299930.686294279850035
440.6296309267143270.7407381465713460.370369073285673
450.6645102136513680.6709795726972630.335489786348632
460.6453284866218790.7093430267562420.354671513378121

\begin{tabular}{lllllllll}
\hline
Goldfeld-Quandt test for Heteroskedasticity \tabularnewline
p-values & Alternative Hypothesis \tabularnewline
breakpoint index & greater & 2-sided & less \tabularnewline
10 & 0.702581003369348 & 0.594837993261305 & 0.297418996630652 \tabularnewline
11 & 0.64789942465166 & 0.70420115069668 & 0.35210057534834 \tabularnewline
12 & 0.650584170446124 & 0.698831659107752 & 0.349415829553876 \tabularnewline
13 & 0.559554737911873 & 0.880890524176253 & 0.440445262088127 \tabularnewline
14 & 0.434941976689588 & 0.869883953379176 & 0.565058023310412 \tabularnewline
15 & 0.331249424963227 & 0.662498849926454 & 0.668750575036773 \tabularnewline
16 & 0.237122133536696 & 0.474244267073392 & 0.762877866463304 \tabularnewline
17 & 0.198872174433279 & 0.397744348866559 & 0.80112782556672 \tabularnewline
18 & 0.296890468737080 & 0.593780937474160 & 0.70310953126292 \tabularnewline
19 & 0.244356474154153 & 0.488712948308305 & 0.755643525845847 \tabularnewline
20 & 0.220928154351575 & 0.44185630870315 & 0.779071845648425 \tabularnewline
21 & 0.285788240801615 & 0.571576481603229 & 0.714211759198385 \tabularnewline
22 & 0.257221199373260 & 0.514442398746519 & 0.74277880062674 \tabularnewline
23 & 0.208389545121853 & 0.416779090243707 & 0.791610454878147 \tabularnewline
24 & 0.150148142455869 & 0.300296284911739 & 0.849851857544131 \tabularnewline
25 & 0.104593793665914 & 0.209187587331828 & 0.895406206334086 \tabularnewline
26 & 0.0728244242706859 & 0.145648848541372 & 0.927175575729314 \tabularnewline
27 & 0.066085745854436 & 0.132171491708872 & 0.933914254145564 \tabularnewline
28 & 0.0734886140412632 & 0.146977228082526 & 0.926511385958737 \tabularnewline
29 & 0.0966070855230602 & 0.193214171046120 & 0.90339291447694 \tabularnewline
30 & 0.0641051668798556 & 0.128210333759711 & 0.935894833120144 \tabularnewline
31 & 0.0591391366628846 & 0.118278273325769 & 0.940860863337115 \tabularnewline
32 & 0.0832593107087825 & 0.166518621417565 & 0.916740689291218 \tabularnewline
33 & 0.104206845144150 & 0.208413690288301 & 0.89579315485585 \tabularnewline
34 & 0.0765772146659347 & 0.153154429331869 & 0.923422785334065 \tabularnewline
35 & 0.0575967718339768 & 0.115193543667954 & 0.942403228166023 \tabularnewline
36 & 0.044084638289159 & 0.088169276578318 & 0.95591536171084 \tabularnewline
37 & 0.0291374304403327 & 0.0582748608806655 & 0.970862569559667 \tabularnewline
38 & 0.101944197647396 & 0.203888395294791 & 0.898055802352604 \tabularnewline
39 & 0.107329128475830 & 0.214658256951661 & 0.89267087152417 \tabularnewline
40 & 0.103682494416905 & 0.207364988833810 & 0.896317505583095 \tabularnewline
41 & 0.08312447682204 & 0.16624895364408 & 0.91687552317796 \tabularnewline
42 & 0.241607425053252 & 0.483214850106504 & 0.758392574946748 \tabularnewline
43 & 0.313705720149965 & 0.62741144029993 & 0.686294279850035 \tabularnewline
44 & 0.629630926714327 & 0.740738146571346 & 0.370369073285673 \tabularnewline
45 & 0.664510213651368 & 0.670979572697263 & 0.335489786348632 \tabularnewline
46 & 0.645328486621879 & 0.709343026756242 & 0.354671513378121 \tabularnewline
\hline
\end{tabular}
%Source: https://freestatistics.org/blog/index.php?pk=57591&T=5

[TABLE]
[ROW][C]Goldfeld-Quandt test for Heteroskedasticity[/C][/ROW]
[ROW][C]p-values[/C][C]Alternative Hypothesis[/C][/ROW]
[ROW][C]breakpoint index[/C][C]greater[/C][C]2-sided[/C][C]less[/C][/ROW]
[ROW][C]10[/C][C]0.702581003369348[/C][C]0.594837993261305[/C][C]0.297418996630652[/C][/ROW]
[ROW][C]11[/C][C]0.64789942465166[/C][C]0.70420115069668[/C][C]0.35210057534834[/C][/ROW]
[ROW][C]12[/C][C]0.650584170446124[/C][C]0.698831659107752[/C][C]0.349415829553876[/C][/ROW]
[ROW][C]13[/C][C]0.559554737911873[/C][C]0.880890524176253[/C][C]0.440445262088127[/C][/ROW]
[ROW][C]14[/C][C]0.434941976689588[/C][C]0.869883953379176[/C][C]0.565058023310412[/C][/ROW]
[ROW][C]15[/C][C]0.331249424963227[/C][C]0.662498849926454[/C][C]0.668750575036773[/C][/ROW]
[ROW][C]16[/C][C]0.237122133536696[/C][C]0.474244267073392[/C][C]0.762877866463304[/C][/ROW]
[ROW][C]17[/C][C]0.198872174433279[/C][C]0.397744348866559[/C][C]0.80112782556672[/C][/ROW]
[ROW][C]18[/C][C]0.296890468737080[/C][C]0.593780937474160[/C][C]0.70310953126292[/C][/ROW]
[ROW][C]19[/C][C]0.244356474154153[/C][C]0.488712948308305[/C][C]0.755643525845847[/C][/ROW]
[ROW][C]20[/C][C]0.220928154351575[/C][C]0.44185630870315[/C][C]0.779071845648425[/C][/ROW]
[ROW][C]21[/C][C]0.285788240801615[/C][C]0.571576481603229[/C][C]0.714211759198385[/C][/ROW]
[ROW][C]22[/C][C]0.257221199373260[/C][C]0.514442398746519[/C][C]0.74277880062674[/C][/ROW]
[ROW][C]23[/C][C]0.208389545121853[/C][C]0.416779090243707[/C][C]0.791610454878147[/C][/ROW]
[ROW][C]24[/C][C]0.150148142455869[/C][C]0.300296284911739[/C][C]0.849851857544131[/C][/ROW]
[ROW][C]25[/C][C]0.104593793665914[/C][C]0.209187587331828[/C][C]0.895406206334086[/C][/ROW]
[ROW][C]26[/C][C]0.0728244242706859[/C][C]0.145648848541372[/C][C]0.927175575729314[/C][/ROW]
[ROW][C]27[/C][C]0.066085745854436[/C][C]0.132171491708872[/C][C]0.933914254145564[/C][/ROW]
[ROW][C]28[/C][C]0.0734886140412632[/C][C]0.146977228082526[/C][C]0.926511385958737[/C][/ROW]
[ROW][C]29[/C][C]0.0966070855230602[/C][C]0.193214171046120[/C][C]0.90339291447694[/C][/ROW]
[ROW][C]30[/C][C]0.0641051668798556[/C][C]0.128210333759711[/C][C]0.935894833120144[/C][/ROW]
[ROW][C]31[/C][C]0.0591391366628846[/C][C]0.118278273325769[/C][C]0.940860863337115[/C][/ROW]
[ROW][C]32[/C][C]0.0832593107087825[/C][C]0.166518621417565[/C][C]0.916740689291218[/C][/ROW]
[ROW][C]33[/C][C]0.104206845144150[/C][C]0.208413690288301[/C][C]0.89579315485585[/C][/ROW]
[ROW][C]34[/C][C]0.0765772146659347[/C][C]0.153154429331869[/C][C]0.923422785334065[/C][/ROW]
[ROW][C]35[/C][C]0.0575967718339768[/C][C]0.115193543667954[/C][C]0.942403228166023[/C][/ROW]
[ROW][C]36[/C][C]0.044084638289159[/C][C]0.088169276578318[/C][C]0.95591536171084[/C][/ROW]
[ROW][C]37[/C][C]0.0291374304403327[/C][C]0.0582748608806655[/C][C]0.970862569559667[/C][/ROW]
[ROW][C]38[/C][C]0.101944197647396[/C][C]0.203888395294791[/C][C]0.898055802352604[/C][/ROW]
[ROW][C]39[/C][C]0.107329128475830[/C][C]0.214658256951661[/C][C]0.89267087152417[/C][/ROW]
[ROW][C]40[/C][C]0.103682494416905[/C][C]0.207364988833810[/C][C]0.896317505583095[/C][/ROW]
[ROW][C]41[/C][C]0.08312447682204[/C][C]0.16624895364408[/C][C]0.91687552317796[/C][/ROW]
[ROW][C]42[/C][C]0.241607425053252[/C][C]0.483214850106504[/C][C]0.758392574946748[/C][/ROW]
[ROW][C]43[/C][C]0.313705720149965[/C][C]0.62741144029993[/C][C]0.686294279850035[/C][/ROW]
[ROW][C]44[/C][C]0.629630926714327[/C][C]0.740738146571346[/C][C]0.370369073285673[/C][/ROW]
[ROW][C]45[/C][C]0.664510213651368[/C][C]0.670979572697263[/C][C]0.335489786348632[/C][/ROW]
[ROW][C]46[/C][C]0.645328486621879[/C][C]0.709343026756242[/C][C]0.354671513378121[/C][/ROW]
[/TABLE]
Source: https://freestatistics.org/blog/index.php?pk=57591&T=5

Globally Unique Identifier (entire table): ba.freestatistics.org/blog/index.php?pk=57591&T=5

As an alternative you can also use a QR Code:  

The GUIDs for individual cells are displayed in the table below:

Goldfeld-Quandt test for Heteroskedasticity
p-valuesAlternative Hypothesis
breakpoint indexgreater2-sidedless
100.7025810033693480.5948379932613050.297418996630652
110.647899424651660.704201150696680.35210057534834
120.6505841704461240.6988316591077520.349415829553876
130.5595547379118730.8808905241762530.440445262088127
140.4349419766895880.8698839533791760.565058023310412
150.3312494249632270.6624988499264540.668750575036773
160.2371221335366960.4742442670733920.762877866463304
170.1988721744332790.3977443488665590.80112782556672
180.2968904687370800.5937809374741600.70310953126292
190.2443564741541530.4887129483083050.755643525845847
200.2209281543515750.441856308703150.779071845648425
210.2857882408016150.5715764816032290.714211759198385
220.2572211993732600.5144423987465190.74277880062674
230.2083895451218530.4167790902437070.791610454878147
240.1501481424558690.3002962849117390.849851857544131
250.1045937936659140.2091875873318280.895406206334086
260.07282442427068590.1456488485413720.927175575729314
270.0660857458544360.1321714917088720.933914254145564
280.07348861404126320.1469772280825260.926511385958737
290.09660708552306020.1932141710461200.90339291447694
300.06410516687985560.1282103337597110.935894833120144
310.05913913666288460.1182782733257690.940860863337115
320.08325931070878250.1665186214175650.916740689291218
330.1042068451441500.2084136902883010.89579315485585
340.07657721466593470.1531544293318690.923422785334065
350.05759677183397680.1151935436679540.942403228166023
360.0440846382891590.0881692765783180.95591536171084
370.02913743044033270.05827486088066550.970862569559667
380.1019441976473960.2038883952947910.898055802352604
390.1073291284758300.2146582569516610.89267087152417
400.1036824944169050.2073649888338100.896317505583095
410.083124476822040.166248953644080.91687552317796
420.2416074250532520.4832148501065040.758392574946748
430.3137057201499650.627411440299930.686294279850035
440.6296309267143270.7407381465713460.370369073285673
450.6645102136513680.6709795726972630.335489786348632
460.6453284866218790.7093430267562420.354671513378121


Meta Analysis of Goldfeld-Quandt test for Heteroskedasticity
Description# significant tests% significant testsOK/NOK
1% type I error level00OK
5% type I error level00OK
10% type I error level20.0540540540540541OK

\begin{tabular}{lllllllll}
\hline
Meta Analysis of Goldfeld-Quandt test for Heteroskedasticity \tabularnewline
Description & # significant tests & % significant tests & OK/NOK \tabularnewline
1% type I error level & 0 & 0 & OK \tabularnewline
5% type I error level & 0 & 0 & OK \tabularnewline
10% type I error level & 2 & 0.0540540540540541 & OK \tabularnewline
\hline
\end{tabular}
%Source: https://freestatistics.org/blog/index.php?pk=57591&T=6

[TABLE]
[ROW][C]Meta Analysis of Goldfeld-Quandt test for Heteroskedasticity[/C][/ROW]
[ROW][C]Description[/C][C]# significant tests[/C][C]% significant tests[/C][C]OK/NOK[/C][/ROW]
[ROW][C]1% type I error level[/C][C]0[/C][C]0[/C][C]OK[/C][/ROW]
[ROW][C]5% type I error level[/C][C]0[/C][C]0[/C][C]OK[/C][/ROW]
[ROW][C]10% type I error level[/C][C]2[/C][C]0.0540540540540541[/C][C]OK[/C][/ROW]
[/TABLE]
Source: https://freestatistics.org/blog/index.php?pk=57591&T=6

Globally Unique Identifier (entire table): ba.freestatistics.org/blog/index.php?pk=57591&T=6

As an alternative you can also use a QR Code:  

The GUIDs for individual cells are displayed in the table below:

Meta Analysis of Goldfeld-Quandt test for Heteroskedasticity
Description# significant tests% significant testsOK/NOK
1% type I error level00OK
5% type I error level00OK
10% type I error level20.0540540540540541OK


Parameters (Session):
par1 = 1 ; par2 = Include Monthly Dummies ; par3 = Linear Trend ;
Parameters (R input):
par1 = 2 ; par2 = Do not include Seasonal Dummies ; par3 = Linear Trend ;
R code (references can be found in the software module):
library(lattice)
library(lmtest)
n25 <- 25 #minimum number of obs. for Goldfeld-Quandt test
par1 <- as.numeric(par1)
x <- t(y)
k <- length(x[1,])
n <- length(x[,1])
x1 <- cbind(x[,par1], x[,1:k!=par1])
mycolnames <- c(colnames(x)[par1], colnames(x)[1:k!=par1])
colnames(x1) <- mycolnames #colnames(x)[par1]
x <- x1
if (par3 == 'First Differences'){
x2 <- array(0, dim=c(n-1,k), dimnames=list(1:(n-1), paste('(1-B)',colnames(x),sep='')))
for (i in 1:n-1) {
for (j in 1:k) {
x2[i,j] <- x[i+1,j] - x[i,j]
}
}
x <- x2
}
if (par2 == 'Include Monthly Dummies'){
x2 <- array(0, dim=c(n,11), dimnames=list(1:n, paste('M', seq(1:11), sep ='')))
for (i in 1:11){
x2[seq(i,n,12),i] <- 1
}
x <- cbind(x, x2)
}
if (par2 == 'Include Quarterly Dummies'){
x2 <- array(0, dim=c(n,3), dimnames=list(1:n, paste('Q', seq(1:3), sep ='')))
for (i in 1:3){
x2[seq(i,n,4),i] <- 1
}
x <- cbind(x, x2)
}
k <- length(x[1,])
if (par3 == 'Linear Trend'){
x <- cbind(x, c(1:n))
colnames(x)[k+1] <- 't'
}
x
k <- length(x[1,])
df <- as.data.frame(x)
(mylm <- lm(df))
(mysum <- summary(mylm))
if (n > n25) {
kp3 <- k + 3
nmkm3 <- n - k - 3
gqarr <- array(NA, dim=c(nmkm3-kp3+1,3))
numgqtests <- 0
numsignificant1 <- 0
numsignificant5 <- 0
numsignificant10 <- 0
for (mypoint in kp3:nmkm3) {
j <- 0
numgqtests <- numgqtests + 1
for (myalt in c('greater', 'two.sided', 'less')) {
j <- j + 1
gqarr[mypoint-kp3+1,j] <- gqtest(mylm, point=mypoint, alternative=myalt)$p.value
}
if (gqarr[mypoint-kp3+1,2] < 0.01) numsignificant1 <- numsignificant1 + 1
if (gqarr[mypoint-kp3+1,2] < 0.05) numsignificant5 <- numsignificant5 + 1
if (gqarr[mypoint-kp3+1,2] < 0.10) numsignificant10 <- numsignificant10 + 1
}
gqarr
}
bitmap(file='test0.png')
plot(x[,1], type='l', main='Actuals and Interpolation', ylab='value of Actuals and Interpolation (dots)', xlab='time or index')
points(x[,1]-mysum$resid)
grid()
dev.off()
bitmap(file='test1.png')
plot(mysum$resid, type='b', pch=19, main='Residuals', ylab='value of Residuals', xlab='time or index')
grid()
dev.off()
bitmap(file='test2.png')
hist(mysum$resid, main='Residual Histogram', xlab='values of Residuals')
grid()
dev.off()
bitmap(file='test3.png')
densityplot(~mysum$resid,col='black',main='Residual Density Plot', xlab='values of Residuals')
dev.off()
bitmap(file='test4.png')
qqnorm(mysum$resid, main='Residual Normal Q-Q Plot')
qqline(mysum$resid)
grid()
dev.off()
(myerror <- as.ts(mysum$resid))
bitmap(file='test5.png')
dum <- cbind(lag(myerror,k=1),myerror)
dum
dum1 <- dum[2:length(myerror),]
dum1
z <- as.data.frame(dum1)
z
plot(z,main=paste('Residual Lag plot, lowess, and regression line'), ylab='values of Residuals', xlab='lagged values of Residuals')
lines(lowess(z))
abline(lm(z))
grid()
dev.off()
bitmap(file='test6.png')
acf(mysum$resid, lag.max=length(mysum$resid)/2, main='Residual Autocorrelation Function')
grid()
dev.off()
bitmap(file='test7.png')
pacf(mysum$resid, lag.max=length(mysum$resid)/2, main='Residual Partial Autocorrelation Function')
grid()
dev.off()
bitmap(file='test8.png')
opar <- par(mfrow = c(2,2), oma = c(0, 0, 1.1, 0))
plot(mylm, las = 1, sub='Residual Diagnostics')
par(opar)
dev.off()
if (n > n25) {
bitmap(file='test9.png')
plot(kp3:nmkm3,gqarr[,2], main='Goldfeld-Quandt test',ylab='2-sided p-value',xlab='breakpoint')
grid()
dev.off()
}
load(file='createtable')
a<-table.start()
a<-table.row.start(a)
a<-table.element(a, 'Multiple Linear Regression - Estimated Regression Equation', 1, TRUE)
a<-table.row.end(a)
myeq <- colnames(x)[1]
myeq <- paste(myeq, '[t] = ', sep='')
for (i in 1:k){
if (mysum$coefficients[i,1] > 0) myeq <- paste(myeq, '+', '')
myeq <- paste(myeq, mysum$coefficients[i,1], sep=' ')
if (rownames(mysum$coefficients)[i] != '(Intercept)') {
myeq <- paste(myeq, rownames(mysum$coefficients)[i], sep='')
if (rownames(mysum$coefficients)[i] != 't') myeq <- paste(myeq, '[t]', sep='')
}
}
myeq <- paste(myeq, ' + e[t]')
a<-table.row.start(a)
a<-table.element(a, myeq)
a<-table.row.end(a)
a<-table.end(a)
table.save(a,file='mytable1.tab')
a<-table.start()
a<-table.row.start(a)
a<-table.element(a,hyperlink('ols1.htm','Multiple Linear Regression - Ordinary Least Squares',''), 6, TRUE)
a<-table.row.end(a)
a<-table.row.start(a)
a<-table.element(a,'Variable',header=TRUE)
a<-table.element(a,'Parameter',header=TRUE)
a<-table.element(a,'S.D.',header=TRUE)
a<-table.element(a,'T-STAT
H0: parameter = 0',header=TRUE)
a<-table.element(a,'2-tail p-value',header=TRUE)
a<-table.element(a,'1-tail p-value',header=TRUE)
a<-table.row.end(a)
for (i in 1:k){
a<-table.row.start(a)
a<-table.element(a,rownames(mysum$coefficients)[i],header=TRUE)
a<-table.element(a,mysum$coefficients[i,1])
a<-table.element(a, round(mysum$coefficients[i,2],6))
a<-table.element(a, round(mysum$coefficients[i,3],4))
a<-table.element(a, round(mysum$coefficients[i,4],6))
a<-table.element(a, round(mysum$coefficients[i,4]/2,6))
a<-table.row.end(a)
}
a<-table.end(a)
table.save(a,file='mytable2.tab')
a<-table.start()
a<-table.row.start(a)
a<-table.element(a, 'Multiple Linear Regression - Regression Statistics', 2, TRUE)
a<-table.row.end(a)
a<-table.row.start(a)
a<-table.element(a, 'Multiple R',1,TRUE)
a<-table.element(a, sqrt(mysum$r.squared))
a<-table.row.end(a)
a<-table.row.start(a)
a<-table.element(a, 'R-squared',1,TRUE)
a<-table.element(a, mysum$r.squared)
a<-table.row.end(a)
a<-table.row.start(a)
a<-table.element(a, 'Adjusted R-squared',1,TRUE)
a<-table.element(a, mysum$adj.r.squared)
a<-table.row.end(a)
a<-table.row.start(a)
a<-table.element(a, 'F-TEST (value)',1,TRUE)
a<-table.element(a, mysum$fstatistic[1])
a<-table.row.end(a)
a<-table.row.start(a)
a<-table.element(a, 'F-TEST (DF numerator)',1,TRUE)
a<-table.element(a, mysum$fstatistic[2])
a<-table.row.end(a)
a<-table.row.start(a)
a<-table.element(a, 'F-TEST (DF denominator)',1,TRUE)
a<-table.element(a, mysum$fstatistic[3])
a<-table.row.end(a)
a<-table.row.start(a)
a<-table.element(a, 'p-value',1,TRUE)
a<-table.element(a, 1-pf(mysum$fstatistic[1],mysum$fstatistic[2],mysum$fstatistic[3]))
a<-table.row.end(a)
a<-table.row.start(a)
a<-table.element(a, 'Multiple Linear Regression - Residual Statistics', 2, TRUE)
a<-table.row.end(a)
a<-table.row.start(a)
a<-table.element(a, 'Residual Standard Deviation',1,TRUE)
a<-table.element(a, mysum$sigma)
a<-table.row.end(a)
a<-table.row.start(a)
a<-table.element(a, 'Sum Squared Residuals',1,TRUE)
a<-table.element(a, sum(myerror*myerror))
a<-table.row.end(a)
a<-table.end(a)
table.save(a,file='mytable3.tab')
a<-table.start()
a<-table.row.start(a)
a<-table.element(a, 'Multiple Linear Regression - Actuals, Interpolation, and Residuals', 4, TRUE)
a<-table.row.end(a)
a<-table.row.start(a)
a<-table.element(a, 'Time or Index', 1, TRUE)
a<-table.element(a, 'Actuals', 1, TRUE)
a<-table.element(a, 'Interpolation
Forecast', 1, TRUE)
a<-table.element(a, 'Residuals
Prediction Error', 1, TRUE)
a<-table.row.end(a)
for (i in 1:n) {
a<-table.row.start(a)
a<-table.element(a,i, 1, TRUE)
a<-table.element(a,x[i])
a<-table.element(a,x[i]-mysum$resid[i])
a<-table.element(a,mysum$resid[i])
a<-table.row.end(a)
}
a<-table.end(a)
table.save(a,file='mytable4.tab')
if (n > n25) {
a<-table.start()
a<-table.row.start(a)
a<-table.element(a,'Goldfeld-Quandt test for Heteroskedasticity',4,TRUE)
a<-table.row.end(a)
a<-table.row.start(a)
a<-table.element(a,'p-values',header=TRUE)
a<-table.element(a,'Alternative Hypothesis',3,header=TRUE)
a<-table.row.end(a)
a<-table.row.start(a)
a<-table.element(a,'breakpoint index',header=TRUE)
a<-table.element(a,'greater',header=TRUE)
a<-table.element(a,'2-sided',header=TRUE)
a<-table.element(a,'less',header=TRUE)
a<-table.row.end(a)
for (mypoint in kp3:nmkm3) {
a<-table.row.start(a)
a<-table.element(a,mypoint,header=TRUE)
a<-table.element(a,gqarr[mypoint-kp3+1,1])
a<-table.element(a,gqarr[mypoint-kp3+1,2])
a<-table.element(a,gqarr[mypoint-kp3+1,3])
a<-table.row.end(a)
}
a<-table.end(a)
table.save(a,file='mytable5.tab')
a<-table.start()
a<-table.row.start(a)
a<-table.element(a,'Meta Analysis of Goldfeld-Quandt test for Heteroskedasticity',4,TRUE)
a<-table.row.end(a)
a<-table.row.start(a)
a<-table.element(a,'Description',header=TRUE)
a<-table.element(a,'# significant tests',header=TRUE)
a<-table.element(a,'% significant tests',header=TRUE)
a<-table.element(a,'OK/NOK',header=TRUE)
a<-table.row.end(a)
a<-table.row.start(a)
a<-table.element(a,'1% type I error level',header=TRUE)
a<-table.element(a,numsignificant1)
a<-table.element(a,numsignificant1/numgqtests)
if (numsignificant1/numgqtests < 0.01) dum <- 'OK' else dum <- 'NOK'
a<-table.element(a,dum)
a<-table.row.end(a)
a<-table.row.start(a)
a<-table.element(a,'5% type I error level',header=TRUE)
a<-table.element(a,numsignificant5)
a<-table.element(a,numsignificant5/numgqtests)
if (numsignificant5/numgqtests < 0.05) dum <- 'OK' else dum <- 'NOK'
a<-table.element(a,dum)
a<-table.row.end(a)
a<-table.row.start(a)
a<-table.element(a,'10% type I error level',header=TRUE)
a<-table.element(a,numsignificant10)
a<-table.element(a,numsignificant10/numgqtests)
if (numsignificant10/numgqtests < 0.1) dum <- 'OK' else dum <- 'NOK'
a<-table.element(a,dum)
a<-table.row.end(a)
a<-table.end(a)
table.save(a,file='mytable6.tab')
}