Free Statistics

of Irreproducible Research!

Author's title

Author*The author of this computation has been verified*
R Software Modulerwasp_multipleregression.wasp
Title produced by softwareMultiple Regression
Date of computationWed, 18 Nov 2009 12:47:38 -0700
Cite this page as followsStatistical Computations at FreeStatistics.org, Office for Research Development and Education, URL https://freestatistics.org/blog/index.php?v=date/2009/Nov/18/t125857379798etzi9m4ifizlt.htm/, Retrieved Sun, 05 May 2024 14:41:27 +0000
Statistical Computations at FreeStatistics.org, Office for Research Development and Education, URL https://freestatistics.org/blog/index.php?pk=57607, Retrieved Sun, 05 May 2024 14:41:27 +0000
QR Codes:

Original text written by user:
IsPrivate?No (this computation is public)
User-defined keywordsTijdsperiode 2004 - 2009 Basisjaar 2000 = 100 Quarterly dummies Linear trend
Estimated Impact171
Family? (F = Feedback message, R = changed R code, M = changed R Module, P = changed Parameters, D = changed Data)
-     [Multiple Regression] [Q1 The Seatbeltlaw] [2007-11-14 19:27:43] [8cd6641b921d30ebe00b648d1481bba0]
- RM D  [Multiple Regression] [Seatbelt] [2009-11-12 14:06:21] [b98453cac15ba1066b407e146608df68]
-   PD      [Multiple Regression] [Grondstofprijsind...] [2009-11-18 19:47:38] [c483349466b1550829c7523719d2d027] [Current]
Feedback Forum

Post a new message
Dataseries X:
117.1	95.1
118.7	97
126.5	112.7
127.5	102.9
134.6	97.4
131.8	111.4
135.9	87.4
142.7	96.8
141.7	114.1
153.4	110.3
145	103.9
137.7	101.6
148.3	94.6
152.2	95.9
169.4	104.7
168.6	102.8
161.1	98.1
174.1	113.9
179	80.9
190.6	95.7
190	113.2
181.6	105.9
174.8	108.8
180.5	102.3
196.8	99
193.8	100.7
197	115.5
216.3	100.7
221.4	109.9
217.9	114.6
229.7	85.4
227.4	100.5
204.2	114.8
196.6	116.5
198.8	112.9
207.5	102
190.7	106
201.6	105.3
210.5	118.8
223.5	106.1
223.8	109.3
231.2	117.2
244	92.5
234.7	104.2
250.2	112.5
265.7	122.4
287.6	113.3
283.3	100
295.4	110.7
312.3	112.8
333.8	109.8
347.7	117.3
383.2	109.1
407.1	115.9
413.6	96
362.7	99.8
321.9	116.8
239.4	115.7
191	99.4
159.7	94.3
163.4	91


Summary of computational transaction
Raw Inputview raw input (R code)
Raw Outputview raw output of R engine
Computing time3 seconds
R Server'Gwilym Jenkins' @ 72.249.127.135

\begin{tabular}{lllllllll}
\hline
Summary of computational transaction \tabularnewline
Raw Input & view raw input (R code)  \tabularnewline
Raw Output & view raw output of R engine  \tabularnewline
Computing time & 3 seconds \tabularnewline
R Server & 'Gwilym Jenkins' @ 72.249.127.135 \tabularnewline
\hline
\end{tabular}
%Source: https://freestatistics.org/blog/index.php?pk=57607&T=0

[TABLE]
[ROW][C]Summary of computational transaction[/C][/ROW]
[ROW][C]Raw Input[/C][C]view raw input (R code) [/C][/ROW]
[ROW][C]Raw Output[/C][C]view raw output of R engine [/C][/ROW]
[ROW][C]Computing time[/C][C]3 seconds[/C][/ROW]
[ROW][C]R Server[/C][C]'Gwilym Jenkins' @ 72.249.127.135[/C][/ROW]
[/TABLE]
Source: https://freestatistics.org/blog/index.php?pk=57607&T=0

Globally Unique Identifier (entire table): ba.freestatistics.org/blog/index.php?pk=57607&T=0

As an alternative you can also use a QR Code:  

The GUIDs for individual cells are displayed in the table below:

Summary of computational transaction
Raw Inputview raw input (R code)
Raw Outputview raw output of R engine
Computing time3 seconds
R Server'Gwilym Jenkins' @ 72.249.127.135


Multiple Linear Regression - Estimated Regression Equation
Energieprijsindex[t] = + 8.00420722973749 + 1.07246415184596totindusprodindex[t] -6.22216318831792Q1[t] -5.33459235212556Q2[t] + 3.70062778916478Q3[t] + 3.02642527434408t + e[t]

\begin{tabular}{lllllllll}
\hline
Multiple Linear Regression - Estimated Regression Equation \tabularnewline
Energieprijsindex[t] =  +  8.00420722973749 +  1.07246415184596totindusprodindex[t] -6.22216318831792Q1[t] -5.33459235212556Q2[t] +  3.70062778916478Q3[t] +  3.02642527434408t  + e[t] \tabularnewline
\hline
\end{tabular}
%Source: https://freestatistics.org/blog/index.php?pk=57607&T=1

[TABLE]
[ROW][C]Multiple Linear Regression - Estimated Regression Equation[/C][/ROW]
[ROW][C]Energieprijsindex[t] =  +  8.00420722973749 +  1.07246415184596totindusprodindex[t] -6.22216318831792Q1[t] -5.33459235212556Q2[t] +  3.70062778916478Q3[t] +  3.02642527434408t  + e[t][/C][/ROW]
[/TABLE]
Source: https://freestatistics.org/blog/index.php?pk=57607&T=1

Globally Unique Identifier (entire table): ba.freestatistics.org/blog/index.php?pk=57607&T=1

As an alternative you can also use a QR Code:  

The GUIDs for individual cells are displayed in the table below:

Multiple Linear Regression - Estimated Regression Equation
Energieprijsindex[t] = + 8.00420722973749 + 1.07246415184596totindusprodindex[t] -6.22216318831792Q1[t] -5.33459235212556Q2[t] + 3.70062778916478Q3[t] + 3.02642527434408t + e[t]


Multiple Linear Regression - Ordinary Least Squares
VariableParameterS.D.T-STATH0: parameter = 02-tail p-value1-tail p-value
(Intercept)8.0042072297374973.6272960.10870.9138260.456913
totindusprodindex1.072464151845960.736461.45620.1510110.075505
Q1-6.2221631883179216.973724-0.36660.7153420.357671
Q2-5.3345923521255618.188964-0.29330.7704060.385203
Q33.7006277891647816.9962720.21770.8284440.414222
t3.026425274344080.3522228.592400

\begin{tabular}{lllllllll}
\hline
Multiple Linear Regression - Ordinary Least Squares \tabularnewline
Variable & Parameter & S.D. & T-STATH0: parameter = 0 & 2-tail p-value & 1-tail p-value \tabularnewline
(Intercept) & 8.00420722973749 & 73.627296 & 0.1087 & 0.913826 & 0.456913 \tabularnewline
totindusprodindex & 1.07246415184596 & 0.73646 & 1.4562 & 0.151011 & 0.075505 \tabularnewline
Q1 & -6.22216318831792 & 16.973724 & -0.3666 & 0.715342 & 0.357671 \tabularnewline
Q2 & -5.33459235212556 & 18.188964 & -0.2933 & 0.770406 & 0.385203 \tabularnewline
Q3 & 3.70062778916478 & 16.996272 & 0.2177 & 0.828444 & 0.414222 \tabularnewline
t & 3.02642527434408 & 0.352222 & 8.5924 & 0 & 0 \tabularnewline
\hline
\end{tabular}
%Source: https://freestatistics.org/blog/index.php?pk=57607&T=2

[TABLE]
[ROW][C]Multiple Linear Regression - Ordinary Least Squares[/C][/ROW]
[ROW][C]Variable[/C][C]Parameter[/C][C]S.D.[/C][C]T-STATH0: parameter = 0[/C][C]2-tail p-value[/C][C]1-tail p-value[/C][/ROW]
[ROW][C](Intercept)[/C][C]8.00420722973749[/C][C]73.627296[/C][C]0.1087[/C][C]0.913826[/C][C]0.456913[/C][/ROW]
[ROW][C]totindusprodindex[/C][C]1.07246415184596[/C][C]0.73646[/C][C]1.4562[/C][C]0.151011[/C][C]0.075505[/C][/ROW]
[ROW][C]Q1[/C][C]-6.22216318831792[/C][C]16.973724[/C][C]-0.3666[/C][C]0.715342[/C][C]0.357671[/C][/ROW]
[ROW][C]Q2[/C][C]-5.33459235212556[/C][C]18.188964[/C][C]-0.2933[/C][C]0.770406[/C][C]0.385203[/C][/ROW]
[ROW][C]Q3[/C][C]3.70062778916478[/C][C]16.996272[/C][C]0.2177[/C][C]0.828444[/C][C]0.414222[/C][/ROW]
[ROW][C]t[/C][C]3.02642527434408[/C][C]0.352222[/C][C]8.5924[/C][C]0[/C][C]0[/C][/ROW]
[/TABLE]
Source: https://freestatistics.org/blog/index.php?pk=57607&T=2

Globally Unique Identifier (entire table): ba.freestatistics.org/blog/index.php?pk=57607&T=2

As an alternative you can also use a QR Code:  

The GUIDs for individual cells are displayed in the table below:

Multiple Linear Regression - Ordinary Least Squares
VariableParameterS.D.T-STATH0: parameter = 02-tail p-value1-tail p-value
(Intercept)8.0042072297374973.6272960.10870.9138260.456913
totindusprodindex1.072464151845960.736461.45620.1510110.075505
Q1-6.2221631883179216.973724-0.36660.7153420.357671
Q2-5.3345923521255618.188964-0.29330.7704060.385203
Q33.7006277891647816.9962720.21770.8284440.414222
t3.026425274344080.3522228.592400


Multiple Linear Regression - Regression Statistics
Multiple R0.787977569766432
R-squared0.620908650455013
Adjusted R-squared0.586445800496378
F-TEST (value)18.0167528570699
F-TEST (DF numerator)5
F-TEST (DF denominator)55
p-value1.52458712321391e-10
Multiple Linear Regression - Residual Statistics
Residual Standard Deviation46.4808264055017
Sum Squared Residuals118825.697283611

\begin{tabular}{lllllllll}
\hline
Multiple Linear Regression - Regression Statistics \tabularnewline
Multiple R & 0.787977569766432 \tabularnewline
R-squared & 0.620908650455013 \tabularnewline
Adjusted R-squared & 0.586445800496378 \tabularnewline
F-TEST (value) & 18.0167528570699 \tabularnewline
F-TEST (DF numerator) & 5 \tabularnewline
F-TEST (DF denominator) & 55 \tabularnewline
p-value & 1.52458712321391e-10 \tabularnewline
Multiple Linear Regression - Residual Statistics \tabularnewline
Residual Standard Deviation & 46.4808264055017 \tabularnewline
Sum Squared Residuals & 118825.697283611 \tabularnewline
\hline
\end{tabular}
%Source: https://freestatistics.org/blog/index.php?pk=57607&T=3

[TABLE]
[ROW][C]Multiple Linear Regression - Regression Statistics[/C][/ROW]
[ROW][C]Multiple R[/C][C]0.787977569766432[/C][/ROW]
[ROW][C]R-squared[/C][C]0.620908650455013[/C][/ROW]
[ROW][C]Adjusted R-squared[/C][C]0.586445800496378[/C][/ROW]
[ROW][C]F-TEST (value)[/C][C]18.0167528570699[/C][/ROW]
[ROW][C]F-TEST (DF numerator)[/C][C]5[/C][/ROW]
[ROW][C]F-TEST (DF denominator)[/C][C]55[/C][/ROW]
[ROW][C]p-value[/C][C]1.52458712321391e-10[/C][/ROW]
[ROW][C]Multiple Linear Regression - Residual Statistics[/C][/ROW]
[ROW][C]Residual Standard Deviation[/C][C]46.4808264055017[/C][/ROW]
[ROW][C]Sum Squared Residuals[/C][C]118825.697283611[/C][/ROW]
[/TABLE]
Source: https://freestatistics.org/blog/index.php?pk=57607&T=3

Globally Unique Identifier (entire table): ba.freestatistics.org/blog/index.php?pk=57607&T=3

As an alternative you can also use a QR Code:  

The GUIDs for individual cells are displayed in the table below:

Multiple Linear Regression - Regression Statistics
Multiple R0.787977569766432
R-squared0.620908650455013
Adjusted R-squared0.586445800496378
F-TEST (value)18.0167528570699
F-TEST (DF numerator)5
F-TEST (DF denominator)55
p-value1.52458712321391e-10
Multiple Linear Regression - Residual Statistics
Residual Standard Deviation46.4808264055017
Sum Squared Residuals118825.697283611


Multiple Linear Regression - Actuals, Interpolation, and Residuals
Time or IndexActualsInterpolationForecastResidualsPrediction Error
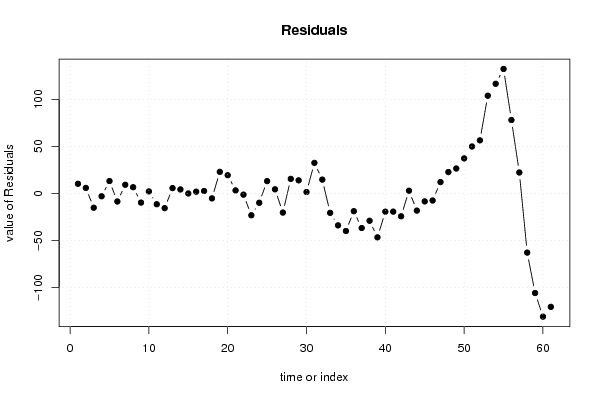
1117.1106.79981015631410.3001898436863
2118.7112.7514881553585.94851184464198
3126.5141.650820754974-15.1508207549741
4127.5130.466469552063-2.96646955206286
5134.6121.37217880293613.2278211970637
6131.8140.300673039316-8.50067303931608
7135.9126.6231788106489.27682118935242
8142.7136.0301393231796.66986067682111
9141.7151.38803123614-9.6880312361401
10153.4151.2266635696622.17333643033807
11145156.424538413482-11.4245384134822
12137.7153.283668349416-15.5836683494158
13148.3142.5806813725205.71931862747976
14152.2147.8888808804564.31111911954351
15169.4169.3882108323350.0117891676646906
16168.6166.6763264290071.92367357099271
17161.1158.4400070013572.65999299864257
18174.1179.29893671106-5.19893671106007
19179155.96926511577823.0307348842221
20190.6171.16753204827719.4324679517227
21190186.7399167916083.26008320839226
22181.6182.824924593669-1.22492459366874
23174.8197.996716049656-23.1967160496564
24180.5190.351496547837-9.85149654783698
25196.8183.61662693277113.1833730672285
26193.8189.3538121014464.44618789855394
27197217.287926964401-20.2879269644007
28216.3200.74125500226015.5587449977402
29221.4207.41218728526913.9878127147313
30217.9216.3667649094811.53323509051879
31229.7197.11245709121432.5875429087863
32227.4212.63246326926714.7675367307331
33204.2224.772962726690-20.5729627266903
34196.6230.510147895365-33.9101478953649
35198.8238.710922364354-39.9109223643538
36207.5226.346860594412-18.8468605944122
37190.7227.440979287822-36.7409792878222
38201.6230.604250492066-29.0042504920665
39210.5257.144161957621-46.6441619576213
40223.5242.849664714357-19.3496647143569
41223.8243.08581208629-19.2858120862901
42231.2255.472274996410-24.2722749964097
43244241.0440558614492.95594413855106
44234.7252.917683923226-18.2176839232260
45250.2258.623398469574-8.42339846957358
46265.7273.154789683385-7.45478968338505
47287.6275.45701131722112.1429886827788
48283.3260.51903558284922.7809644171508
49295.4268.79866409362726.6013359063728
50312.3274.9648349230437.3351650769598
51333.8283.80908788313749.9909121168633
52347.7291.17836650716156.5216334928393
53383.2279.18842254805104.01157745195
54407.1290.395174891139116.704825108861
55413.6281.114783685039132.485216314961
56362.7284.51594494723378.1840550527672
57321.9299.5520976146422.3479023853598
58239.4302.286383158146-62.8863831581461
59191296.866862898691-105.866862898691
60159.7290.723093209456-131.023093209456
61163.4283.988223594391-120.588223594391

\begin{tabular}{lllllllll}
\hline
Multiple Linear Regression - Actuals, Interpolation, and Residuals \tabularnewline
Time or Index & Actuals & InterpolationForecast & ResidualsPrediction Error \tabularnewline
1 & 117.1 & 106.799810156314 & 10.3001898436863 \tabularnewline
2 & 118.7 & 112.751488155358 & 5.94851184464198 \tabularnewline
3 & 126.5 & 141.650820754974 & -15.1508207549741 \tabularnewline
4 & 127.5 & 130.466469552063 & -2.96646955206286 \tabularnewline
5 & 134.6 & 121.372178802936 & 13.2278211970637 \tabularnewline
6 & 131.8 & 140.300673039316 & -8.50067303931608 \tabularnewline
7 & 135.9 & 126.623178810648 & 9.27682118935242 \tabularnewline
8 & 142.7 & 136.030139323179 & 6.66986067682111 \tabularnewline
9 & 141.7 & 151.38803123614 & -9.6880312361401 \tabularnewline
10 & 153.4 & 151.226663569662 & 2.17333643033807 \tabularnewline
11 & 145 & 156.424538413482 & -11.4245384134822 \tabularnewline
12 & 137.7 & 153.283668349416 & -15.5836683494158 \tabularnewline
13 & 148.3 & 142.580681372520 & 5.71931862747976 \tabularnewline
14 & 152.2 & 147.888880880456 & 4.31111911954351 \tabularnewline
15 & 169.4 & 169.388210832335 & 0.0117891676646906 \tabularnewline
16 & 168.6 & 166.676326429007 & 1.92367357099271 \tabularnewline
17 & 161.1 & 158.440007001357 & 2.65999299864257 \tabularnewline
18 & 174.1 & 179.29893671106 & -5.19893671106007 \tabularnewline
19 & 179 & 155.969265115778 & 23.0307348842221 \tabularnewline
20 & 190.6 & 171.167532048277 & 19.4324679517227 \tabularnewline
21 & 190 & 186.739916791608 & 3.26008320839226 \tabularnewline
22 & 181.6 & 182.824924593669 & -1.22492459366874 \tabularnewline
23 & 174.8 & 197.996716049656 & -23.1967160496564 \tabularnewline
24 & 180.5 & 190.351496547837 & -9.85149654783698 \tabularnewline
25 & 196.8 & 183.616626932771 & 13.1833730672285 \tabularnewline
26 & 193.8 & 189.353812101446 & 4.44618789855394 \tabularnewline
27 & 197 & 217.287926964401 & -20.2879269644007 \tabularnewline
28 & 216.3 & 200.741255002260 & 15.5587449977402 \tabularnewline
29 & 221.4 & 207.412187285269 & 13.9878127147313 \tabularnewline
30 & 217.9 & 216.366764909481 & 1.53323509051879 \tabularnewline
31 & 229.7 & 197.112457091214 & 32.5875429087863 \tabularnewline
32 & 227.4 & 212.632463269267 & 14.7675367307331 \tabularnewline
33 & 204.2 & 224.772962726690 & -20.5729627266903 \tabularnewline
34 & 196.6 & 230.510147895365 & -33.9101478953649 \tabularnewline
35 & 198.8 & 238.710922364354 & -39.9109223643538 \tabularnewline
36 & 207.5 & 226.346860594412 & -18.8468605944122 \tabularnewline
37 & 190.7 & 227.440979287822 & -36.7409792878222 \tabularnewline
38 & 201.6 & 230.604250492066 & -29.0042504920665 \tabularnewline
39 & 210.5 & 257.144161957621 & -46.6441619576213 \tabularnewline
40 & 223.5 & 242.849664714357 & -19.3496647143569 \tabularnewline
41 & 223.8 & 243.08581208629 & -19.2858120862901 \tabularnewline
42 & 231.2 & 255.472274996410 & -24.2722749964097 \tabularnewline
43 & 244 & 241.044055861449 & 2.95594413855106 \tabularnewline
44 & 234.7 & 252.917683923226 & -18.2176839232260 \tabularnewline
45 & 250.2 & 258.623398469574 & -8.42339846957358 \tabularnewline
46 & 265.7 & 273.154789683385 & -7.45478968338505 \tabularnewline
47 & 287.6 & 275.457011317221 & 12.1429886827788 \tabularnewline
48 & 283.3 & 260.519035582849 & 22.7809644171508 \tabularnewline
49 & 295.4 & 268.798664093627 & 26.6013359063728 \tabularnewline
50 & 312.3 & 274.96483492304 & 37.3351650769598 \tabularnewline
51 & 333.8 & 283.809087883137 & 49.9909121168633 \tabularnewline
52 & 347.7 & 291.178366507161 & 56.5216334928393 \tabularnewline
53 & 383.2 & 279.18842254805 & 104.01157745195 \tabularnewline
54 & 407.1 & 290.395174891139 & 116.704825108861 \tabularnewline
55 & 413.6 & 281.114783685039 & 132.485216314961 \tabularnewline
56 & 362.7 & 284.515944947233 & 78.1840550527672 \tabularnewline
57 & 321.9 & 299.55209761464 & 22.3479023853598 \tabularnewline
58 & 239.4 & 302.286383158146 & -62.8863831581461 \tabularnewline
59 & 191 & 296.866862898691 & -105.866862898691 \tabularnewline
60 & 159.7 & 290.723093209456 & -131.023093209456 \tabularnewline
61 & 163.4 & 283.988223594391 & -120.588223594391 \tabularnewline
\hline
\end{tabular}
%Source: https://freestatistics.org/blog/index.php?pk=57607&T=4

[TABLE]
[ROW][C]Multiple Linear Regression - Actuals, Interpolation, and Residuals[/C][/ROW]
[ROW][C]Time or Index[/C][C]Actuals[/C][C]InterpolationForecast[/C][C]ResidualsPrediction Error[/C][/ROW]
[ROW][C]1[/C][C]117.1[/C][C]106.799810156314[/C][C]10.3001898436863[/C][/ROW]
[ROW][C]2[/C][C]118.7[/C][C]112.751488155358[/C][C]5.94851184464198[/C][/ROW]
[ROW][C]3[/C][C]126.5[/C][C]141.650820754974[/C][C]-15.1508207549741[/C][/ROW]
[ROW][C]4[/C][C]127.5[/C][C]130.466469552063[/C][C]-2.96646955206286[/C][/ROW]
[ROW][C]5[/C][C]134.6[/C][C]121.372178802936[/C][C]13.2278211970637[/C][/ROW]
[ROW][C]6[/C][C]131.8[/C][C]140.300673039316[/C][C]-8.50067303931608[/C][/ROW]
[ROW][C]7[/C][C]135.9[/C][C]126.623178810648[/C][C]9.27682118935242[/C][/ROW]
[ROW][C]8[/C][C]142.7[/C][C]136.030139323179[/C][C]6.66986067682111[/C][/ROW]
[ROW][C]9[/C][C]141.7[/C][C]151.38803123614[/C][C]-9.6880312361401[/C][/ROW]
[ROW][C]10[/C][C]153.4[/C][C]151.226663569662[/C][C]2.17333643033807[/C][/ROW]
[ROW][C]11[/C][C]145[/C][C]156.424538413482[/C][C]-11.4245384134822[/C][/ROW]
[ROW][C]12[/C][C]137.7[/C][C]153.283668349416[/C][C]-15.5836683494158[/C][/ROW]
[ROW][C]13[/C][C]148.3[/C][C]142.580681372520[/C][C]5.71931862747976[/C][/ROW]
[ROW][C]14[/C][C]152.2[/C][C]147.888880880456[/C][C]4.31111911954351[/C][/ROW]
[ROW][C]15[/C][C]169.4[/C][C]169.388210832335[/C][C]0.0117891676646906[/C][/ROW]
[ROW][C]16[/C][C]168.6[/C][C]166.676326429007[/C][C]1.92367357099271[/C][/ROW]
[ROW][C]17[/C][C]161.1[/C][C]158.440007001357[/C][C]2.65999299864257[/C][/ROW]
[ROW][C]18[/C][C]174.1[/C][C]179.29893671106[/C][C]-5.19893671106007[/C][/ROW]
[ROW][C]19[/C][C]179[/C][C]155.969265115778[/C][C]23.0307348842221[/C][/ROW]
[ROW][C]20[/C][C]190.6[/C][C]171.167532048277[/C][C]19.4324679517227[/C][/ROW]
[ROW][C]21[/C][C]190[/C][C]186.739916791608[/C][C]3.26008320839226[/C][/ROW]
[ROW][C]22[/C][C]181.6[/C][C]182.824924593669[/C][C]-1.22492459366874[/C][/ROW]
[ROW][C]23[/C][C]174.8[/C][C]197.996716049656[/C][C]-23.1967160496564[/C][/ROW]
[ROW][C]24[/C][C]180.5[/C][C]190.351496547837[/C][C]-9.85149654783698[/C][/ROW]
[ROW][C]25[/C][C]196.8[/C][C]183.616626932771[/C][C]13.1833730672285[/C][/ROW]
[ROW][C]26[/C][C]193.8[/C][C]189.353812101446[/C][C]4.44618789855394[/C][/ROW]
[ROW][C]27[/C][C]197[/C][C]217.287926964401[/C][C]-20.2879269644007[/C][/ROW]
[ROW][C]28[/C][C]216.3[/C][C]200.741255002260[/C][C]15.5587449977402[/C][/ROW]
[ROW][C]29[/C][C]221.4[/C][C]207.412187285269[/C][C]13.9878127147313[/C][/ROW]
[ROW][C]30[/C][C]217.9[/C][C]216.366764909481[/C][C]1.53323509051879[/C][/ROW]
[ROW][C]31[/C][C]229.7[/C][C]197.112457091214[/C][C]32.5875429087863[/C][/ROW]
[ROW][C]32[/C][C]227.4[/C][C]212.632463269267[/C][C]14.7675367307331[/C][/ROW]
[ROW][C]33[/C][C]204.2[/C][C]224.772962726690[/C][C]-20.5729627266903[/C][/ROW]
[ROW][C]34[/C][C]196.6[/C][C]230.510147895365[/C][C]-33.9101478953649[/C][/ROW]
[ROW][C]35[/C][C]198.8[/C][C]238.710922364354[/C][C]-39.9109223643538[/C][/ROW]
[ROW][C]36[/C][C]207.5[/C][C]226.346860594412[/C][C]-18.8468605944122[/C][/ROW]
[ROW][C]37[/C][C]190.7[/C][C]227.440979287822[/C][C]-36.7409792878222[/C][/ROW]
[ROW][C]38[/C][C]201.6[/C][C]230.604250492066[/C][C]-29.0042504920665[/C][/ROW]
[ROW][C]39[/C][C]210.5[/C][C]257.144161957621[/C][C]-46.6441619576213[/C][/ROW]
[ROW][C]40[/C][C]223.5[/C][C]242.849664714357[/C][C]-19.3496647143569[/C][/ROW]
[ROW][C]41[/C][C]223.8[/C][C]243.08581208629[/C][C]-19.2858120862901[/C][/ROW]
[ROW][C]42[/C][C]231.2[/C][C]255.472274996410[/C][C]-24.2722749964097[/C][/ROW]
[ROW][C]43[/C][C]244[/C][C]241.044055861449[/C][C]2.95594413855106[/C][/ROW]
[ROW][C]44[/C][C]234.7[/C][C]252.917683923226[/C][C]-18.2176839232260[/C][/ROW]
[ROW][C]45[/C][C]250.2[/C][C]258.623398469574[/C][C]-8.42339846957358[/C][/ROW]
[ROW][C]46[/C][C]265.7[/C][C]273.154789683385[/C][C]-7.45478968338505[/C][/ROW]
[ROW][C]47[/C][C]287.6[/C][C]275.457011317221[/C][C]12.1429886827788[/C][/ROW]
[ROW][C]48[/C][C]283.3[/C][C]260.519035582849[/C][C]22.7809644171508[/C][/ROW]
[ROW][C]49[/C][C]295.4[/C][C]268.798664093627[/C][C]26.6013359063728[/C][/ROW]
[ROW][C]50[/C][C]312.3[/C][C]274.96483492304[/C][C]37.3351650769598[/C][/ROW]
[ROW][C]51[/C][C]333.8[/C][C]283.809087883137[/C][C]49.9909121168633[/C][/ROW]
[ROW][C]52[/C][C]347.7[/C][C]291.178366507161[/C][C]56.5216334928393[/C][/ROW]
[ROW][C]53[/C][C]383.2[/C][C]279.18842254805[/C][C]104.01157745195[/C][/ROW]
[ROW][C]54[/C][C]407.1[/C][C]290.395174891139[/C][C]116.704825108861[/C][/ROW]
[ROW][C]55[/C][C]413.6[/C][C]281.114783685039[/C][C]132.485216314961[/C][/ROW]
[ROW][C]56[/C][C]362.7[/C][C]284.515944947233[/C][C]78.1840550527672[/C][/ROW]
[ROW][C]57[/C][C]321.9[/C][C]299.55209761464[/C][C]22.3479023853598[/C][/ROW]
[ROW][C]58[/C][C]239.4[/C][C]302.286383158146[/C][C]-62.8863831581461[/C][/ROW]
[ROW][C]59[/C][C]191[/C][C]296.866862898691[/C][C]-105.866862898691[/C][/ROW]
[ROW][C]60[/C][C]159.7[/C][C]290.723093209456[/C][C]-131.023093209456[/C][/ROW]
[ROW][C]61[/C][C]163.4[/C][C]283.988223594391[/C][C]-120.588223594391[/C][/ROW]
[/TABLE]
Source: https://freestatistics.org/blog/index.php?pk=57607&T=4

Globally Unique Identifier (entire table): ba.freestatistics.org/blog/index.php?pk=57607&T=4

As an alternative you can also use a QR Code:  

The GUIDs for individual cells are displayed in the table below:

Multiple Linear Regression - Actuals, Interpolation, and Residuals
Time or IndexActualsInterpolationForecastResidualsPrediction Error
1117.1106.79981015631410.3001898436863
2118.7112.7514881553585.94851184464198
3126.5141.650820754974-15.1508207549741
4127.5130.466469552063-2.96646955206286
5134.6121.37217880293613.2278211970637
6131.8140.300673039316-8.50067303931608
7135.9126.6231788106489.27682118935242
8142.7136.0301393231796.66986067682111
9141.7151.38803123614-9.6880312361401
10153.4151.2266635696622.17333643033807
11145156.424538413482-11.4245384134822
12137.7153.283668349416-15.5836683494158
13148.3142.5806813725205.71931862747976
14152.2147.8888808804564.31111911954351
15169.4169.3882108323350.0117891676646906
16168.6166.6763264290071.92367357099271
17161.1158.4400070013572.65999299864257
18174.1179.29893671106-5.19893671106007
19179155.96926511577823.0307348842221
20190.6171.16753204827719.4324679517227
21190186.7399167916083.26008320839226
22181.6182.824924593669-1.22492459366874
23174.8197.996716049656-23.1967160496564
24180.5190.351496547837-9.85149654783698
25196.8183.61662693277113.1833730672285
26193.8189.3538121014464.44618789855394
27197217.287926964401-20.2879269644007
28216.3200.74125500226015.5587449977402
29221.4207.41218728526913.9878127147313
30217.9216.3667649094811.53323509051879
31229.7197.11245709121432.5875429087863
32227.4212.63246326926714.7675367307331
33204.2224.772962726690-20.5729627266903
34196.6230.510147895365-33.9101478953649
35198.8238.710922364354-39.9109223643538
36207.5226.346860594412-18.8468605944122
37190.7227.440979287822-36.7409792878222
38201.6230.604250492066-29.0042504920665
39210.5257.144161957621-46.6441619576213
40223.5242.849664714357-19.3496647143569
41223.8243.08581208629-19.2858120862901
42231.2255.472274996410-24.2722749964097
43244241.0440558614492.95594413855106
44234.7252.917683923226-18.2176839232260
45250.2258.623398469574-8.42339846957358
46265.7273.154789683385-7.45478968338505
47287.6275.45701131722112.1429886827788
48283.3260.51903558284922.7809644171508
49295.4268.79866409362726.6013359063728
50312.3274.9648349230437.3351650769598
51333.8283.80908788313749.9909121168633
52347.7291.17836650716156.5216334928393
53383.2279.18842254805104.01157745195
54407.1290.395174891139116.704825108861
55413.6281.114783685039132.485216314961
56362.7284.51594494723378.1840550527672
57321.9299.5520976146422.3479023853598
58239.4302.286383158146-62.8863831581461
59191296.866862898691-105.866862898691
60159.7290.723093209456-131.023093209456
61163.4283.988223594391-120.588223594391


Goldfeld-Quandt test for Heteroskedasticity
p-valuesAlternative Hypothesis
breakpoint indexgreater2-sidedless
90.0002855111640381480.0005710223280762960.999714488835962
108.9179686443723e-050.0001783593728874460.999910820313556
111.49298498015162e-052.98596996030325e-050.999985070150198
121.85590972052239e-053.71181944104479e-050.999981440902795
132.23495716773956e-064.46991433547912e-060.999997765042832
142.36015983991667e-074.72031967983334e-070.999999763984016
151.00456449493701e-072.00912898987401e-070.99999989954355
162.30364935936087e-084.60729871872175e-080.999999976963506
172.81795211215379e-095.63590422430759e-090.999999997182048
183.36279369894091e-106.72558739788181e-100.99999999966372
196.81301711292285e-111.36260342258457e-100.99999999993187
206.04554157164597e-111.20910831432919e-100.999999999939545
211.16556418056542e-112.33112836113085e-110.999999999988344
221.61839197425718e-123.23678394851436e-120.999999999998382
231.62087272589024e-123.24174545178048e-120.999999999998379
244.26688036127809e-138.53376072255619e-130.999999999999573
256.27478712202247e-141.25495742440449e-130.999999999999937
267.62401354806323e-151.52480270961265e-140.999999999999992
279.49491367910636e-161.89898273582127e-151
285.29711701993917e-161.05942340398783e-151
292.39160882865998e-164.78321765731995e-161
303.65246498128505e-177.3049299625701e-171
313.02031153725308e-176.04062307450616e-171
325.41522820528595e-181.08304564105719e-171
337.5307202208982e-181.50614404417964e-171
343.53781628782863e-177.07563257565727e-171
358.74412788208518e-171.74882557641704e-161
366.89445448731108e-171.37889089746222e-161
376.47700700892697e-161.29540140178539e-151
384.75382369793854e-169.50764739587707e-161
395.77400140217404e-161.15480028043481e-151
401.27456509313913e-162.54913018627826e-161
412.68094047377385e-175.3618809475477e-171
427.77913076342767e-181.55582615268553e-171
431.20233984156447e-182.40467968312894e-181
443.51660902134046e-197.03321804268093e-191
452.24990170534993e-194.49980341069986e-191
461.82683186993496e-183.65366373986992e-181
471.58883086139002e-163.17766172278003e-161
483.69722051334623e-167.39444102669246e-161
493.47583543916558e-146.95167087833117e-140.999999999999965
502.31199336018357e-104.62398672036713e-100.9999999997688
511.74159116745418e-063.48318233490835e-060.999998258408832
520.0004918066140422170.0009836132280844340.999508193385958

\begin{tabular}{lllllllll}
\hline
Goldfeld-Quandt test for Heteroskedasticity \tabularnewline
p-values & Alternative Hypothesis \tabularnewline
breakpoint index & greater & 2-sided & less \tabularnewline
9 & 0.000285511164038148 & 0.000571022328076296 & 0.999714488835962 \tabularnewline
10 & 8.9179686443723e-05 & 0.000178359372887446 & 0.999910820313556 \tabularnewline
11 & 1.49298498015162e-05 & 2.98596996030325e-05 & 0.999985070150198 \tabularnewline
12 & 1.85590972052239e-05 & 3.71181944104479e-05 & 0.999981440902795 \tabularnewline
13 & 2.23495716773956e-06 & 4.46991433547912e-06 & 0.999997765042832 \tabularnewline
14 & 2.36015983991667e-07 & 4.72031967983334e-07 & 0.999999763984016 \tabularnewline
15 & 1.00456449493701e-07 & 2.00912898987401e-07 & 0.99999989954355 \tabularnewline
16 & 2.30364935936087e-08 & 4.60729871872175e-08 & 0.999999976963506 \tabularnewline
17 & 2.81795211215379e-09 & 5.63590422430759e-09 & 0.999999997182048 \tabularnewline
18 & 3.36279369894091e-10 & 6.72558739788181e-10 & 0.99999999966372 \tabularnewline
19 & 6.81301711292285e-11 & 1.36260342258457e-10 & 0.99999999993187 \tabularnewline
20 & 6.04554157164597e-11 & 1.20910831432919e-10 & 0.999999999939545 \tabularnewline
21 & 1.16556418056542e-11 & 2.33112836113085e-11 & 0.999999999988344 \tabularnewline
22 & 1.61839197425718e-12 & 3.23678394851436e-12 & 0.999999999998382 \tabularnewline
23 & 1.62087272589024e-12 & 3.24174545178048e-12 & 0.999999999998379 \tabularnewline
24 & 4.26688036127809e-13 & 8.53376072255619e-13 & 0.999999999999573 \tabularnewline
25 & 6.27478712202247e-14 & 1.25495742440449e-13 & 0.999999999999937 \tabularnewline
26 & 7.62401354806323e-15 & 1.52480270961265e-14 & 0.999999999999992 \tabularnewline
27 & 9.49491367910636e-16 & 1.89898273582127e-15 & 1 \tabularnewline
28 & 5.29711701993917e-16 & 1.05942340398783e-15 & 1 \tabularnewline
29 & 2.39160882865998e-16 & 4.78321765731995e-16 & 1 \tabularnewline
30 & 3.65246498128505e-17 & 7.3049299625701e-17 & 1 \tabularnewline
31 & 3.02031153725308e-17 & 6.04062307450616e-17 & 1 \tabularnewline
32 & 5.41522820528595e-18 & 1.08304564105719e-17 & 1 \tabularnewline
33 & 7.5307202208982e-18 & 1.50614404417964e-17 & 1 \tabularnewline
34 & 3.53781628782863e-17 & 7.07563257565727e-17 & 1 \tabularnewline
35 & 8.74412788208518e-17 & 1.74882557641704e-16 & 1 \tabularnewline
36 & 6.89445448731108e-17 & 1.37889089746222e-16 & 1 \tabularnewline
37 & 6.47700700892697e-16 & 1.29540140178539e-15 & 1 \tabularnewline
38 & 4.75382369793854e-16 & 9.50764739587707e-16 & 1 \tabularnewline
39 & 5.77400140217404e-16 & 1.15480028043481e-15 & 1 \tabularnewline
40 & 1.27456509313913e-16 & 2.54913018627826e-16 & 1 \tabularnewline
41 & 2.68094047377385e-17 & 5.3618809475477e-17 & 1 \tabularnewline
42 & 7.77913076342767e-18 & 1.55582615268553e-17 & 1 \tabularnewline
43 & 1.20233984156447e-18 & 2.40467968312894e-18 & 1 \tabularnewline
44 & 3.51660902134046e-19 & 7.03321804268093e-19 & 1 \tabularnewline
45 & 2.24990170534993e-19 & 4.49980341069986e-19 & 1 \tabularnewline
46 & 1.82683186993496e-18 & 3.65366373986992e-18 & 1 \tabularnewline
47 & 1.58883086139002e-16 & 3.17766172278003e-16 & 1 \tabularnewline
48 & 3.69722051334623e-16 & 7.39444102669246e-16 & 1 \tabularnewline
49 & 3.47583543916558e-14 & 6.95167087833117e-14 & 0.999999999999965 \tabularnewline
50 & 2.31199336018357e-10 & 4.62398672036713e-10 & 0.9999999997688 \tabularnewline
51 & 1.74159116745418e-06 & 3.48318233490835e-06 & 0.999998258408832 \tabularnewline
52 & 0.000491806614042217 & 0.000983613228084434 & 0.999508193385958 \tabularnewline
\hline
\end{tabular}
%Source: https://freestatistics.org/blog/index.php?pk=57607&T=5

[TABLE]
[ROW][C]Goldfeld-Quandt test for Heteroskedasticity[/C][/ROW]
[ROW][C]p-values[/C][C]Alternative Hypothesis[/C][/ROW]
[ROW][C]breakpoint index[/C][C]greater[/C][C]2-sided[/C][C]less[/C][/ROW]
[ROW][C]9[/C][C]0.000285511164038148[/C][C]0.000571022328076296[/C][C]0.999714488835962[/C][/ROW]
[ROW][C]10[/C][C]8.9179686443723e-05[/C][C]0.000178359372887446[/C][C]0.999910820313556[/C][/ROW]
[ROW][C]11[/C][C]1.49298498015162e-05[/C][C]2.98596996030325e-05[/C][C]0.999985070150198[/C][/ROW]
[ROW][C]12[/C][C]1.85590972052239e-05[/C][C]3.71181944104479e-05[/C][C]0.999981440902795[/C][/ROW]
[ROW][C]13[/C][C]2.23495716773956e-06[/C][C]4.46991433547912e-06[/C][C]0.999997765042832[/C][/ROW]
[ROW][C]14[/C][C]2.36015983991667e-07[/C][C]4.72031967983334e-07[/C][C]0.999999763984016[/C][/ROW]
[ROW][C]15[/C][C]1.00456449493701e-07[/C][C]2.00912898987401e-07[/C][C]0.99999989954355[/C][/ROW]
[ROW][C]16[/C][C]2.30364935936087e-08[/C][C]4.60729871872175e-08[/C][C]0.999999976963506[/C][/ROW]
[ROW][C]17[/C][C]2.81795211215379e-09[/C][C]5.63590422430759e-09[/C][C]0.999999997182048[/C][/ROW]
[ROW][C]18[/C][C]3.36279369894091e-10[/C][C]6.72558739788181e-10[/C][C]0.99999999966372[/C][/ROW]
[ROW][C]19[/C][C]6.81301711292285e-11[/C][C]1.36260342258457e-10[/C][C]0.99999999993187[/C][/ROW]
[ROW][C]20[/C][C]6.04554157164597e-11[/C][C]1.20910831432919e-10[/C][C]0.999999999939545[/C][/ROW]
[ROW][C]21[/C][C]1.16556418056542e-11[/C][C]2.33112836113085e-11[/C][C]0.999999999988344[/C][/ROW]
[ROW][C]22[/C][C]1.61839197425718e-12[/C][C]3.23678394851436e-12[/C][C]0.999999999998382[/C][/ROW]
[ROW][C]23[/C][C]1.62087272589024e-12[/C][C]3.24174545178048e-12[/C][C]0.999999999998379[/C][/ROW]
[ROW][C]24[/C][C]4.26688036127809e-13[/C][C]8.53376072255619e-13[/C][C]0.999999999999573[/C][/ROW]
[ROW][C]25[/C][C]6.27478712202247e-14[/C][C]1.25495742440449e-13[/C][C]0.999999999999937[/C][/ROW]
[ROW][C]26[/C][C]7.62401354806323e-15[/C][C]1.52480270961265e-14[/C][C]0.999999999999992[/C][/ROW]
[ROW][C]27[/C][C]9.49491367910636e-16[/C][C]1.89898273582127e-15[/C][C]1[/C][/ROW]
[ROW][C]28[/C][C]5.29711701993917e-16[/C][C]1.05942340398783e-15[/C][C]1[/C][/ROW]
[ROW][C]29[/C][C]2.39160882865998e-16[/C][C]4.78321765731995e-16[/C][C]1[/C][/ROW]
[ROW][C]30[/C][C]3.65246498128505e-17[/C][C]7.3049299625701e-17[/C][C]1[/C][/ROW]
[ROW][C]31[/C][C]3.02031153725308e-17[/C][C]6.04062307450616e-17[/C][C]1[/C][/ROW]
[ROW][C]32[/C][C]5.41522820528595e-18[/C][C]1.08304564105719e-17[/C][C]1[/C][/ROW]
[ROW][C]33[/C][C]7.5307202208982e-18[/C][C]1.50614404417964e-17[/C][C]1[/C][/ROW]
[ROW][C]34[/C][C]3.53781628782863e-17[/C][C]7.07563257565727e-17[/C][C]1[/C][/ROW]
[ROW][C]35[/C][C]8.74412788208518e-17[/C][C]1.74882557641704e-16[/C][C]1[/C][/ROW]
[ROW][C]36[/C][C]6.89445448731108e-17[/C][C]1.37889089746222e-16[/C][C]1[/C][/ROW]
[ROW][C]37[/C][C]6.47700700892697e-16[/C][C]1.29540140178539e-15[/C][C]1[/C][/ROW]
[ROW][C]38[/C][C]4.75382369793854e-16[/C][C]9.50764739587707e-16[/C][C]1[/C][/ROW]
[ROW][C]39[/C][C]5.77400140217404e-16[/C][C]1.15480028043481e-15[/C][C]1[/C][/ROW]
[ROW][C]40[/C][C]1.27456509313913e-16[/C][C]2.54913018627826e-16[/C][C]1[/C][/ROW]
[ROW][C]41[/C][C]2.68094047377385e-17[/C][C]5.3618809475477e-17[/C][C]1[/C][/ROW]
[ROW][C]42[/C][C]7.77913076342767e-18[/C][C]1.55582615268553e-17[/C][C]1[/C][/ROW]
[ROW][C]43[/C][C]1.20233984156447e-18[/C][C]2.40467968312894e-18[/C][C]1[/C][/ROW]
[ROW][C]44[/C][C]3.51660902134046e-19[/C][C]7.03321804268093e-19[/C][C]1[/C][/ROW]
[ROW][C]45[/C][C]2.24990170534993e-19[/C][C]4.49980341069986e-19[/C][C]1[/C][/ROW]
[ROW][C]46[/C][C]1.82683186993496e-18[/C][C]3.65366373986992e-18[/C][C]1[/C][/ROW]
[ROW][C]47[/C][C]1.58883086139002e-16[/C][C]3.17766172278003e-16[/C][C]1[/C][/ROW]
[ROW][C]48[/C][C]3.69722051334623e-16[/C][C]7.39444102669246e-16[/C][C]1[/C][/ROW]
[ROW][C]49[/C][C]3.47583543916558e-14[/C][C]6.95167087833117e-14[/C][C]0.999999999999965[/C][/ROW]
[ROW][C]50[/C][C]2.31199336018357e-10[/C][C]4.62398672036713e-10[/C][C]0.9999999997688[/C][/ROW]
[ROW][C]51[/C][C]1.74159116745418e-06[/C][C]3.48318233490835e-06[/C][C]0.999998258408832[/C][/ROW]
[ROW][C]52[/C][C]0.000491806614042217[/C][C]0.000983613228084434[/C][C]0.999508193385958[/C][/ROW]
[/TABLE]
Source: https://freestatistics.org/blog/index.php?pk=57607&T=5

Globally Unique Identifier (entire table): ba.freestatistics.org/blog/index.php?pk=57607&T=5

As an alternative you can also use a QR Code:  

The GUIDs for individual cells are displayed in the table below:

Goldfeld-Quandt test for Heteroskedasticity
p-valuesAlternative Hypothesis
breakpoint indexgreater2-sidedless
90.0002855111640381480.0005710223280762960.999714488835962
108.9179686443723e-050.0001783593728874460.999910820313556
111.49298498015162e-052.98596996030325e-050.999985070150198
121.85590972052239e-053.71181944104479e-050.999981440902795
132.23495716773956e-064.46991433547912e-060.999997765042832
142.36015983991667e-074.72031967983334e-070.999999763984016
151.00456449493701e-072.00912898987401e-070.99999989954355
162.30364935936087e-084.60729871872175e-080.999999976963506
172.81795211215379e-095.63590422430759e-090.999999997182048
183.36279369894091e-106.72558739788181e-100.99999999966372
196.81301711292285e-111.36260342258457e-100.99999999993187
206.04554157164597e-111.20910831432919e-100.999999999939545
211.16556418056542e-112.33112836113085e-110.999999999988344
221.61839197425718e-123.23678394851436e-120.999999999998382
231.62087272589024e-123.24174545178048e-120.999999999998379
244.26688036127809e-138.53376072255619e-130.999999999999573
256.27478712202247e-141.25495742440449e-130.999999999999937
267.62401354806323e-151.52480270961265e-140.999999999999992
279.49491367910636e-161.89898273582127e-151
285.29711701993917e-161.05942340398783e-151
292.39160882865998e-164.78321765731995e-161
303.65246498128505e-177.3049299625701e-171
313.02031153725308e-176.04062307450616e-171
325.41522820528595e-181.08304564105719e-171
337.5307202208982e-181.50614404417964e-171
343.53781628782863e-177.07563257565727e-171
358.74412788208518e-171.74882557641704e-161
366.89445448731108e-171.37889089746222e-161
376.47700700892697e-161.29540140178539e-151
384.75382369793854e-169.50764739587707e-161
395.77400140217404e-161.15480028043481e-151
401.27456509313913e-162.54913018627826e-161
412.68094047377385e-175.3618809475477e-171
427.77913076342767e-181.55582615268553e-171
431.20233984156447e-182.40467968312894e-181
443.51660902134046e-197.03321804268093e-191
452.24990170534993e-194.49980341069986e-191
461.82683186993496e-183.65366373986992e-181
471.58883086139002e-163.17766172278003e-161
483.69722051334623e-167.39444102669246e-161
493.47583543916558e-146.95167087833117e-140.999999999999965
502.31199336018357e-104.62398672036713e-100.9999999997688
511.74159116745418e-063.48318233490835e-060.999998258408832
520.0004918066140422170.0009836132280844340.999508193385958


Meta Analysis of Goldfeld-Quandt test for Heteroskedasticity
Description# significant tests% significant testsOK/NOK
1% type I error level441NOK
5% type I error level441NOK
10% type I error level441NOK

\begin{tabular}{lllllllll}
\hline
Meta Analysis of Goldfeld-Quandt test for Heteroskedasticity \tabularnewline
Description & # significant tests & % significant tests & OK/NOK \tabularnewline
1% type I error level & 44 & 1 & NOK \tabularnewline
5% type I error level & 44 & 1 & NOK \tabularnewline
10% type I error level & 44 & 1 & NOK \tabularnewline
\hline
\end{tabular}
%Source: https://freestatistics.org/blog/index.php?pk=57607&T=6

[TABLE]
[ROW][C]Meta Analysis of Goldfeld-Quandt test for Heteroskedasticity[/C][/ROW]
[ROW][C]Description[/C][C]# significant tests[/C][C]% significant tests[/C][C]OK/NOK[/C][/ROW]
[ROW][C]1% type I error level[/C][C]44[/C][C]1[/C][C]NOK[/C][/ROW]
[ROW][C]5% type I error level[/C][C]44[/C][C]1[/C][C]NOK[/C][/ROW]
[ROW][C]10% type I error level[/C][C]44[/C][C]1[/C][C]NOK[/C][/ROW]
[/TABLE]
Source: https://freestatistics.org/blog/index.php?pk=57607&T=6

Globally Unique Identifier (entire table): ba.freestatistics.org/blog/index.php?pk=57607&T=6

As an alternative you can also use a QR Code:  

The GUIDs for individual cells are displayed in the table below:

Meta Analysis of Goldfeld-Quandt test for Heteroskedasticity
Description# significant tests% significant testsOK/NOK
1% type I error level441NOK
5% type I error level441NOK
10% type I error level441NOK


Parameters (Session):
par1 = 1 ; par2 = Include Quarterly Dummies ; par3 = Linear Trend ;
Parameters (R input):
par1 = 1 ; par2 = Include Quarterly Dummies ; par3 = Linear Trend ;
R code (references can be found in the software module):
library(lattice)
library(lmtest)
n25 <- 25 #minimum number of obs. for Goldfeld-Quandt test
par1 <- as.numeric(par1)
x <- t(y)
k <- length(x[1,])
n <- length(x[,1])
x1 <- cbind(x[,par1], x[,1:k!=par1])
mycolnames <- c(colnames(x)[par1], colnames(x)[1:k!=par1])
colnames(x1) <- mycolnames #colnames(x)[par1]
x <- x1
if (par3 == 'First Differences'){
x2 <- array(0, dim=c(n-1,k), dimnames=list(1:(n-1), paste('(1-B)',colnames(x),sep='')))
for (i in 1:n-1) {
for (j in 1:k) {
x2[i,j] <- x[i+1,j] - x[i,j]
}
}
x <- x2
}
if (par2 == 'Include Monthly Dummies'){
x2 <- array(0, dim=c(n,11), dimnames=list(1:n, paste('M', seq(1:11), sep ='')))
for (i in 1:11){
x2[seq(i,n,12),i] <- 1
}
x <- cbind(x, x2)
}
if (par2 == 'Include Quarterly Dummies'){
x2 <- array(0, dim=c(n,3), dimnames=list(1:n, paste('Q', seq(1:3), sep ='')))
for (i in 1:3){
x2[seq(i,n,4),i] <- 1
}
x <- cbind(x, x2)
}
k <- length(x[1,])
if (par3 == 'Linear Trend'){
x <- cbind(x, c(1:n))
colnames(x)[k+1] <- 't'
}
x
k <- length(x[1,])
df <- as.data.frame(x)
(mylm <- lm(df))
(mysum <- summary(mylm))
if (n > n25) {
kp3 <- k + 3
nmkm3 <- n - k - 3
gqarr <- array(NA, dim=c(nmkm3-kp3+1,3))
numgqtests <- 0
numsignificant1 <- 0
numsignificant5 <- 0
numsignificant10 <- 0
for (mypoint in kp3:nmkm3) {
j <- 0
numgqtests <- numgqtests + 1
for (myalt in c('greater', 'two.sided', 'less')) {
j <- j + 1
gqarr[mypoint-kp3+1,j] <- gqtest(mylm, point=mypoint, alternative=myalt)$p.value
}
if (gqarr[mypoint-kp3+1,2] < 0.01) numsignificant1 <- numsignificant1 + 1
if (gqarr[mypoint-kp3+1,2] < 0.05) numsignificant5 <- numsignificant5 + 1
if (gqarr[mypoint-kp3+1,2] < 0.10) numsignificant10 <- numsignificant10 + 1
}
gqarr
}
bitmap(file='test0.png')
plot(x[,1], type='l', main='Actuals and Interpolation', ylab='value of Actuals and Interpolation (dots)', xlab='time or index')
points(x[,1]-mysum$resid)
grid()
dev.off()
bitmap(file='test1.png')
plot(mysum$resid, type='b', pch=19, main='Residuals', ylab='value of Residuals', xlab='time or index')
grid()
dev.off()
bitmap(file='test2.png')
hist(mysum$resid, main='Residual Histogram', xlab='values of Residuals')
grid()
dev.off()
bitmap(file='test3.png')
densityplot(~mysum$resid,col='black',main='Residual Density Plot', xlab='values of Residuals')
dev.off()
bitmap(file='test4.png')
qqnorm(mysum$resid, main='Residual Normal Q-Q Plot')
qqline(mysum$resid)
grid()
dev.off()
(myerror <- as.ts(mysum$resid))
bitmap(file='test5.png')
dum <- cbind(lag(myerror,k=1),myerror)
dum
dum1 <- dum[2:length(myerror),]
dum1
z <- as.data.frame(dum1)
z
plot(z,main=paste('Residual Lag plot, lowess, and regression line'), ylab='values of Residuals', xlab='lagged values of Residuals')
lines(lowess(z))
abline(lm(z))
grid()
dev.off()
bitmap(file='test6.png')
acf(mysum$resid, lag.max=length(mysum$resid)/2, main='Residual Autocorrelation Function')
grid()
dev.off()
bitmap(file='test7.png')
pacf(mysum$resid, lag.max=length(mysum$resid)/2, main='Residual Partial Autocorrelation Function')
grid()
dev.off()
bitmap(file='test8.png')
opar <- par(mfrow = c(2,2), oma = c(0, 0, 1.1, 0))
plot(mylm, las = 1, sub='Residual Diagnostics')
par(opar)
dev.off()
if (n > n25) {
bitmap(file='test9.png')
plot(kp3:nmkm3,gqarr[,2], main='Goldfeld-Quandt test',ylab='2-sided p-value',xlab='breakpoint')
grid()
dev.off()
}
load(file='createtable')
a<-table.start()
a<-table.row.start(a)
a<-table.element(a, 'Multiple Linear Regression - Estimated Regression Equation', 1, TRUE)
a<-table.row.end(a)
myeq <- colnames(x)[1]
myeq <- paste(myeq, '[t] = ', sep='')
for (i in 1:k){
if (mysum$coefficients[i,1] > 0) myeq <- paste(myeq, '+', '')
myeq <- paste(myeq, mysum$coefficients[i,1], sep=' ')
if (rownames(mysum$coefficients)[i] != '(Intercept)') {
myeq <- paste(myeq, rownames(mysum$coefficients)[i], sep='')
if (rownames(mysum$coefficients)[i] != 't') myeq <- paste(myeq, '[t]', sep='')
}
}
myeq <- paste(myeq, ' + e[t]')
a<-table.row.start(a)
a<-table.element(a, myeq)
a<-table.row.end(a)
a<-table.end(a)
table.save(a,file='mytable1.tab')
a<-table.start()
a<-table.row.start(a)
a<-table.element(a,hyperlink('ols1.htm','Multiple Linear Regression - Ordinary Least Squares',''), 6, TRUE)
a<-table.row.end(a)
a<-table.row.start(a)
a<-table.element(a,'Variable',header=TRUE)
a<-table.element(a,'Parameter',header=TRUE)
a<-table.element(a,'S.D.',header=TRUE)
a<-table.element(a,'T-STAT
H0: parameter = 0',header=TRUE)
a<-table.element(a,'2-tail p-value',header=TRUE)
a<-table.element(a,'1-tail p-value',header=TRUE)
a<-table.row.end(a)
for (i in 1:k){
a<-table.row.start(a)
a<-table.element(a,rownames(mysum$coefficients)[i],header=TRUE)
a<-table.element(a,mysum$coefficients[i,1])
a<-table.element(a, round(mysum$coefficients[i,2],6))
a<-table.element(a, round(mysum$coefficients[i,3],4))
a<-table.element(a, round(mysum$coefficients[i,4],6))
a<-table.element(a, round(mysum$coefficients[i,4]/2,6))
a<-table.row.end(a)
}
a<-table.end(a)
table.save(a,file='mytable2.tab')
a<-table.start()
a<-table.row.start(a)
a<-table.element(a, 'Multiple Linear Regression - Regression Statistics', 2, TRUE)
a<-table.row.end(a)
a<-table.row.start(a)
a<-table.element(a, 'Multiple R',1,TRUE)
a<-table.element(a, sqrt(mysum$r.squared))
a<-table.row.end(a)
a<-table.row.start(a)
a<-table.element(a, 'R-squared',1,TRUE)
a<-table.element(a, mysum$r.squared)
a<-table.row.end(a)
a<-table.row.start(a)
a<-table.element(a, 'Adjusted R-squared',1,TRUE)
a<-table.element(a, mysum$adj.r.squared)
a<-table.row.end(a)
a<-table.row.start(a)
a<-table.element(a, 'F-TEST (value)',1,TRUE)
a<-table.element(a, mysum$fstatistic[1])
a<-table.row.end(a)
a<-table.row.start(a)
a<-table.element(a, 'F-TEST (DF numerator)',1,TRUE)
a<-table.element(a, mysum$fstatistic[2])
a<-table.row.end(a)
a<-table.row.start(a)
a<-table.element(a, 'F-TEST (DF denominator)',1,TRUE)
a<-table.element(a, mysum$fstatistic[3])
a<-table.row.end(a)
a<-table.row.start(a)
a<-table.element(a, 'p-value',1,TRUE)
a<-table.element(a, 1-pf(mysum$fstatistic[1],mysum$fstatistic[2],mysum$fstatistic[3]))
a<-table.row.end(a)
a<-table.row.start(a)
a<-table.element(a, 'Multiple Linear Regression - Residual Statistics', 2, TRUE)
a<-table.row.end(a)
a<-table.row.start(a)
a<-table.element(a, 'Residual Standard Deviation',1,TRUE)
a<-table.element(a, mysum$sigma)
a<-table.row.end(a)
a<-table.row.start(a)
a<-table.element(a, 'Sum Squared Residuals',1,TRUE)
a<-table.element(a, sum(myerror*myerror))
a<-table.row.end(a)
a<-table.end(a)
table.save(a,file='mytable3.tab')
a<-table.start()
a<-table.row.start(a)
a<-table.element(a, 'Multiple Linear Regression - Actuals, Interpolation, and Residuals', 4, TRUE)
a<-table.row.end(a)
a<-table.row.start(a)
a<-table.element(a, 'Time or Index', 1, TRUE)
a<-table.element(a, 'Actuals', 1, TRUE)
a<-table.element(a, 'Interpolation
Forecast', 1, TRUE)
a<-table.element(a, 'Residuals
Prediction Error', 1, TRUE)
a<-table.row.end(a)
for (i in 1:n) {
a<-table.row.start(a)
a<-table.element(a,i, 1, TRUE)
a<-table.element(a,x[i])
a<-table.element(a,x[i]-mysum$resid[i])
a<-table.element(a,mysum$resid[i])
a<-table.row.end(a)
}
a<-table.end(a)
table.save(a,file='mytable4.tab')
if (n > n25) {
a<-table.start()
a<-table.row.start(a)
a<-table.element(a,'Goldfeld-Quandt test for Heteroskedasticity',4,TRUE)
a<-table.row.end(a)
a<-table.row.start(a)
a<-table.element(a,'p-values',header=TRUE)
a<-table.element(a,'Alternative Hypothesis',3,header=TRUE)
a<-table.row.end(a)
a<-table.row.start(a)
a<-table.element(a,'breakpoint index',header=TRUE)
a<-table.element(a,'greater',header=TRUE)
a<-table.element(a,'2-sided',header=TRUE)
a<-table.element(a,'less',header=TRUE)
a<-table.row.end(a)
for (mypoint in kp3:nmkm3) {
a<-table.row.start(a)
a<-table.element(a,mypoint,header=TRUE)
a<-table.element(a,gqarr[mypoint-kp3+1,1])
a<-table.element(a,gqarr[mypoint-kp3+1,2])
a<-table.element(a,gqarr[mypoint-kp3+1,3])
a<-table.row.end(a)
}
a<-table.end(a)
table.save(a,file='mytable5.tab')
a<-table.start()
a<-table.row.start(a)
a<-table.element(a,'Meta Analysis of Goldfeld-Quandt test for Heteroskedasticity',4,TRUE)
a<-table.row.end(a)
a<-table.row.start(a)
a<-table.element(a,'Description',header=TRUE)
a<-table.element(a,'# significant tests',header=TRUE)
a<-table.element(a,'% significant tests',header=TRUE)
a<-table.element(a,'OK/NOK',header=TRUE)
a<-table.row.end(a)
a<-table.row.start(a)
a<-table.element(a,'1% type I error level',header=TRUE)
a<-table.element(a,numsignificant1)
a<-table.element(a,numsignificant1/numgqtests)
if (numsignificant1/numgqtests < 0.01) dum <- 'OK' else dum <- 'NOK'
a<-table.element(a,dum)
a<-table.row.end(a)
a<-table.row.start(a)
a<-table.element(a,'5% type I error level',header=TRUE)
a<-table.element(a,numsignificant5)
a<-table.element(a,numsignificant5/numgqtests)
if (numsignificant5/numgqtests < 0.05) dum <- 'OK' else dum <- 'NOK'
a<-table.element(a,dum)
a<-table.row.end(a)
a<-table.row.start(a)
a<-table.element(a,'10% type I error level',header=TRUE)
a<-table.element(a,numsignificant10)
a<-table.element(a,numsignificant10/numgqtests)
if (numsignificant10/numgqtests < 0.1) dum <- 'OK' else dum <- 'NOK'
a<-table.element(a,dum)
a<-table.row.end(a)
a<-table.end(a)
table.save(a,file='mytable6.tab')
}