Free Statistics

of Irreproducible Research!

Author's title

Author*The author of this computation has been verified*
R Software Modulerwasp_multipleregression.wasp
Title produced by softwareMultiple Regression
Date of computationThu, 19 Nov 2009 13:47:35 -0700
Cite this page as followsStatistical Computations at FreeStatistics.org, Office for Research Development and Education, URL https://freestatistics.org/blog/index.php?v=date/2009/Nov/19/t1258663721n00kwiceoelxh7s.htm/, Retrieved Sat, 27 Apr 2024 01:55:37 +0000
Statistical Computations at FreeStatistics.org, Office for Research Development and Education, URL https://freestatistics.org/blog/index.php?pk=57948, Retrieved Sat, 27 Apr 2024 01:55:37 +0000
QR Codes:

Original text written by user:
IsPrivate?No (this computation is public)
User-defined keywords
Estimated Impact171
Family? (F = Feedback message, R = changed R code, M = changed R Module, P = changed Parameters, D = changed Data)
-     [Multiple Regression] [Q1 The Seatbeltlaw] [2007-11-14 19:27:43] [8cd6641b921d30ebe00b648d1481bba0]
- RM D  [Multiple Regression] [Seatbelt] [2009-11-12 14:10:54] [b98453cac15ba1066b407e146608df68]
F R PD    [Multiple Regression] [Model 1] [2009-11-19 20:32:12] [c0117c881d5fcd069841276db0c34efe]
F    D      [Multiple Regression] [Model 2] [2009-11-19 20:38:54] [c0117c881d5fcd069841276db0c34efe]
-             [Multiple Regression] [Model 3] [2009-11-19 20:41:09] [c0117c881d5fcd069841276db0c34efe]
-    D            [Multiple Regression] [Model 4] [2009-11-19 20:47:35] [d5837f25ec8937f9733a894c487f865c] [Current]
-   PD              [Multiple Regression] [Model 5] [2009-11-20 15:42:18] [c0117c881d5fcd069841276db0c34efe]
Feedback Forum

Post a new message
Dataseries X:
3.75	99.9	100.1	100.7	101.1	101.2
4.11	99.7	99.9	100.1	100.7	101.1
4.25	99.5	99.7	99.9	100.1	100.7
4.25	99.2	99.5	99.7	99.9	100.1
4.5	99	99.2	99.5	99.7	99.9
4.7	99	99	99.2	99.5	99.7
4.75	99.3	99	99	99.2	99.5
4.75	99.5	99.3	99	99	99.2
4.75	99.7	99.5	99.3	99	99
4.75	100	99.7	99.5	99.3	99
4.75	100.4	100	99.7	99.5	99.3
4.75	100.6	100.4	100	99.7	99.5
4.58	100.7	100.6	100.4	100	99.7
4.5	100.7	100.7	100.6	100.4	100
4.5	100.6	100.7	100.7	100.6	100.4
4.49	100.5	100.6	100.7	100.7	100.6
4.03	100.6	100.5	100.6	100.7	100.7
3.75	100.5	100.6	100.5	100.6	100.7
3.39	100.4	100.5	100.6	100.5	100.6
3.25	100.3	100.4	100.5	100.6	100.5
3.25	100.4	100.3	100.4	100.5	100.6
3.25	100.4	100.4	100.3	100.4	100.5
3.25	100.4	100.4	100.4	100.3	100.4
3.25	100.4	100.4	100.4	100.4	100.3
3.25	100.4	100.4	100.4	100.4	100.4
3.25	100.5	100.4	100.4	100.4	100.4
3.25	100.6	100.5	100.4	100.4	100.4
3.25	100.6	100.6	100.5	100.4	100.4
3.25	100.5	100.6	100.6	100.5	100.4
3.25	100.5	100.5	100.6	100.6	100.5
3.25	100.7	100.5	100.5	100.6	100.6
2.85	101.1	100.7	100.5	100.5	100.6
2.75	101.5	101.1	100.7	100.5	100.5
2.75	101.9	101.5	101.1	100.7	100.5
2.55	102.1	101.9	101.5	101.1	100.7
2.5	102.1	102.1	101.9	101.5	101.1
2.5	102.1	102.1	102.1	101.9	101.5
2.1	102.4	102.1	102.1	102.1	101.9
2	102.8	102.4	102.1	102.1	102.1
2	103.1	102.8	102.4	102.1	102.1
2	103.1	103.1	102.8	102.4	102.1
2	102.9	103.1	103.1	102.8	102.4
2	102.4	102.9	103.1	103.1	102.8
2	101.9	102.4	102.9	103.1	103.1
2	101.3	101.9	102.4	102.9	103.1
2	100.7	101.3	101.9	102.4	102.9
2	100.6	100.7	101.3	101.9	102.4
2	101	100.6	100.7	101.3	101.9
2	101.5	101	100.6	100.7	101.3
2	101.9	101.5	101	100.6	100.7
2	102.1	101.9	101.5	101	100.6
2	102.3	102.1	101.9	101.5	101
2	102.5	102.3	102.1	101.9	101.5
2	102.9	102.5	102.3	102.1	101.9
2	103.6	102.9	102.5	102.3	102.1
2	104.3	103.6	102.9	102.5	102.3


Summary of computational transaction
Raw Inputview raw input (R code)
Raw Outputview raw output of R engine
Computing time3 seconds
R Server'Gwilym Jenkins' @ 72.249.127.135

\begin{tabular}{lllllllll}
\hline
Summary of computational transaction \tabularnewline
Raw Input & view raw input (R code)  \tabularnewline
Raw Output & view raw output of R engine  \tabularnewline
Computing time & 3 seconds \tabularnewline
R Server & 'Gwilym Jenkins' @ 72.249.127.135 \tabularnewline
\hline
\end{tabular}
%Source: https://freestatistics.org/blog/index.php?pk=57948&T=0

[TABLE]
[ROW][C]Summary of computational transaction[/C][/ROW]
[ROW][C]Raw Input[/C][C]view raw input (R code) [/C][/ROW]
[ROW][C]Raw Output[/C][C]view raw output of R engine [/C][/ROW]
[ROW][C]Computing time[/C][C]3 seconds[/C][/ROW]
[ROW][C]R Server[/C][C]'Gwilym Jenkins' @ 72.249.127.135[/C][/ROW]
[/TABLE]
Source: https://freestatistics.org/blog/index.php?pk=57948&T=0

Globally Unique Identifier (entire table): ba.freestatistics.org/blog/index.php?pk=57948&T=0

As an alternative you can also use a QR Code:  

The GUIDs for individual cells are displayed in the table below:

Summary of computational transaction
Raw Inputview raw input (R code)
Raw Outputview raw output of R engine
Computing time3 seconds
R Server'Gwilym Jenkins' @ 72.249.127.135


Multiple Linear Regression - Estimated Regression Equation
Tprod[t] = + 9.03287437636819 + 0.0100535761591053Rente[t] + 2.06088898976321y1[t] -1.65997795678992y2[t] + 0.66397755103948y3[t] -0.156268465277844y4[t] + 0.00673278043645512t + e[t]

\begin{tabular}{lllllllll}
\hline
Multiple Linear Regression - Estimated Regression Equation \tabularnewline
Tprod[t] =  +  9.03287437636819 +  0.0100535761591053Rente[t] +  2.06088898976321y1[t] -1.65997795678992y2[t] +  0.66397755103948y3[t] -0.156268465277844y4[t] +  0.00673278043645512t  + e[t] \tabularnewline
\hline
\end{tabular}
%Source: https://freestatistics.org/blog/index.php?pk=57948&T=1

[TABLE]
[ROW][C]Multiple Linear Regression - Estimated Regression Equation[/C][/ROW]
[ROW][C]Tprod[t] =  +  9.03287437636819 +  0.0100535761591053Rente[t] +  2.06088898976321y1[t] -1.65997795678992y2[t] +  0.66397755103948y3[t] -0.156268465277844y4[t] +  0.00673278043645512t  + e[t][/C][/ROW]
[/TABLE]
Source: https://freestatistics.org/blog/index.php?pk=57948&T=1

Globally Unique Identifier (entire table): ba.freestatistics.org/blog/index.php?pk=57948&T=1

As an alternative you can also use a QR Code:  

The GUIDs for individual cells are displayed in the table below:

Multiple Linear Regression - Estimated Regression Equation
Tprod[t] = + 9.03287437636819 + 0.0100535761591053Rente[t] + 2.06088898976321y1[t] -1.65997795678992y2[t] + 0.66397755103948y3[t] -0.156268465277844y4[t] + 0.00673278043645512t + e[t]


Multiple Linear Regression - Ordinary Least Squares
VariableParameterS.D.T-STATH0: parameter = 02-tail p-value1-tail p-value
(Intercept)9.032874376368194.6917741.92530.0600120.030006
Rente0.01005357615910530.0710910.14140.888120.44406
y12.060888989763210.1416214.552300
y2-1.659977956789920.316673-5.24193e-062e-06
y30.663977551039480.3229992.05570.0451640.022582
y4-0.1562684652778440.152604-1.0240.3108580.155429
t0.006732780436455120.0039761.69350.0967150.048358

\begin{tabular}{lllllllll}
\hline
Multiple Linear Regression - Ordinary Least Squares \tabularnewline
Variable & Parameter & S.D. & T-STATH0: parameter = 0 & 2-tail p-value & 1-tail p-value \tabularnewline
(Intercept) & 9.03287437636819 & 4.691774 & 1.9253 & 0.060012 & 0.030006 \tabularnewline
Rente & 0.0100535761591053 & 0.071091 & 0.1414 & 0.88812 & 0.44406 \tabularnewline
y1 & 2.06088898976321 & 0.14162 & 14.5523 & 0 & 0 \tabularnewline
y2 & -1.65997795678992 & 0.316673 & -5.2419 & 3e-06 & 2e-06 \tabularnewline
y3 & 0.66397755103948 & 0.322999 & 2.0557 & 0.045164 & 0.022582 \tabularnewline
y4 & -0.156268465277844 & 0.152604 & -1.024 & 0.310858 & 0.155429 \tabularnewline
t & 0.00673278043645512 & 0.003976 & 1.6935 & 0.096715 & 0.048358 \tabularnewline
\hline
\end{tabular}
%Source: https://freestatistics.org/blog/index.php?pk=57948&T=2

[TABLE]
[ROW][C]Multiple Linear Regression - Ordinary Least Squares[/C][/ROW]
[ROW][C]Variable[/C][C]Parameter[/C][C]S.D.[/C][C]T-STATH0: parameter = 0[/C][C]2-tail p-value[/C][C]1-tail p-value[/C][/ROW]
[ROW][C](Intercept)[/C][C]9.03287437636819[/C][C]4.691774[/C][C]1.9253[/C][C]0.060012[/C][C]0.030006[/C][/ROW]
[ROW][C]Rente[/C][C]0.0100535761591053[/C][C]0.071091[/C][C]0.1414[/C][C]0.88812[/C][C]0.44406[/C][/ROW]
[ROW][C]y1[/C][C]2.06088898976321[/C][C]0.14162[/C][C]14.5523[/C][C]0[/C][C]0[/C][/ROW]
[ROW][C]y2[/C][C]-1.65997795678992[/C][C]0.316673[/C][C]-5.2419[/C][C]3e-06[/C][C]2e-06[/C][/ROW]
[ROW][C]y3[/C][C]0.66397755103948[/C][C]0.322999[/C][C]2.0557[/C][C]0.045164[/C][C]0.022582[/C][/ROW]
[ROW][C]y4[/C][C]-0.156268465277844[/C][C]0.152604[/C][C]-1.024[/C][C]0.310858[/C][C]0.155429[/C][/ROW]
[ROW][C]t[/C][C]0.00673278043645512[/C][C]0.003976[/C][C]1.6935[/C][C]0.096715[/C][C]0.048358[/C][/ROW]
[/TABLE]
Source: https://freestatistics.org/blog/index.php?pk=57948&T=2

Globally Unique Identifier (entire table): ba.freestatistics.org/blog/index.php?pk=57948&T=2

As an alternative you can also use a QR Code:  

The GUIDs for individual cells are displayed in the table below:

Multiple Linear Regression - Ordinary Least Squares
VariableParameterS.D.T-STATH0: parameter = 02-tail p-value1-tail p-value
(Intercept)9.032874376368194.6917741.92530.0600120.030006
Rente0.01005357615910530.0710910.14140.888120.44406
y12.060888989763210.1416214.552300
y2-1.659977956789920.316673-5.24193e-062e-06
y30.663977551039480.3229992.05570.0451640.022582
y4-0.1562684652778440.152604-1.0240.3108580.155429
t0.006732780436455120.0039761.69350.0967150.048358


Multiple Linear Regression - Regression Statistics
Multiple R0.993522928795038
R-squared0.98708781004147
Adjusted R-squared0.985506725556751
F-TEST (value)624.310604260666
F-TEST (DF numerator)6
F-TEST (DF denominator)49
p-value0
Multiple Linear Regression - Residual Statistics
Residual Standard Deviation0.147201856015383
Sum Squared Residuals1.06175093430430

\begin{tabular}{lllllllll}
\hline
Multiple Linear Regression - Regression Statistics \tabularnewline
Multiple R & 0.993522928795038 \tabularnewline
R-squared & 0.98708781004147 \tabularnewline
Adjusted R-squared & 0.985506725556751 \tabularnewline
F-TEST (value) & 624.310604260666 \tabularnewline
F-TEST (DF numerator) & 6 \tabularnewline
F-TEST (DF denominator) & 49 \tabularnewline
p-value & 0 \tabularnewline
Multiple Linear Regression - Residual Statistics \tabularnewline
Residual Standard Deviation & 0.147201856015383 \tabularnewline
Sum Squared Residuals & 1.06175093430430 \tabularnewline
\hline
\end{tabular}
%Source: https://freestatistics.org/blog/index.php?pk=57948&T=3

[TABLE]
[ROW][C]Multiple Linear Regression - Regression Statistics[/C][/ROW]
[ROW][C]Multiple R[/C][C]0.993522928795038[/C][/ROW]
[ROW][C]R-squared[/C][C]0.98708781004147[/C][/ROW]
[ROW][C]Adjusted R-squared[/C][C]0.985506725556751[/C][/ROW]
[ROW][C]F-TEST (value)[/C][C]624.310604260666[/C][/ROW]
[ROW][C]F-TEST (DF numerator)[/C][C]6[/C][/ROW]
[ROW][C]F-TEST (DF denominator)[/C][C]49[/C][/ROW]
[ROW][C]p-value[/C][C]0[/C][/ROW]
[ROW][C]Multiple Linear Regression - Residual Statistics[/C][/ROW]
[ROW][C]Residual Standard Deviation[/C][C]0.147201856015383[/C][/ROW]
[ROW][C]Sum Squared Residuals[/C][C]1.06175093430430[/C][/ROW]
[/TABLE]
Source: https://freestatistics.org/blog/index.php?pk=57948&T=3

Globally Unique Identifier (entire table): ba.freestatistics.org/blog/index.php?pk=57948&T=3

As an alternative you can also use a QR Code:  

The GUIDs for individual cells are displayed in the table below:

Multiple Linear Regression - Regression Statistics
Multiple R0.993522928795038
R-squared0.98708781004147
Adjusted R-squared0.985506725556751
F-TEST (value)624.310604260666
F-TEST (DF numerator)6
F-TEST (DF denominator)49
p-value0
Multiple Linear Regression - Residual Statistics
Residual Standard Deviation0.147201856015383
Sum Squared Residuals1.06175093430430


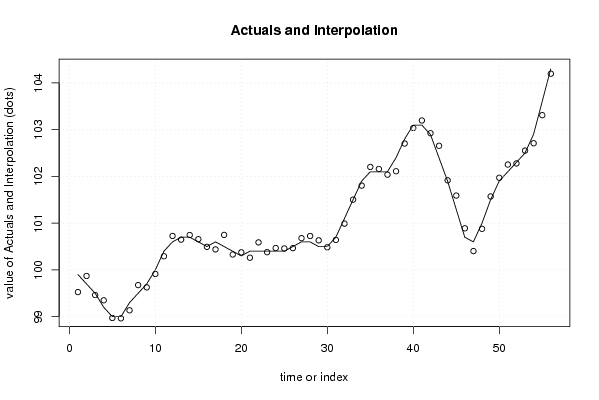
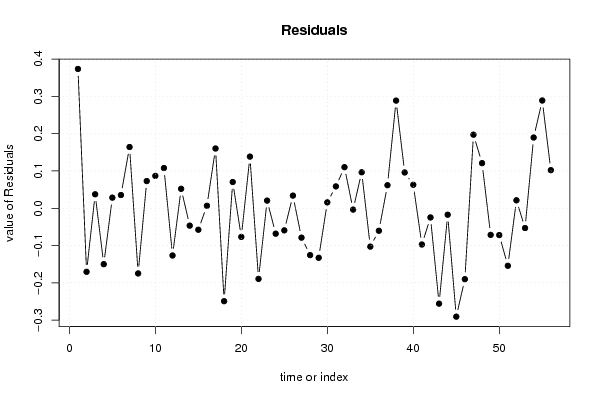
Multiple Linear Regression - Actuals, Interpolation, and Residuals
Time or IndexActualsInterpolationForecastResidualsPrediction Error
199.999.52627741792680.373722582073162
299.799.870474288014-0.170474288013908
399.599.46255321800540.0374467819945941
499.299.350069360806-0.150069360806019
59998.9715026125590.0284973874410457
69998.96451988015920.0354801198407734
799.399.13581135850540.164188641494644
899.599.6748958652462-0.174895865246220
999.799.6270667496540.0729332503460831
1010099.91317500199690.0868249980031247
11100.4100.2920938586290.107906141371163
12100.6100.726730665086-0.126730665085955
13100.7100.6478805250680.052119474931733
14100.7100.746612807863-0.0466128078628094
15100.6100.657635916717-0.0576359167170165
16100.5100.4933233244640.00667667553607671
17100.6100.4397135100420.160286489957892
18100.5100.749320228705-0.249320228705347
19100.4100.3295761184930.0704238815069325
20100.3100.376834896602-0.0768348966016582
21100.4100.2614519721090.138548027890979
22100.4100.589500538625-0.189500538624661
23100.4100.3794646148060.0205353851940609
24100.4100.468221996874-0.0682219968741338
25100.4100.459327930783-0.0593279307828032
26100.5100.4660607112190.0339392887807360
27100.6100.678882390632-0.078882390632034
28100.6100.725706274366-0.125706274365815
29100.5100.632839014227-0.132839014227226
30100.5100.4842538042640.0157461957364671
31100.7100.6413575338510.0586424661488154
32101.1100.9898489266730.110151073327290
33101.5101.503563200568-0.00356320056830893
34101.9101.8034559044020.0965440955980037
35102.1102.202879710156-0.102879710156175
36102.1102.160380061326-0.0603800613259744
37102.1102.0382008847090.0617991152908789
38102.4102.1112003587790.288799641221327
39102.8102.7039407854730.0960592145273543
40103.1103.0370357747770.0629642252226264
41103.1103.197237334739-0.0972373347386817
42102.9102.924687208971-0.0246872089705846
43102.4102.655928070655-0.255928070655128
44101.9101.917331407985-0.0173314079845912
45101.3101.590813161727-0.290813161726524
46100.7100.890266444236-0.190266444235819
47100.6100.4025980620080.197401937992481
48101100.8789764195570.121023580443197
49101.5101.571437140121-0.0714371401205832
50101.9101.971986556785-0.0719865567854098
51102.1102.254303821676-0.154303821675791
52102.3102.2787046067570.0212953932425151
53102.5102.553076381565-0.0530763815654929
54102.9102.7102794926930.189720507306649
55103.6103.3109140948290.289085905170546
56104.3104.1978198025360.102180197463521

\begin{tabular}{lllllllll}
\hline
Multiple Linear Regression - Actuals, Interpolation, and Residuals \tabularnewline
Time or Index & Actuals & InterpolationForecast & ResidualsPrediction Error \tabularnewline
1 & 99.9 & 99.5262774179268 & 0.373722582073162 \tabularnewline
2 & 99.7 & 99.870474288014 & -0.170474288013908 \tabularnewline
3 & 99.5 & 99.4625532180054 & 0.0374467819945941 \tabularnewline
4 & 99.2 & 99.350069360806 & -0.150069360806019 \tabularnewline
5 & 99 & 98.971502612559 & 0.0284973874410457 \tabularnewline
6 & 99 & 98.9645198801592 & 0.0354801198407734 \tabularnewline
7 & 99.3 & 99.1358113585054 & 0.164188641494644 \tabularnewline
8 & 99.5 & 99.6748958652462 & -0.174895865246220 \tabularnewline
9 & 99.7 & 99.627066749654 & 0.0729332503460831 \tabularnewline
10 & 100 & 99.9131750019969 & 0.0868249980031247 \tabularnewline
11 & 100.4 & 100.292093858629 & 0.107906141371163 \tabularnewline
12 & 100.6 & 100.726730665086 & -0.126730665085955 \tabularnewline
13 & 100.7 & 100.647880525068 & 0.052119474931733 \tabularnewline
14 & 100.7 & 100.746612807863 & -0.0466128078628094 \tabularnewline
15 & 100.6 & 100.657635916717 & -0.0576359167170165 \tabularnewline
16 & 100.5 & 100.493323324464 & 0.00667667553607671 \tabularnewline
17 & 100.6 & 100.439713510042 & 0.160286489957892 \tabularnewline
18 & 100.5 & 100.749320228705 & -0.249320228705347 \tabularnewline
19 & 100.4 & 100.329576118493 & 0.0704238815069325 \tabularnewline
20 & 100.3 & 100.376834896602 & -0.0768348966016582 \tabularnewline
21 & 100.4 & 100.261451972109 & 0.138548027890979 \tabularnewline
22 & 100.4 & 100.589500538625 & -0.189500538624661 \tabularnewline
23 & 100.4 & 100.379464614806 & 0.0205353851940609 \tabularnewline
24 & 100.4 & 100.468221996874 & -0.0682219968741338 \tabularnewline
25 & 100.4 & 100.459327930783 & -0.0593279307828032 \tabularnewline
26 & 100.5 & 100.466060711219 & 0.0339392887807360 \tabularnewline
27 & 100.6 & 100.678882390632 & -0.078882390632034 \tabularnewline
28 & 100.6 & 100.725706274366 & -0.125706274365815 \tabularnewline
29 & 100.5 & 100.632839014227 & -0.132839014227226 \tabularnewline
30 & 100.5 & 100.484253804264 & 0.0157461957364671 \tabularnewline
31 & 100.7 & 100.641357533851 & 0.0586424661488154 \tabularnewline
32 & 101.1 & 100.989848926673 & 0.110151073327290 \tabularnewline
33 & 101.5 & 101.503563200568 & -0.00356320056830893 \tabularnewline
34 & 101.9 & 101.803455904402 & 0.0965440955980037 \tabularnewline
35 & 102.1 & 102.202879710156 & -0.102879710156175 \tabularnewline
36 & 102.1 & 102.160380061326 & -0.0603800613259744 \tabularnewline
37 & 102.1 & 102.038200884709 & 0.0617991152908789 \tabularnewline
38 & 102.4 & 102.111200358779 & 0.288799641221327 \tabularnewline
39 & 102.8 & 102.703940785473 & 0.0960592145273543 \tabularnewline
40 & 103.1 & 103.037035774777 & 0.0629642252226264 \tabularnewline
41 & 103.1 & 103.197237334739 & -0.0972373347386817 \tabularnewline
42 & 102.9 & 102.924687208971 & -0.0246872089705846 \tabularnewline
43 & 102.4 & 102.655928070655 & -0.255928070655128 \tabularnewline
44 & 101.9 & 101.917331407985 & -0.0173314079845912 \tabularnewline
45 & 101.3 & 101.590813161727 & -0.290813161726524 \tabularnewline
46 & 100.7 & 100.890266444236 & -0.190266444235819 \tabularnewline
47 & 100.6 & 100.402598062008 & 0.197401937992481 \tabularnewline
48 & 101 & 100.878976419557 & 0.121023580443197 \tabularnewline
49 & 101.5 & 101.571437140121 & -0.0714371401205832 \tabularnewline
50 & 101.9 & 101.971986556785 & -0.0719865567854098 \tabularnewline
51 & 102.1 & 102.254303821676 & -0.154303821675791 \tabularnewline
52 & 102.3 & 102.278704606757 & 0.0212953932425151 \tabularnewline
53 & 102.5 & 102.553076381565 & -0.0530763815654929 \tabularnewline
54 & 102.9 & 102.710279492693 & 0.189720507306649 \tabularnewline
55 & 103.6 & 103.310914094829 & 0.289085905170546 \tabularnewline
56 & 104.3 & 104.197819802536 & 0.102180197463521 \tabularnewline
\hline
\end{tabular}
%Source: https://freestatistics.org/blog/index.php?pk=57948&T=4

[TABLE]
[ROW][C]Multiple Linear Regression - Actuals, Interpolation, and Residuals[/C][/ROW]
[ROW][C]Time or Index[/C][C]Actuals[/C][C]InterpolationForecast[/C][C]ResidualsPrediction Error[/C][/ROW]
[ROW][C]1[/C][C]99.9[/C][C]99.5262774179268[/C][C]0.373722582073162[/C][/ROW]
[ROW][C]2[/C][C]99.7[/C][C]99.870474288014[/C][C]-0.170474288013908[/C][/ROW]
[ROW][C]3[/C][C]99.5[/C][C]99.4625532180054[/C][C]0.0374467819945941[/C][/ROW]
[ROW][C]4[/C][C]99.2[/C][C]99.350069360806[/C][C]-0.150069360806019[/C][/ROW]
[ROW][C]5[/C][C]99[/C][C]98.971502612559[/C][C]0.0284973874410457[/C][/ROW]
[ROW][C]6[/C][C]99[/C][C]98.9645198801592[/C][C]0.0354801198407734[/C][/ROW]
[ROW][C]7[/C][C]99.3[/C][C]99.1358113585054[/C][C]0.164188641494644[/C][/ROW]
[ROW][C]8[/C][C]99.5[/C][C]99.6748958652462[/C][C]-0.174895865246220[/C][/ROW]
[ROW][C]9[/C][C]99.7[/C][C]99.627066749654[/C][C]0.0729332503460831[/C][/ROW]
[ROW][C]10[/C][C]100[/C][C]99.9131750019969[/C][C]0.0868249980031247[/C][/ROW]
[ROW][C]11[/C][C]100.4[/C][C]100.292093858629[/C][C]0.107906141371163[/C][/ROW]
[ROW][C]12[/C][C]100.6[/C][C]100.726730665086[/C][C]-0.126730665085955[/C][/ROW]
[ROW][C]13[/C][C]100.7[/C][C]100.647880525068[/C][C]0.052119474931733[/C][/ROW]
[ROW][C]14[/C][C]100.7[/C][C]100.746612807863[/C][C]-0.0466128078628094[/C][/ROW]
[ROW][C]15[/C][C]100.6[/C][C]100.657635916717[/C][C]-0.0576359167170165[/C][/ROW]
[ROW][C]16[/C][C]100.5[/C][C]100.493323324464[/C][C]0.00667667553607671[/C][/ROW]
[ROW][C]17[/C][C]100.6[/C][C]100.439713510042[/C][C]0.160286489957892[/C][/ROW]
[ROW][C]18[/C][C]100.5[/C][C]100.749320228705[/C][C]-0.249320228705347[/C][/ROW]
[ROW][C]19[/C][C]100.4[/C][C]100.329576118493[/C][C]0.0704238815069325[/C][/ROW]
[ROW][C]20[/C][C]100.3[/C][C]100.376834896602[/C][C]-0.0768348966016582[/C][/ROW]
[ROW][C]21[/C][C]100.4[/C][C]100.261451972109[/C][C]0.138548027890979[/C][/ROW]
[ROW][C]22[/C][C]100.4[/C][C]100.589500538625[/C][C]-0.189500538624661[/C][/ROW]
[ROW][C]23[/C][C]100.4[/C][C]100.379464614806[/C][C]0.0205353851940609[/C][/ROW]
[ROW][C]24[/C][C]100.4[/C][C]100.468221996874[/C][C]-0.0682219968741338[/C][/ROW]
[ROW][C]25[/C][C]100.4[/C][C]100.459327930783[/C][C]-0.0593279307828032[/C][/ROW]
[ROW][C]26[/C][C]100.5[/C][C]100.466060711219[/C][C]0.0339392887807360[/C][/ROW]
[ROW][C]27[/C][C]100.6[/C][C]100.678882390632[/C][C]-0.078882390632034[/C][/ROW]
[ROW][C]28[/C][C]100.6[/C][C]100.725706274366[/C][C]-0.125706274365815[/C][/ROW]
[ROW][C]29[/C][C]100.5[/C][C]100.632839014227[/C][C]-0.132839014227226[/C][/ROW]
[ROW][C]30[/C][C]100.5[/C][C]100.484253804264[/C][C]0.0157461957364671[/C][/ROW]
[ROW][C]31[/C][C]100.7[/C][C]100.641357533851[/C][C]0.0586424661488154[/C][/ROW]
[ROW][C]32[/C][C]101.1[/C][C]100.989848926673[/C][C]0.110151073327290[/C][/ROW]
[ROW][C]33[/C][C]101.5[/C][C]101.503563200568[/C][C]-0.00356320056830893[/C][/ROW]
[ROW][C]34[/C][C]101.9[/C][C]101.803455904402[/C][C]0.0965440955980037[/C][/ROW]
[ROW][C]35[/C][C]102.1[/C][C]102.202879710156[/C][C]-0.102879710156175[/C][/ROW]
[ROW][C]36[/C][C]102.1[/C][C]102.160380061326[/C][C]-0.0603800613259744[/C][/ROW]
[ROW][C]37[/C][C]102.1[/C][C]102.038200884709[/C][C]0.0617991152908789[/C][/ROW]
[ROW][C]38[/C][C]102.4[/C][C]102.111200358779[/C][C]0.288799641221327[/C][/ROW]
[ROW][C]39[/C][C]102.8[/C][C]102.703940785473[/C][C]0.0960592145273543[/C][/ROW]
[ROW][C]40[/C][C]103.1[/C][C]103.037035774777[/C][C]0.0629642252226264[/C][/ROW]
[ROW][C]41[/C][C]103.1[/C][C]103.197237334739[/C][C]-0.0972373347386817[/C][/ROW]
[ROW][C]42[/C][C]102.9[/C][C]102.924687208971[/C][C]-0.0246872089705846[/C][/ROW]
[ROW][C]43[/C][C]102.4[/C][C]102.655928070655[/C][C]-0.255928070655128[/C][/ROW]
[ROW][C]44[/C][C]101.9[/C][C]101.917331407985[/C][C]-0.0173314079845912[/C][/ROW]
[ROW][C]45[/C][C]101.3[/C][C]101.590813161727[/C][C]-0.290813161726524[/C][/ROW]
[ROW][C]46[/C][C]100.7[/C][C]100.890266444236[/C][C]-0.190266444235819[/C][/ROW]
[ROW][C]47[/C][C]100.6[/C][C]100.402598062008[/C][C]0.197401937992481[/C][/ROW]
[ROW][C]48[/C][C]101[/C][C]100.878976419557[/C][C]0.121023580443197[/C][/ROW]
[ROW][C]49[/C][C]101.5[/C][C]101.571437140121[/C][C]-0.0714371401205832[/C][/ROW]
[ROW][C]50[/C][C]101.9[/C][C]101.971986556785[/C][C]-0.0719865567854098[/C][/ROW]
[ROW][C]51[/C][C]102.1[/C][C]102.254303821676[/C][C]-0.154303821675791[/C][/ROW]
[ROW][C]52[/C][C]102.3[/C][C]102.278704606757[/C][C]0.0212953932425151[/C][/ROW]
[ROW][C]53[/C][C]102.5[/C][C]102.553076381565[/C][C]-0.0530763815654929[/C][/ROW]
[ROW][C]54[/C][C]102.9[/C][C]102.710279492693[/C][C]0.189720507306649[/C][/ROW]
[ROW][C]55[/C][C]103.6[/C][C]103.310914094829[/C][C]0.289085905170546[/C][/ROW]
[ROW][C]56[/C][C]104.3[/C][C]104.197819802536[/C][C]0.102180197463521[/C][/ROW]
[/TABLE]
Source: https://freestatistics.org/blog/index.php?pk=57948&T=4

Globally Unique Identifier (entire table): ba.freestatistics.org/blog/index.php?pk=57948&T=4

As an alternative you can also use a QR Code:  

The GUIDs for individual cells are displayed in the table below:

Multiple Linear Regression - Actuals, Interpolation, and Residuals
Time or IndexActualsInterpolationForecastResidualsPrediction Error
199.999.52627741792680.373722582073162
299.799.870474288014-0.170474288013908
399.599.46255321800540.0374467819945941
499.299.350069360806-0.150069360806019
59998.9715026125590.0284973874410457
69998.96451988015920.0354801198407734
799.399.13581135850540.164188641494644
899.599.6748958652462-0.174895865246220
999.799.6270667496540.0729332503460831
1010099.91317500199690.0868249980031247
11100.4100.2920938586290.107906141371163
12100.6100.726730665086-0.126730665085955
13100.7100.6478805250680.052119474931733
14100.7100.746612807863-0.0466128078628094
15100.6100.657635916717-0.0576359167170165
16100.5100.4933233244640.00667667553607671
17100.6100.4397135100420.160286489957892
18100.5100.749320228705-0.249320228705347
19100.4100.3295761184930.0704238815069325
20100.3100.376834896602-0.0768348966016582
21100.4100.2614519721090.138548027890979
22100.4100.589500538625-0.189500538624661
23100.4100.3794646148060.0205353851940609
24100.4100.468221996874-0.0682219968741338
25100.4100.459327930783-0.0593279307828032
26100.5100.4660607112190.0339392887807360
27100.6100.678882390632-0.078882390632034
28100.6100.725706274366-0.125706274365815
29100.5100.632839014227-0.132839014227226
30100.5100.4842538042640.0157461957364671
31100.7100.6413575338510.0586424661488154
32101.1100.9898489266730.110151073327290
33101.5101.503563200568-0.00356320056830893
34101.9101.8034559044020.0965440955980037
35102.1102.202879710156-0.102879710156175
36102.1102.160380061326-0.0603800613259744
37102.1102.0382008847090.0617991152908789
38102.4102.1112003587790.288799641221327
39102.8102.7039407854730.0960592145273543
40103.1103.0370357747770.0629642252226264
41103.1103.197237334739-0.0972373347386817
42102.9102.924687208971-0.0246872089705846
43102.4102.655928070655-0.255928070655128
44101.9101.917331407985-0.0173314079845912
45101.3101.590813161727-0.290813161726524
46100.7100.890266444236-0.190266444235819
47100.6100.4025980620080.197401937992481
48101100.8789764195570.121023580443197
49101.5101.571437140121-0.0714371401205832
50101.9101.971986556785-0.0719865567854098
51102.1102.254303821676-0.154303821675791
52102.3102.2787046067570.0212953932425151
53102.5102.553076381565-0.0530763815654929
54102.9102.7102794926930.189720507306649
55103.6103.3109140948290.289085905170546
56104.3104.1978198025360.102180197463521


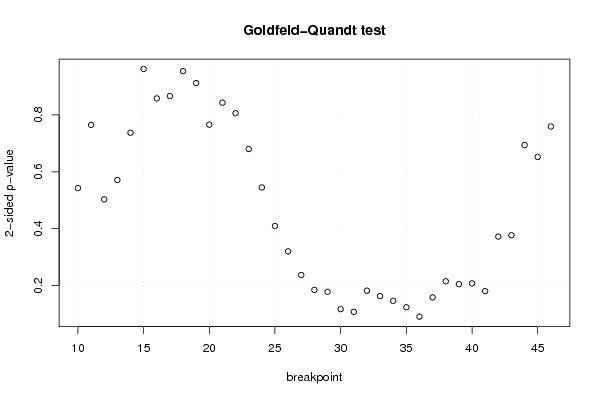
Goldfeld-Quandt test for Heteroskedasticity
p-valuesAlternative Hypothesis
breakpoint indexgreater2-sidedless
100.2711815336436450.5423630672872900.728818466356355
110.6174843237978220.7650313524043570.382515676202178
120.7486823178582860.5026353642834270.251317682141714
130.7144464079983960.5711071840032080.285553592001604
140.631286780583390.737426438833220.36871321941661
150.5189636285516460.9620727428967090.481036371448354
160.4291131477009080.8582262954018160.570886852299092
170.4333093024559320.8666186049118640.566690697544068
180.522746499305620.954507001388760.47725350069438
190.4562137938487020.9124275876974030.543786206151298
200.3829045945044870.7658091890089730.617095405495513
210.4216549318825040.8433098637650080.578345068117496
220.4030516160338670.8061032320677330.596948383966133
230.3400626731223510.6801253462447030.659937326877649
240.2723737713394630.5447475426789250.727626228660537
250.2044730000461420.4089460000922840.795526999953858
260.1597905122330350.319581024466070.840209487766965
270.1181189369853780.2362378739707560.881881063014622
280.09192104141024720.1838420828204940.908078958589753
290.08865291711931030.1773058342386210.91134708288069
300.05803414334750050.1160682866950010.9419658566525
310.05334902583226420.1066980516645280.946650974167736
320.0905494389204890.1810988778409780.909450561079511
330.08101785216353310.1620357043270660.918982147836467
340.07274190758842240.1454838151768450.927258092411578
350.06133666798569530.1226733359713910.938663332014305
360.04482285840338160.0896457168067630.955177141596618
370.07870222074669550.1574044414933910.921297779253305
380.1071117285954880.2142234571909750.892888271404512
390.1019662130591020.2039324261182050.898033786940898
400.1034201047049990.2068402094099980.896579895295001
410.08975361642164210.1795072328432840.910246383578358
420.1858234576384710.3716469152769420.814176542361529
430.1881334624616840.3762669249233680.811866537538316
440.6530248176805850.6939503646388300.346975182319415
450.6738938618646320.6522122762707360.326106138135368
460.6202913294030540.7594173411938920.379708670596946

\begin{tabular}{lllllllll}
\hline
Goldfeld-Quandt test for Heteroskedasticity \tabularnewline
p-values & Alternative Hypothesis \tabularnewline
breakpoint index & greater & 2-sided & less \tabularnewline
10 & 0.271181533643645 & 0.542363067287290 & 0.728818466356355 \tabularnewline
11 & 0.617484323797822 & 0.765031352404357 & 0.382515676202178 \tabularnewline
12 & 0.748682317858286 & 0.502635364283427 & 0.251317682141714 \tabularnewline
13 & 0.714446407998396 & 0.571107184003208 & 0.285553592001604 \tabularnewline
14 & 0.63128678058339 & 0.73742643883322 & 0.36871321941661 \tabularnewline
15 & 0.518963628551646 & 0.962072742896709 & 0.481036371448354 \tabularnewline
16 & 0.429113147700908 & 0.858226295401816 & 0.570886852299092 \tabularnewline
17 & 0.433309302455932 & 0.866618604911864 & 0.566690697544068 \tabularnewline
18 & 0.52274649930562 & 0.95450700138876 & 0.47725350069438 \tabularnewline
19 & 0.456213793848702 & 0.912427587697403 & 0.543786206151298 \tabularnewline
20 & 0.382904594504487 & 0.765809189008973 & 0.617095405495513 \tabularnewline
21 & 0.421654931882504 & 0.843309863765008 & 0.578345068117496 \tabularnewline
22 & 0.403051616033867 & 0.806103232067733 & 0.596948383966133 \tabularnewline
23 & 0.340062673122351 & 0.680125346244703 & 0.659937326877649 \tabularnewline
24 & 0.272373771339463 & 0.544747542678925 & 0.727626228660537 \tabularnewline
25 & 0.204473000046142 & 0.408946000092284 & 0.795526999953858 \tabularnewline
26 & 0.159790512233035 & 0.31958102446607 & 0.840209487766965 \tabularnewline
27 & 0.118118936985378 & 0.236237873970756 & 0.881881063014622 \tabularnewline
28 & 0.0919210414102472 & 0.183842082820494 & 0.908078958589753 \tabularnewline
29 & 0.0886529171193103 & 0.177305834238621 & 0.91134708288069 \tabularnewline
30 & 0.0580341433475005 & 0.116068286695001 & 0.9419658566525 \tabularnewline
31 & 0.0533490258322642 & 0.106698051664528 & 0.946650974167736 \tabularnewline
32 & 0.090549438920489 & 0.181098877840978 & 0.909450561079511 \tabularnewline
33 & 0.0810178521635331 & 0.162035704327066 & 0.918982147836467 \tabularnewline
34 & 0.0727419075884224 & 0.145483815176845 & 0.927258092411578 \tabularnewline
35 & 0.0613366679856953 & 0.122673335971391 & 0.938663332014305 \tabularnewline
36 & 0.0448228584033816 & 0.089645716806763 & 0.955177141596618 \tabularnewline
37 & 0.0787022207466955 & 0.157404441493391 & 0.921297779253305 \tabularnewline
38 & 0.107111728595488 & 0.214223457190975 & 0.892888271404512 \tabularnewline
39 & 0.101966213059102 & 0.203932426118205 & 0.898033786940898 \tabularnewline
40 & 0.103420104704999 & 0.206840209409998 & 0.896579895295001 \tabularnewline
41 & 0.0897536164216421 & 0.179507232843284 & 0.910246383578358 \tabularnewline
42 & 0.185823457638471 & 0.371646915276942 & 0.814176542361529 \tabularnewline
43 & 0.188133462461684 & 0.376266924923368 & 0.811866537538316 \tabularnewline
44 & 0.653024817680585 & 0.693950364638830 & 0.346975182319415 \tabularnewline
45 & 0.673893861864632 & 0.652212276270736 & 0.326106138135368 \tabularnewline
46 & 0.620291329403054 & 0.759417341193892 & 0.379708670596946 \tabularnewline
\hline
\end{tabular}
%Source: https://freestatistics.org/blog/index.php?pk=57948&T=5

[TABLE]
[ROW][C]Goldfeld-Quandt test for Heteroskedasticity[/C][/ROW]
[ROW][C]p-values[/C][C]Alternative Hypothesis[/C][/ROW]
[ROW][C]breakpoint index[/C][C]greater[/C][C]2-sided[/C][C]less[/C][/ROW]
[ROW][C]10[/C][C]0.271181533643645[/C][C]0.542363067287290[/C][C]0.728818466356355[/C][/ROW]
[ROW][C]11[/C][C]0.617484323797822[/C][C]0.765031352404357[/C][C]0.382515676202178[/C][/ROW]
[ROW][C]12[/C][C]0.748682317858286[/C][C]0.502635364283427[/C][C]0.251317682141714[/C][/ROW]
[ROW][C]13[/C][C]0.714446407998396[/C][C]0.571107184003208[/C][C]0.285553592001604[/C][/ROW]
[ROW][C]14[/C][C]0.63128678058339[/C][C]0.73742643883322[/C][C]0.36871321941661[/C][/ROW]
[ROW][C]15[/C][C]0.518963628551646[/C][C]0.962072742896709[/C][C]0.481036371448354[/C][/ROW]
[ROW][C]16[/C][C]0.429113147700908[/C][C]0.858226295401816[/C][C]0.570886852299092[/C][/ROW]
[ROW][C]17[/C][C]0.433309302455932[/C][C]0.866618604911864[/C][C]0.566690697544068[/C][/ROW]
[ROW][C]18[/C][C]0.52274649930562[/C][C]0.95450700138876[/C][C]0.47725350069438[/C][/ROW]
[ROW][C]19[/C][C]0.456213793848702[/C][C]0.912427587697403[/C][C]0.543786206151298[/C][/ROW]
[ROW][C]20[/C][C]0.382904594504487[/C][C]0.765809189008973[/C][C]0.617095405495513[/C][/ROW]
[ROW][C]21[/C][C]0.421654931882504[/C][C]0.843309863765008[/C][C]0.578345068117496[/C][/ROW]
[ROW][C]22[/C][C]0.403051616033867[/C][C]0.806103232067733[/C][C]0.596948383966133[/C][/ROW]
[ROW][C]23[/C][C]0.340062673122351[/C][C]0.680125346244703[/C][C]0.659937326877649[/C][/ROW]
[ROW][C]24[/C][C]0.272373771339463[/C][C]0.544747542678925[/C][C]0.727626228660537[/C][/ROW]
[ROW][C]25[/C][C]0.204473000046142[/C][C]0.408946000092284[/C][C]0.795526999953858[/C][/ROW]
[ROW][C]26[/C][C]0.159790512233035[/C][C]0.31958102446607[/C][C]0.840209487766965[/C][/ROW]
[ROW][C]27[/C][C]0.118118936985378[/C][C]0.236237873970756[/C][C]0.881881063014622[/C][/ROW]
[ROW][C]28[/C][C]0.0919210414102472[/C][C]0.183842082820494[/C][C]0.908078958589753[/C][/ROW]
[ROW][C]29[/C][C]0.0886529171193103[/C][C]0.177305834238621[/C][C]0.91134708288069[/C][/ROW]
[ROW][C]30[/C][C]0.0580341433475005[/C][C]0.116068286695001[/C][C]0.9419658566525[/C][/ROW]
[ROW][C]31[/C][C]0.0533490258322642[/C][C]0.106698051664528[/C][C]0.946650974167736[/C][/ROW]
[ROW][C]32[/C][C]0.090549438920489[/C][C]0.181098877840978[/C][C]0.909450561079511[/C][/ROW]
[ROW][C]33[/C][C]0.0810178521635331[/C][C]0.162035704327066[/C][C]0.918982147836467[/C][/ROW]
[ROW][C]34[/C][C]0.0727419075884224[/C][C]0.145483815176845[/C][C]0.927258092411578[/C][/ROW]
[ROW][C]35[/C][C]0.0613366679856953[/C][C]0.122673335971391[/C][C]0.938663332014305[/C][/ROW]
[ROW][C]36[/C][C]0.0448228584033816[/C][C]0.089645716806763[/C][C]0.955177141596618[/C][/ROW]
[ROW][C]37[/C][C]0.0787022207466955[/C][C]0.157404441493391[/C][C]0.921297779253305[/C][/ROW]
[ROW][C]38[/C][C]0.107111728595488[/C][C]0.214223457190975[/C][C]0.892888271404512[/C][/ROW]
[ROW][C]39[/C][C]0.101966213059102[/C][C]0.203932426118205[/C][C]0.898033786940898[/C][/ROW]
[ROW][C]40[/C][C]0.103420104704999[/C][C]0.206840209409998[/C][C]0.896579895295001[/C][/ROW]
[ROW][C]41[/C][C]0.0897536164216421[/C][C]0.179507232843284[/C][C]0.910246383578358[/C][/ROW]
[ROW][C]42[/C][C]0.185823457638471[/C][C]0.371646915276942[/C][C]0.814176542361529[/C][/ROW]
[ROW][C]43[/C][C]0.188133462461684[/C][C]0.376266924923368[/C][C]0.811866537538316[/C][/ROW]
[ROW][C]44[/C][C]0.653024817680585[/C][C]0.693950364638830[/C][C]0.346975182319415[/C][/ROW]
[ROW][C]45[/C][C]0.673893861864632[/C][C]0.652212276270736[/C][C]0.326106138135368[/C][/ROW]
[ROW][C]46[/C][C]0.620291329403054[/C][C]0.759417341193892[/C][C]0.379708670596946[/C][/ROW]
[/TABLE]
Source: https://freestatistics.org/blog/index.php?pk=57948&T=5

Globally Unique Identifier (entire table): ba.freestatistics.org/blog/index.php?pk=57948&T=5

As an alternative you can also use a QR Code:  

The GUIDs for individual cells are displayed in the table below:

Goldfeld-Quandt test for Heteroskedasticity
p-valuesAlternative Hypothesis
breakpoint indexgreater2-sidedless
100.2711815336436450.5423630672872900.728818466356355
110.6174843237978220.7650313524043570.382515676202178
120.7486823178582860.5026353642834270.251317682141714
130.7144464079983960.5711071840032080.285553592001604
140.631286780583390.737426438833220.36871321941661
150.5189636285516460.9620727428967090.481036371448354
160.4291131477009080.8582262954018160.570886852299092
170.4333093024559320.8666186049118640.566690697544068
180.522746499305620.954507001388760.47725350069438
190.4562137938487020.9124275876974030.543786206151298
200.3829045945044870.7658091890089730.617095405495513
210.4216549318825040.8433098637650080.578345068117496
220.4030516160338670.8061032320677330.596948383966133
230.3400626731223510.6801253462447030.659937326877649
240.2723737713394630.5447475426789250.727626228660537
250.2044730000461420.4089460000922840.795526999953858
260.1597905122330350.319581024466070.840209487766965
270.1181189369853780.2362378739707560.881881063014622
280.09192104141024720.1838420828204940.908078958589753
290.08865291711931030.1773058342386210.91134708288069
300.05803414334750050.1160682866950010.9419658566525
310.05334902583226420.1066980516645280.946650974167736
320.0905494389204890.1810988778409780.909450561079511
330.08101785216353310.1620357043270660.918982147836467
340.07274190758842240.1454838151768450.927258092411578
350.06133666798569530.1226733359713910.938663332014305
360.04482285840338160.0896457168067630.955177141596618
370.07870222074669550.1574044414933910.921297779253305
380.1071117285954880.2142234571909750.892888271404512
390.1019662130591020.2039324261182050.898033786940898
400.1034201047049990.2068402094099980.896579895295001
410.08975361642164210.1795072328432840.910246383578358
420.1858234576384710.3716469152769420.814176542361529
430.1881334624616840.3762669249233680.811866537538316
440.6530248176805850.6939503646388300.346975182319415
450.6738938618646320.6522122762707360.326106138135368
460.6202913294030540.7594173411938920.379708670596946


Meta Analysis of Goldfeld-Quandt test for Heteroskedasticity
Description# significant tests% significant testsOK/NOK
1% type I error level00OK
5% type I error level00OK
10% type I error level10.0270270270270270OK

\begin{tabular}{lllllllll}
\hline
Meta Analysis of Goldfeld-Quandt test for Heteroskedasticity \tabularnewline
Description & # significant tests & % significant tests & OK/NOK \tabularnewline
1% type I error level & 0 & 0 & OK \tabularnewline
5% type I error level & 0 & 0 & OK \tabularnewline
10% type I error level & 1 & 0.0270270270270270 & OK \tabularnewline
\hline
\end{tabular}
%Source: https://freestatistics.org/blog/index.php?pk=57948&T=6

[TABLE]
[ROW][C]Meta Analysis of Goldfeld-Quandt test for Heteroskedasticity[/C][/ROW]
[ROW][C]Description[/C][C]# significant tests[/C][C]% significant tests[/C][C]OK/NOK[/C][/ROW]
[ROW][C]1% type I error level[/C][C]0[/C][C]0[/C][C]OK[/C][/ROW]
[ROW][C]5% type I error level[/C][C]0[/C][C]0[/C][C]OK[/C][/ROW]
[ROW][C]10% type I error level[/C][C]1[/C][C]0.0270270270270270[/C][C]OK[/C][/ROW]
[/TABLE]
Source: https://freestatistics.org/blog/index.php?pk=57948&T=6

Globally Unique Identifier (entire table): ba.freestatistics.org/blog/index.php?pk=57948&T=6

As an alternative you can also use a QR Code:  

The GUIDs for individual cells are displayed in the table below:

Meta Analysis of Goldfeld-Quandt test for Heteroskedasticity
Description# significant tests% significant testsOK/NOK
1% type I error level00OK
5% type I error level00OK
10% type I error level10.0270270270270270OK


Parameters (Session):
par1 = 2 ; par2 = Do not include Seasonal Dummies ; par3 = No Linear Trend ;
Parameters (R input):
par1 = 2 ; par2 = Do not include Seasonal Dummies ; par3 = Linear Trend ;
R code (references can be found in the software module):
library(lattice)
library(lmtest)
n25 <- 25 #minimum number of obs. for Goldfeld-Quandt test
par1 <- as.numeric(par1)
x <- t(y)
k <- length(x[1,])
n <- length(x[,1])
x1 <- cbind(x[,par1], x[,1:k!=par1])
mycolnames <- c(colnames(x)[par1], colnames(x)[1:k!=par1])
colnames(x1) <- mycolnames #colnames(x)[par1]
x <- x1
if (par3 == 'First Differences'){
x2 <- array(0, dim=c(n-1,k), dimnames=list(1:(n-1), paste('(1-B)',colnames(x),sep='')))
for (i in 1:n-1) {
for (j in 1:k) {
x2[i,j] <- x[i+1,j] - x[i,j]
}
}
x <- x2
}
if (par2 == 'Include Monthly Dummies'){
x2 <- array(0, dim=c(n,11), dimnames=list(1:n, paste('M', seq(1:11), sep ='')))
for (i in 1:11){
x2[seq(i,n,12),i] <- 1
}
x <- cbind(x, x2)
}
if (par2 == 'Include Quarterly Dummies'){
x2 <- array(0, dim=c(n,3), dimnames=list(1:n, paste('Q', seq(1:3), sep ='')))
for (i in 1:3){
x2[seq(i,n,4),i] <- 1
}
x <- cbind(x, x2)
}
k <- length(x[1,])
if (par3 == 'Linear Trend'){
x <- cbind(x, c(1:n))
colnames(x)[k+1] <- 't'
}
x
k <- length(x[1,])
df <- as.data.frame(x)
(mylm <- lm(df))
(mysum <- summary(mylm))
if (n > n25) {
kp3 <- k + 3
nmkm3 <- n - k - 3
gqarr <- array(NA, dim=c(nmkm3-kp3+1,3))
numgqtests <- 0
numsignificant1 <- 0
numsignificant5 <- 0
numsignificant10 <- 0
for (mypoint in kp3:nmkm3) {
j <- 0
numgqtests <- numgqtests + 1
for (myalt in c('greater', 'two.sided', 'less')) {
j <- j + 1
gqarr[mypoint-kp3+1,j] <- gqtest(mylm, point=mypoint, alternative=myalt)$p.value
}
if (gqarr[mypoint-kp3+1,2] < 0.01) numsignificant1 <- numsignificant1 + 1
if (gqarr[mypoint-kp3+1,2] < 0.05) numsignificant5 <- numsignificant5 + 1
if (gqarr[mypoint-kp3+1,2] < 0.10) numsignificant10 <- numsignificant10 + 1
}
gqarr
}
bitmap(file='test0.png')
plot(x[,1], type='l', main='Actuals and Interpolation', ylab='value of Actuals and Interpolation (dots)', xlab='time or index')
points(x[,1]-mysum$resid)
grid()
dev.off()
bitmap(file='test1.png')
plot(mysum$resid, type='b', pch=19, main='Residuals', ylab='value of Residuals', xlab='time or index')
grid()
dev.off()
bitmap(file='test2.png')
hist(mysum$resid, main='Residual Histogram', xlab='values of Residuals')
grid()
dev.off()
bitmap(file='test3.png')
densityplot(~mysum$resid,col='black',main='Residual Density Plot', xlab='values of Residuals')
dev.off()
bitmap(file='test4.png')
qqnorm(mysum$resid, main='Residual Normal Q-Q Plot')
qqline(mysum$resid)
grid()
dev.off()
(myerror <- as.ts(mysum$resid))
bitmap(file='test5.png')
dum <- cbind(lag(myerror,k=1),myerror)
dum
dum1 <- dum[2:length(myerror),]
dum1
z <- as.data.frame(dum1)
z
plot(z,main=paste('Residual Lag plot, lowess, and regression line'), ylab='values of Residuals', xlab='lagged values of Residuals')
lines(lowess(z))
abline(lm(z))
grid()
dev.off()
bitmap(file='test6.png')
acf(mysum$resid, lag.max=length(mysum$resid)/2, main='Residual Autocorrelation Function')
grid()
dev.off()
bitmap(file='test7.png')
pacf(mysum$resid, lag.max=length(mysum$resid)/2, main='Residual Partial Autocorrelation Function')
grid()
dev.off()
bitmap(file='test8.png')
opar <- par(mfrow = c(2,2), oma = c(0, 0, 1.1, 0))
plot(mylm, las = 1, sub='Residual Diagnostics')
par(opar)
dev.off()
if (n > n25) {
bitmap(file='test9.png')
plot(kp3:nmkm3,gqarr[,2], main='Goldfeld-Quandt test',ylab='2-sided p-value',xlab='breakpoint')
grid()
dev.off()
}
load(file='createtable')
a<-table.start()
a<-table.row.start(a)
a<-table.element(a, 'Multiple Linear Regression - Estimated Regression Equation', 1, TRUE)
a<-table.row.end(a)
myeq <- colnames(x)[1]
myeq <- paste(myeq, '[t] = ', sep='')
for (i in 1:k){
if (mysum$coefficients[i,1] > 0) myeq <- paste(myeq, '+', '')
myeq <- paste(myeq, mysum$coefficients[i,1], sep=' ')
if (rownames(mysum$coefficients)[i] != '(Intercept)') {
myeq <- paste(myeq, rownames(mysum$coefficients)[i], sep='')
if (rownames(mysum$coefficients)[i] != 't') myeq <- paste(myeq, '[t]', sep='')
}
}
myeq <- paste(myeq, ' + e[t]')
a<-table.row.start(a)
a<-table.element(a, myeq)
a<-table.row.end(a)
a<-table.end(a)
table.save(a,file='mytable1.tab')
a<-table.start()
a<-table.row.start(a)
a<-table.element(a,hyperlink('ols1.htm','Multiple Linear Regression - Ordinary Least Squares',''), 6, TRUE)
a<-table.row.end(a)
a<-table.row.start(a)
a<-table.element(a,'Variable',header=TRUE)
a<-table.element(a,'Parameter',header=TRUE)
a<-table.element(a,'S.D.',header=TRUE)
a<-table.element(a,'T-STAT
H0: parameter = 0',header=TRUE)
a<-table.element(a,'2-tail p-value',header=TRUE)
a<-table.element(a,'1-tail p-value',header=TRUE)
a<-table.row.end(a)
for (i in 1:k){
a<-table.row.start(a)
a<-table.element(a,rownames(mysum$coefficients)[i],header=TRUE)
a<-table.element(a,mysum$coefficients[i,1])
a<-table.element(a, round(mysum$coefficients[i,2],6))
a<-table.element(a, round(mysum$coefficients[i,3],4))
a<-table.element(a, round(mysum$coefficients[i,4],6))
a<-table.element(a, round(mysum$coefficients[i,4]/2,6))
a<-table.row.end(a)
}
a<-table.end(a)
table.save(a,file='mytable2.tab')
a<-table.start()
a<-table.row.start(a)
a<-table.element(a, 'Multiple Linear Regression - Regression Statistics', 2, TRUE)
a<-table.row.end(a)
a<-table.row.start(a)
a<-table.element(a, 'Multiple R',1,TRUE)
a<-table.element(a, sqrt(mysum$r.squared))
a<-table.row.end(a)
a<-table.row.start(a)
a<-table.element(a, 'R-squared',1,TRUE)
a<-table.element(a, mysum$r.squared)
a<-table.row.end(a)
a<-table.row.start(a)
a<-table.element(a, 'Adjusted R-squared',1,TRUE)
a<-table.element(a, mysum$adj.r.squared)
a<-table.row.end(a)
a<-table.row.start(a)
a<-table.element(a, 'F-TEST (value)',1,TRUE)
a<-table.element(a, mysum$fstatistic[1])
a<-table.row.end(a)
a<-table.row.start(a)
a<-table.element(a, 'F-TEST (DF numerator)',1,TRUE)
a<-table.element(a, mysum$fstatistic[2])
a<-table.row.end(a)
a<-table.row.start(a)
a<-table.element(a, 'F-TEST (DF denominator)',1,TRUE)
a<-table.element(a, mysum$fstatistic[3])
a<-table.row.end(a)
a<-table.row.start(a)
a<-table.element(a, 'p-value',1,TRUE)
a<-table.element(a, 1-pf(mysum$fstatistic[1],mysum$fstatistic[2],mysum$fstatistic[3]))
a<-table.row.end(a)
a<-table.row.start(a)
a<-table.element(a, 'Multiple Linear Regression - Residual Statistics', 2, TRUE)
a<-table.row.end(a)
a<-table.row.start(a)
a<-table.element(a, 'Residual Standard Deviation',1,TRUE)
a<-table.element(a, mysum$sigma)
a<-table.row.end(a)
a<-table.row.start(a)
a<-table.element(a, 'Sum Squared Residuals',1,TRUE)
a<-table.element(a, sum(myerror*myerror))
a<-table.row.end(a)
a<-table.end(a)
table.save(a,file='mytable3.tab')
a<-table.start()
a<-table.row.start(a)
a<-table.element(a, 'Multiple Linear Regression - Actuals, Interpolation, and Residuals', 4, TRUE)
a<-table.row.end(a)
a<-table.row.start(a)
a<-table.element(a, 'Time or Index', 1, TRUE)
a<-table.element(a, 'Actuals', 1, TRUE)
a<-table.element(a, 'Interpolation
Forecast', 1, TRUE)
a<-table.element(a, 'Residuals
Prediction Error', 1, TRUE)
a<-table.row.end(a)
for (i in 1:n) {
a<-table.row.start(a)
a<-table.element(a,i, 1, TRUE)
a<-table.element(a,x[i])
a<-table.element(a,x[i]-mysum$resid[i])
a<-table.element(a,mysum$resid[i])
a<-table.row.end(a)
}
a<-table.end(a)
table.save(a,file='mytable4.tab')
if (n > n25) {
a<-table.start()
a<-table.row.start(a)
a<-table.element(a,'Goldfeld-Quandt test for Heteroskedasticity',4,TRUE)
a<-table.row.end(a)
a<-table.row.start(a)
a<-table.element(a,'p-values',header=TRUE)
a<-table.element(a,'Alternative Hypothesis',3,header=TRUE)
a<-table.row.end(a)
a<-table.row.start(a)
a<-table.element(a,'breakpoint index',header=TRUE)
a<-table.element(a,'greater',header=TRUE)
a<-table.element(a,'2-sided',header=TRUE)
a<-table.element(a,'less',header=TRUE)
a<-table.row.end(a)
for (mypoint in kp3:nmkm3) {
a<-table.row.start(a)
a<-table.element(a,mypoint,header=TRUE)
a<-table.element(a,gqarr[mypoint-kp3+1,1])
a<-table.element(a,gqarr[mypoint-kp3+1,2])
a<-table.element(a,gqarr[mypoint-kp3+1,3])
a<-table.row.end(a)
}
a<-table.end(a)
table.save(a,file='mytable5.tab')
a<-table.start()
a<-table.row.start(a)
a<-table.element(a,'Meta Analysis of Goldfeld-Quandt test for Heteroskedasticity',4,TRUE)
a<-table.row.end(a)
a<-table.row.start(a)
a<-table.element(a,'Description',header=TRUE)
a<-table.element(a,'# significant tests',header=TRUE)
a<-table.element(a,'% significant tests',header=TRUE)
a<-table.element(a,'OK/NOK',header=TRUE)
a<-table.row.end(a)
a<-table.row.start(a)
a<-table.element(a,'1% type I error level',header=TRUE)
a<-table.element(a,numsignificant1)
a<-table.element(a,numsignificant1/numgqtests)
if (numsignificant1/numgqtests < 0.01) dum <- 'OK' else dum <- 'NOK'
a<-table.element(a,dum)
a<-table.row.end(a)
a<-table.row.start(a)
a<-table.element(a,'5% type I error level',header=TRUE)
a<-table.element(a,numsignificant5)
a<-table.element(a,numsignificant5/numgqtests)
if (numsignificant5/numgqtests < 0.05) dum <- 'OK' else dum <- 'NOK'
a<-table.element(a,dum)
a<-table.row.end(a)
a<-table.row.start(a)
a<-table.element(a,'10% type I error level',header=TRUE)
a<-table.element(a,numsignificant10)
a<-table.element(a,numsignificant10/numgqtests)
if (numsignificant10/numgqtests < 0.1) dum <- 'OK' else dum <- 'NOK'
a<-table.element(a,dum)
a<-table.row.end(a)
a<-table.end(a)
table.save(a,file='mytable6.tab')
}