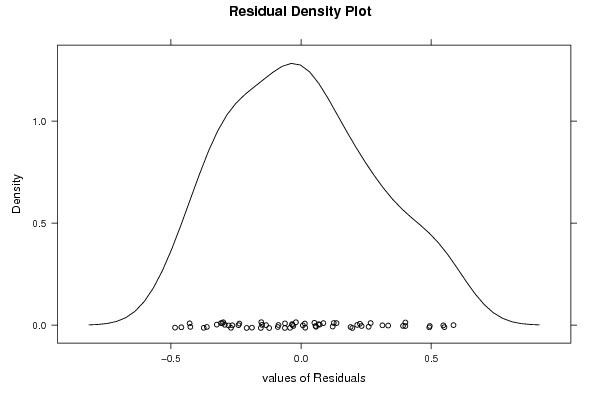
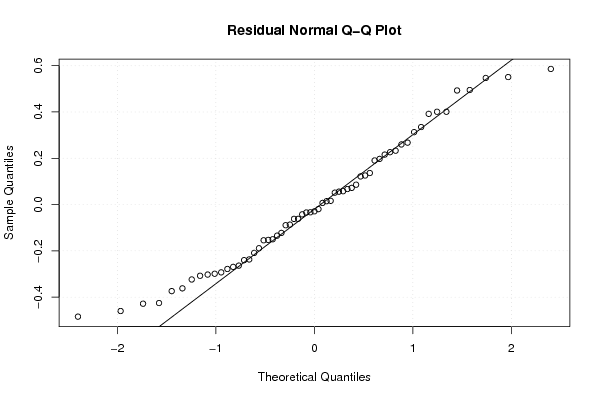
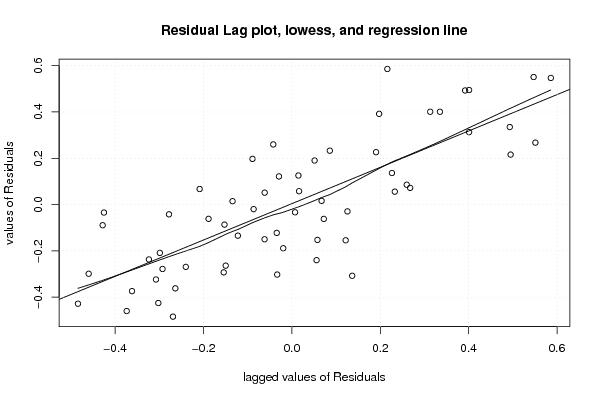
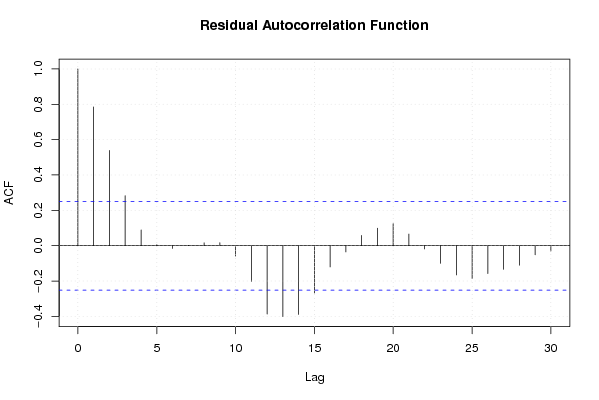
Free Statistics

of Irreproducible Research!

Author's title

Author*The author of this computation has been verified*
R Software Modulerwasp_multipleregression.wasp
Title produced by softwareMultiple Regression
Date of computationFri, 20 Nov 2009 06:14:04 -0700
Cite this page as followsStatistical Computations at FreeStatistics.org, Office for Research Development and Education, URL https://freestatistics.org/blog/index.php?v=date/2009/Nov/20/t125872290782lq2ugehjl46h9.htm/, Retrieved Fri, 26 Apr 2024 04:38:31 +0000
Statistical Computations at FreeStatistics.org, Office for Research Development and Education, URL https://freestatistics.org/blog/index.php?pk=58121, Retrieved Fri, 26 Apr 2024 04:38:31 +0000
QR Codes:

Original text written by user:
IsPrivate?No (this computation is public)
User-defined keywords
Estimated Impact253
Family? (F = Feedback message, R = changed R code, M = changed R Module, P = changed Parameters, D = changed Data)
-     [Multiple Regression] [Q1 The Seatbeltlaw] [2007-11-14 19:27:43] [8cd6641b921d30ebe00b648d1481bba0]
- RMPD  [Multiple Regression] [Seatbelt] [2009-11-12 13:54:52] [b98453cac15ba1066b407e146608df68]
-    D    [Multiple Regression] [model 1] [2009-11-17 14:36:29] [ed603017d2bee8fbd82b6d5ec04e12c3]
-    D      [Multiple Regression] [multiple regression] [2009-11-19 21:38:11] [ed603017d2bee8fbd82b6d5ec04e12c3]
-   P         [Multiple Regression] [monthly dummies] [2009-11-19 22:00:07] [ed603017d2bee8fbd82b6d5ec04e12c3]
-   P           [Multiple Regression] [model3] [2009-11-20 08:47:44] [ed603017d2bee8fbd82b6d5ec04e12c3]
-    D              [Multiple Regression] [Workshop7] [2009-11-20 13:14:04] [307139c5e328127f586f26d5bcc435d8] [Current]
-    D                [Multiple Regression] [workshop7] [2009-11-20 13:34:45] [34b80aeb109c116fd63bf2eb7493a276]
-   P                   [Multiple Regression] [Workshop 7: verbe...] [2009-11-27 14:49:24] [7c2a5b25a196bd646844b8f5223c9b3e]
-   PD                [Multiple Regression] [Workshop 7] [2009-11-20 16:57:31] [78762f311bef5a0e45c439762ada383c]
-   P                   [Multiple Regression] [verb ws 7] [2009-11-21 09:45:52] [134dc66689e3d457a82860db6471d419]
-    D                [Multiple Regression] [model 3] [2009-12-05 14:58:14] [34b80aeb109c116fd63bf2eb7493a276]
Feedback Forum

Post a new message
Dataseries X:
105.4	102.7
105.4	102.5
105.6	102.2
105.7	102.9
105.8	103.1
105.8	103
105.8	102.8
105.9	102.5
106.1	101.9
106.4	101.9
106.4	101.8
106.3	102
106.2	102.6
106.2	102.5
106.3	102.5
106.4	101.6
106.5	101.4
106.6	100.8
106.6	101.1
106.6	101.3
106.8	101.2
107	101.3
107.2	101.1
107.3	101.3
107.5	101.2
107.6	101.6
107.6	101.7
107.7	101.5
107.7	100.9
107.7	101.5
107.7	101.4
107.6	101.6
107.7	101.7
107.9	101.4
107.9	101.8
107.9	101.7
107.8	101.4
107.6	101.2
107.4	101
107	101.7
107	102.4
107.2	102
107.5	102.1
107.8	102
107.8	101.8
107.7	102.7
107.6	102.3
107.6	101.9
107.5	102
107.5	102.3
107.6	102.8
107.6	102.4
107.9	102.3
107.6	102.7
107.5	102.7
107.5	102.9
107.6	103
107.7	102.2
107.8	102.3
107.9	102.8
107.9	102.8


Summary of computational transaction
Raw Inputview raw input (R code)
Raw Outputview raw output of R engine
Computing time5 seconds
R Server'Gwilym Jenkins' @ 72.249.127.135

\begin{tabular}{lllllllll}
\hline
Summary of computational transaction \tabularnewline
Raw Input & view raw input (R code)  \tabularnewline
Raw Output & view raw output of R engine  \tabularnewline
Computing time & 5 seconds \tabularnewline
R Server & 'Gwilym Jenkins' @ 72.249.127.135 \tabularnewline
\hline
\end{tabular}
%Source: https://freestatistics.org/blog/index.php?pk=58121&T=0

[TABLE]
[ROW][C]Summary of computational transaction[/C][/ROW]
[ROW][C]Raw Input[/C][C]view raw input (R code) [/C][/ROW]
[ROW][C]Raw Output[/C][C]view raw output of R engine [/C][/ROW]
[ROW][C]Computing time[/C][C]5 seconds[/C][/ROW]
[ROW][C]R Server[/C][C]'Gwilym Jenkins' @ 72.249.127.135[/C][/ROW]
[/TABLE]
Source: https://freestatistics.org/blog/index.php?pk=58121&T=0

Globally Unique Identifier (entire table): ba.freestatistics.org/blog/index.php?pk=58121&T=0

As an alternative you can also use a QR Code:  

The GUIDs for individual cells are displayed in the table below:

Summary of computational transaction
Raw Inputview raw input (R code)
Raw Outputview raw output of R engine
Computing time5 seconds
R Server'Gwilym Jenkins' @ 72.249.127.135


Multiple Linear Regression - Estimated Regression Equation
Werkl[t] = + 151.897366875482 -0.450048120480986Infl[t] -0.0787500367219569M1[t] -0.120513226375434M2[t] -0.109860556364425M3[t] -0.177209811172649M4[t] -0.115558103571257M5[t] -0.162907358379490M6[t] -0.152254688368479M7[t] -0.112601055947849M8[t] -0.0939560852137956M9[t] -0.00130534002201750M10[t] -0.0176555572398707M11[t] + 0.0383482923986089t + e[t]

\begin{tabular}{lllllllll}
\hline
Multiple Linear Regression - Estimated Regression Equation \tabularnewline
Werkl[t] =  +  151.897366875482 -0.450048120480986Infl[t] -0.0787500367219569M1[t] -0.120513226375434M2[t] -0.109860556364425M3[t] -0.177209811172649M4[t] -0.115558103571257M5[t] -0.162907358379490M6[t] -0.152254688368479M7[t] -0.112601055947849M8[t] -0.0939560852137956M9[t] -0.00130534002201750M10[t] -0.0176555572398707M11[t] +  0.0383482923986089t  + e[t] \tabularnewline
\hline
\end{tabular}
%Source: https://freestatistics.org/blog/index.php?pk=58121&T=1

[TABLE]
[ROW][C]Multiple Linear Regression - Estimated Regression Equation[/C][/ROW]
[ROW][C]Werkl[t] =  +  151.897366875482 -0.450048120480986Infl[t] -0.0787500367219569M1[t] -0.120513226375434M2[t] -0.109860556364425M3[t] -0.177209811172649M4[t] -0.115558103571257M5[t] -0.162907358379490M6[t] -0.152254688368479M7[t] -0.112601055947849M8[t] -0.0939560852137956M9[t] -0.00130534002201750M10[t] -0.0176555572398707M11[t] +  0.0383482923986089t  + e[t][/C][/ROW]
[/TABLE]
Source: https://freestatistics.org/blog/index.php?pk=58121&T=1

Globally Unique Identifier (entire table): ba.freestatistics.org/blog/index.php?pk=58121&T=1

As an alternative you can also use a QR Code:  

The GUIDs for individual cells are displayed in the table below:

Multiple Linear Regression - Estimated Regression Equation
Werkl[t] = + 151.897366875482 -0.450048120480986Infl[t] -0.0787500367219569M1[t] -0.120513226375434M2[t] -0.109860556364425M3[t] -0.177209811172649M4[t] -0.115558103571257M5[t] -0.162907358379490M6[t] -0.152254688368479M7[t] -0.112601055947849M8[t] -0.0939560852137956M9[t] -0.00130534002201750M10[t] -0.0176555572398707M11[t] + 0.0383482923986089t + e[t]


Multiple Linear Regression - Ordinary Least Squares
VariableParameterS.D.T-STATH0: parameter = 02-tail p-value1-tail p-value
(Intercept)151.8973668754826.78883122.374600
Infl-0.4500481204809860.066701-6.747300
M1-0.07875003672195690.191341-0.41160.6825270.341263
M2-0.1205132263754340.200525-0.6010.5507350.275367
M3-0.1098605563644250.200315-0.54840.5859860.292993
M4-0.1772098111726490.20001-0.8860.3801270.190063
M5-0.1155581035712570.199794-0.57840.5657650.282882
M6-0.1629073583794900.19956-0.81630.4184280.209214
M7-0.1522546883684790.199444-0.76340.4490420.224521
M8-0.1126010559478490.199418-0.56460.5749980.287499
M9-0.09395608521379560.199101-0.47190.6391810.319591
M10-0.001305340022017500.199043-0.00660.9947950.497398
M11-0.01765555723987070.199055-0.08870.92970.46485
t0.03834829239860890.00234816.330500

\begin{tabular}{lllllllll}
\hline
Multiple Linear Regression - Ordinary Least Squares \tabularnewline
Variable & Parameter & S.D. & T-STATH0: parameter = 0 & 2-tail p-value & 1-tail p-value \tabularnewline
(Intercept) & 151.897366875482 & 6.788831 & 22.3746 & 0 & 0 \tabularnewline
Infl & -0.450048120480986 & 0.066701 & -6.7473 & 0 & 0 \tabularnewline
M1 & -0.0787500367219569 & 0.191341 & -0.4116 & 0.682527 & 0.341263 \tabularnewline
M2 & -0.120513226375434 & 0.200525 & -0.601 & 0.550735 & 0.275367 \tabularnewline
M3 & -0.109860556364425 & 0.200315 & -0.5484 & 0.585986 & 0.292993 \tabularnewline
M4 & -0.177209811172649 & 0.20001 & -0.886 & 0.380127 & 0.190063 \tabularnewline
M5 & -0.115558103571257 & 0.199794 & -0.5784 & 0.565765 & 0.282882 \tabularnewline
M6 & -0.162907358379490 & 0.19956 & -0.8163 & 0.418428 & 0.209214 \tabularnewline
M7 & -0.152254688368479 & 0.199444 & -0.7634 & 0.449042 & 0.224521 \tabularnewline
M8 & -0.112601055947849 & 0.199418 & -0.5646 & 0.574998 & 0.287499 \tabularnewline
M9 & -0.0939560852137956 & 0.199101 & -0.4719 & 0.639181 & 0.319591 \tabularnewline
M10 & -0.00130534002201750 & 0.199043 & -0.0066 & 0.994795 & 0.497398 \tabularnewline
M11 & -0.0176555572398707 & 0.199055 & -0.0887 & 0.9297 & 0.46485 \tabularnewline
t & 0.0383482923986089 & 0.002348 & 16.3305 & 0 & 0 \tabularnewline
\hline
\end{tabular}
%Source: https://freestatistics.org/blog/index.php?pk=58121&T=2

[TABLE]
[ROW][C]Multiple Linear Regression - Ordinary Least Squares[/C][/ROW]
[ROW][C]Variable[/C][C]Parameter[/C][C]S.D.[/C][C]T-STATH0: parameter = 0[/C][C]2-tail p-value[/C][C]1-tail p-value[/C][/ROW]
[ROW][C](Intercept)[/C][C]151.897366875482[/C][C]6.788831[/C][C]22.3746[/C][C]0[/C][C]0[/C][/ROW]
[ROW][C]Infl[/C][C]-0.450048120480986[/C][C]0.066701[/C][C]-6.7473[/C][C]0[/C][C]0[/C][/ROW]
[ROW][C]M1[/C][C]-0.0787500367219569[/C][C]0.191341[/C][C]-0.4116[/C][C]0.682527[/C][C]0.341263[/C][/ROW]
[ROW][C]M2[/C][C]-0.120513226375434[/C][C]0.200525[/C][C]-0.601[/C][C]0.550735[/C][C]0.275367[/C][/ROW]
[ROW][C]M3[/C][C]-0.109860556364425[/C][C]0.200315[/C][C]-0.5484[/C][C]0.585986[/C][C]0.292993[/C][/ROW]
[ROW][C]M4[/C][C]-0.177209811172649[/C][C]0.20001[/C][C]-0.886[/C][C]0.380127[/C][C]0.190063[/C][/ROW]
[ROW][C]M5[/C][C]-0.115558103571257[/C][C]0.199794[/C][C]-0.5784[/C][C]0.565765[/C][C]0.282882[/C][/ROW]
[ROW][C]M6[/C][C]-0.162907358379490[/C][C]0.19956[/C][C]-0.8163[/C][C]0.418428[/C][C]0.209214[/C][/ROW]
[ROW][C]M7[/C][C]-0.152254688368479[/C][C]0.199444[/C][C]-0.7634[/C][C]0.449042[/C][C]0.224521[/C][/ROW]
[ROW][C]M8[/C][C]-0.112601055947849[/C][C]0.199418[/C][C]-0.5646[/C][C]0.574998[/C][C]0.287499[/C][/ROW]
[ROW][C]M9[/C][C]-0.0939560852137956[/C][C]0.199101[/C][C]-0.4719[/C][C]0.639181[/C][C]0.319591[/C][/ROW]
[ROW][C]M10[/C][C]-0.00130534002201750[/C][C]0.199043[/C][C]-0.0066[/C][C]0.994795[/C][C]0.497398[/C][/ROW]
[ROW][C]M11[/C][C]-0.0176555572398707[/C][C]0.199055[/C][C]-0.0887[/C][C]0.9297[/C][C]0.46485[/C][/ROW]
[ROW][C]t[/C][C]0.0383482923986089[/C][C]0.002348[/C][C]16.3305[/C][C]0[/C][C]0[/C][/ROW]
[/TABLE]
Source: https://freestatistics.org/blog/index.php?pk=58121&T=2

Globally Unique Identifier (entire table): ba.freestatistics.org/blog/index.php?pk=58121&T=2

As an alternative you can also use a QR Code:  

The GUIDs for individual cells are displayed in the table below:

Multiple Linear Regression - Ordinary Least Squares
VariableParameterS.D.T-STATH0: parameter = 02-tail p-value1-tail p-value
(Intercept)151.8973668754826.78883122.374600
Infl-0.4500481204809860.066701-6.747300
M1-0.07875003672195690.191341-0.41160.6825270.341263
M2-0.1205132263754340.200525-0.6010.5507350.275367
M3-0.1098605563644250.200315-0.54840.5859860.292993
M4-0.1772098111726490.20001-0.8860.3801270.190063
M5-0.1155581035712570.199794-0.57840.5657650.282882
M6-0.1629073583794900.19956-0.81630.4184280.209214
M7-0.1522546883684790.199444-0.76340.4490420.224521
M8-0.1126010559478490.199418-0.56460.5749980.287499
M9-0.09395608521379560.199101-0.47190.6391810.319591
M10-0.001305340022017500.199043-0.00660.9947950.497398
M11-0.01765555723987070.199055-0.08870.92970.46485
t0.03834829239860890.00234816.330500


Multiple Linear Regression - Regression Statistics
Multiple R0.931216785308686
R-squared0.867164701240643
Adjusted R-squared0.830423022860395
F-TEST (value)23.6016627293442
F-TEST (DF numerator)13
F-TEST (DF denominator)47
p-value2.22044604925031e-16
Multiple Linear Regression - Residual Statistics
Residual Standard Deviation0.3146140316187
Sum Squared Residuals4.65215347789449

\begin{tabular}{lllllllll}
\hline
Multiple Linear Regression - Regression Statistics \tabularnewline
Multiple R & 0.931216785308686 \tabularnewline
R-squared & 0.867164701240643 \tabularnewline
Adjusted R-squared & 0.830423022860395 \tabularnewline
F-TEST (value) & 23.6016627293442 \tabularnewline
F-TEST (DF numerator) & 13 \tabularnewline
F-TEST (DF denominator) & 47 \tabularnewline
p-value & 2.22044604925031e-16 \tabularnewline
Multiple Linear Regression - Residual Statistics \tabularnewline
Residual Standard Deviation & 0.3146140316187 \tabularnewline
Sum Squared Residuals & 4.65215347789449 \tabularnewline
\hline
\end{tabular}
%Source: https://freestatistics.org/blog/index.php?pk=58121&T=3

[TABLE]
[ROW][C]Multiple Linear Regression - Regression Statistics[/C][/ROW]
[ROW][C]Multiple R[/C][C]0.931216785308686[/C][/ROW]
[ROW][C]R-squared[/C][C]0.867164701240643[/C][/ROW]
[ROW][C]Adjusted R-squared[/C][C]0.830423022860395[/C][/ROW]
[ROW][C]F-TEST (value)[/C][C]23.6016627293442[/C][/ROW]
[ROW][C]F-TEST (DF numerator)[/C][C]13[/C][/ROW]
[ROW][C]F-TEST (DF denominator)[/C][C]47[/C][/ROW]
[ROW][C]p-value[/C][C]2.22044604925031e-16[/C][/ROW]
[ROW][C]Multiple Linear Regression - Residual Statistics[/C][/ROW]
[ROW][C]Residual Standard Deviation[/C][C]0.3146140316187[/C][/ROW]
[ROW][C]Sum Squared Residuals[/C][C]4.65215347789449[/C][/ROW]
[/TABLE]
Source: https://freestatistics.org/blog/index.php?pk=58121&T=3

Globally Unique Identifier (entire table): ba.freestatistics.org/blog/index.php?pk=58121&T=3

As an alternative you can also use a QR Code:  

The GUIDs for individual cells are displayed in the table below:

Multiple Linear Regression - Regression Statistics
Multiple R0.931216785308686
R-squared0.867164701240643
Adjusted R-squared0.830423022860395
F-TEST (value)23.6016627293442
F-TEST (DF numerator)13
F-TEST (DF denominator)47
p-value2.22044604925031e-16
Multiple Linear Regression - Residual Statistics
Residual Standard Deviation0.3146140316187
Sum Squared Residuals4.65215347789449


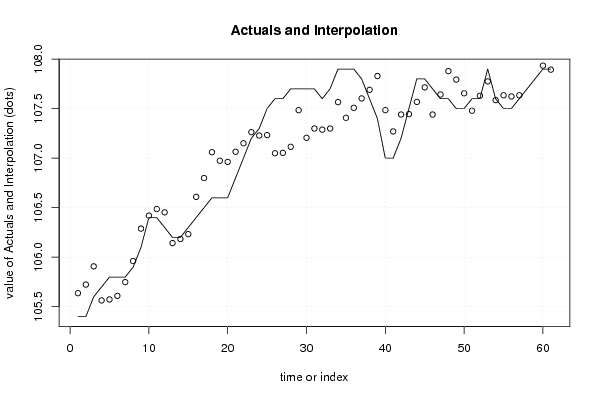
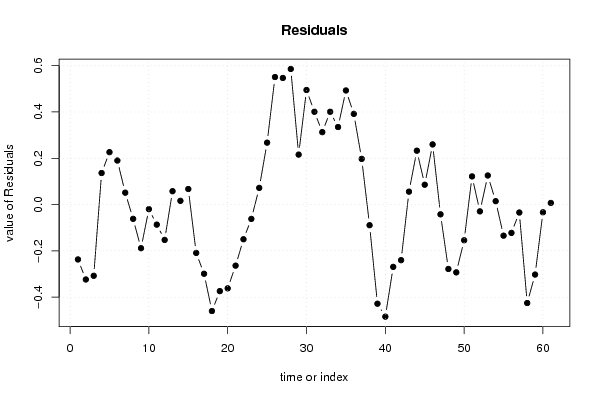
Multiple Linear Regression - Actuals, Interpolation, and Residuals
Time or IndexActualsInterpolationForecastResidualsPrediction Error
1105.4105.637023157761-0.237023157761039
2105.4105.723617884603-0.323617884602509
3105.6105.907633283156-0.307633283156431
4105.7105.563598636410.136401363589883
5105.8105.5735890123140.226410987686070
6105.8105.6095928619520.190407138047597
7105.8105.7486034484580.0513965515417788
8105.9105.961619809422-0.0616198094217461
9106.1106.288641944843-0.188641944843008
10106.4106.419640982433-0.0196409824333840
11106.4106.486643869662-0.0866438696622418
12106.3106.452638095205-0.152638095204531
13106.2106.1422074785930.0577925214074108
14106.2106.1837973933860.0162026066141837
15106.3106.2327983557950.0672016442045595
16106.4106.608840701819-0.208840701818706
17106.5106.798850325915-0.298850325914904
18106.6107.059878235794-0.459878235793881
19106.6106.973864762059-0.373864762059206
20106.6106.961857062782-0.361857062782248
21106.8107.063855137963-0.263855137963003
22107107.149849363505-0.149849363505291
23107.2107.261857062782-0.0618570627822418
24107.3107.2278512883250.0721487116754713
25107.5107.2324543560490.267545643950726
26107.6107.0490202106020.550979789397979
27107.6107.0530163609640.546983639036463
28107.7107.1140250226500.585974977349888
29107.7107.4840538949390.2159461050613
30107.7107.2050240602400.494975939759512
31107.7107.2990298346980.400970165301796
32107.6107.2870221354210.312977864578741
33107.7107.2990105865060.400989413494189
34107.9107.5650240602400.334975939759511
35107.9107.4070028872290.492997112771146
36107.9107.5080115489150.39198845108457
37107.8107.6026242407360.197375759263615
38107.6107.689218967578-0.0892189675777174
39107.4107.828229554084-0.428229554083523
40107107.484194907337-0.484194907337222
41107107.269161223001-0.269161223000531
42107.2107.440179508783-0.240179508783302
43107.5107.4441756591450.0558243408551718
44107.8107.5671823960120.232817603987833
45107.8107.7141852832410.0858147167589736
46107.7107.4401410123990.259858987601482
47107.6107.642158335772-0.0421583357716794
48107.6107.878181433603-0.278181433602549
49107.5107.792774877231-0.292774877231100
50107.5107.654345543832-0.154345543831937
51107.6107.4783224460010.121677553998932
52107.6107.629340731784-0.0293407317838436
53107.9107.7743455438320.125654456168065
54107.6107.585325333230.0146746667700741
55107.5107.634326295640-0.134326295639540
56107.5107.622318596363-0.122318596362581
57107.6107.634307047447-0.0343070474471519
58107.7108.125344581422-0.425344581422318
59107.8108.102337844555-0.302337844554983
60107.9107.933317633953-0.0333176339529607
61107.9107.8929158896300.00708411037038624

\begin{tabular}{lllllllll}
\hline
Multiple Linear Regression - Actuals, Interpolation, and Residuals \tabularnewline
Time or Index & Actuals & InterpolationForecast & ResidualsPrediction Error \tabularnewline
1 & 105.4 & 105.637023157761 & -0.237023157761039 \tabularnewline
2 & 105.4 & 105.723617884603 & -0.323617884602509 \tabularnewline
3 & 105.6 & 105.907633283156 & -0.307633283156431 \tabularnewline
4 & 105.7 & 105.56359863641 & 0.136401363589883 \tabularnewline
5 & 105.8 & 105.573589012314 & 0.226410987686070 \tabularnewline
6 & 105.8 & 105.609592861952 & 0.190407138047597 \tabularnewline
7 & 105.8 & 105.748603448458 & 0.0513965515417788 \tabularnewline
8 & 105.9 & 105.961619809422 & -0.0616198094217461 \tabularnewline
9 & 106.1 & 106.288641944843 & -0.188641944843008 \tabularnewline
10 & 106.4 & 106.419640982433 & -0.0196409824333840 \tabularnewline
11 & 106.4 & 106.486643869662 & -0.0866438696622418 \tabularnewline
12 & 106.3 & 106.452638095205 & -0.152638095204531 \tabularnewline
13 & 106.2 & 106.142207478593 & 0.0577925214074108 \tabularnewline
14 & 106.2 & 106.183797393386 & 0.0162026066141837 \tabularnewline
15 & 106.3 & 106.232798355795 & 0.0672016442045595 \tabularnewline
16 & 106.4 & 106.608840701819 & -0.208840701818706 \tabularnewline
17 & 106.5 & 106.798850325915 & -0.298850325914904 \tabularnewline
18 & 106.6 & 107.059878235794 & -0.459878235793881 \tabularnewline
19 & 106.6 & 106.973864762059 & -0.373864762059206 \tabularnewline
20 & 106.6 & 106.961857062782 & -0.361857062782248 \tabularnewline
21 & 106.8 & 107.063855137963 & -0.263855137963003 \tabularnewline
22 & 107 & 107.149849363505 & -0.149849363505291 \tabularnewline
23 & 107.2 & 107.261857062782 & -0.0618570627822418 \tabularnewline
24 & 107.3 & 107.227851288325 & 0.0721487116754713 \tabularnewline
25 & 107.5 & 107.232454356049 & 0.267545643950726 \tabularnewline
26 & 107.6 & 107.049020210602 & 0.550979789397979 \tabularnewline
27 & 107.6 & 107.053016360964 & 0.546983639036463 \tabularnewline
28 & 107.7 & 107.114025022650 & 0.585974977349888 \tabularnewline
29 & 107.7 & 107.484053894939 & 0.2159461050613 \tabularnewline
30 & 107.7 & 107.205024060240 & 0.494975939759512 \tabularnewline
31 & 107.7 & 107.299029834698 & 0.400970165301796 \tabularnewline
32 & 107.6 & 107.287022135421 & 0.312977864578741 \tabularnewline
33 & 107.7 & 107.299010586506 & 0.400989413494189 \tabularnewline
34 & 107.9 & 107.565024060240 & 0.334975939759511 \tabularnewline
35 & 107.9 & 107.407002887229 & 0.492997112771146 \tabularnewline
36 & 107.9 & 107.508011548915 & 0.39198845108457 \tabularnewline
37 & 107.8 & 107.602624240736 & 0.197375759263615 \tabularnewline
38 & 107.6 & 107.689218967578 & -0.0892189675777174 \tabularnewline
39 & 107.4 & 107.828229554084 & -0.428229554083523 \tabularnewline
40 & 107 & 107.484194907337 & -0.484194907337222 \tabularnewline
41 & 107 & 107.269161223001 & -0.269161223000531 \tabularnewline
42 & 107.2 & 107.440179508783 & -0.240179508783302 \tabularnewline
43 & 107.5 & 107.444175659145 & 0.0558243408551718 \tabularnewline
44 & 107.8 & 107.567182396012 & 0.232817603987833 \tabularnewline
45 & 107.8 & 107.714185283241 & 0.0858147167589736 \tabularnewline
46 & 107.7 & 107.440141012399 & 0.259858987601482 \tabularnewline
47 & 107.6 & 107.642158335772 & -0.0421583357716794 \tabularnewline
48 & 107.6 & 107.878181433603 & -0.278181433602549 \tabularnewline
49 & 107.5 & 107.792774877231 & -0.292774877231100 \tabularnewline
50 & 107.5 & 107.654345543832 & -0.154345543831937 \tabularnewline
51 & 107.6 & 107.478322446001 & 0.121677553998932 \tabularnewline
52 & 107.6 & 107.629340731784 & -0.0293407317838436 \tabularnewline
53 & 107.9 & 107.774345543832 & 0.125654456168065 \tabularnewline
54 & 107.6 & 107.58532533323 & 0.0146746667700741 \tabularnewline
55 & 107.5 & 107.634326295640 & -0.134326295639540 \tabularnewline
56 & 107.5 & 107.622318596363 & -0.122318596362581 \tabularnewline
57 & 107.6 & 107.634307047447 & -0.0343070474471519 \tabularnewline
58 & 107.7 & 108.125344581422 & -0.425344581422318 \tabularnewline
59 & 107.8 & 108.102337844555 & -0.302337844554983 \tabularnewline
60 & 107.9 & 107.933317633953 & -0.0333176339529607 \tabularnewline
61 & 107.9 & 107.892915889630 & 0.00708411037038624 \tabularnewline
\hline
\end{tabular}
%Source: https://freestatistics.org/blog/index.php?pk=58121&T=4

[TABLE]
[ROW][C]Multiple Linear Regression - Actuals, Interpolation, and Residuals[/C][/ROW]
[ROW][C]Time or Index[/C][C]Actuals[/C][C]InterpolationForecast[/C][C]ResidualsPrediction Error[/C][/ROW]
[ROW][C]1[/C][C]105.4[/C][C]105.637023157761[/C][C]-0.237023157761039[/C][/ROW]
[ROW][C]2[/C][C]105.4[/C][C]105.723617884603[/C][C]-0.323617884602509[/C][/ROW]
[ROW][C]3[/C][C]105.6[/C][C]105.907633283156[/C][C]-0.307633283156431[/C][/ROW]
[ROW][C]4[/C][C]105.7[/C][C]105.56359863641[/C][C]0.136401363589883[/C][/ROW]
[ROW][C]5[/C][C]105.8[/C][C]105.573589012314[/C][C]0.226410987686070[/C][/ROW]
[ROW][C]6[/C][C]105.8[/C][C]105.609592861952[/C][C]0.190407138047597[/C][/ROW]
[ROW][C]7[/C][C]105.8[/C][C]105.748603448458[/C][C]0.0513965515417788[/C][/ROW]
[ROW][C]8[/C][C]105.9[/C][C]105.961619809422[/C][C]-0.0616198094217461[/C][/ROW]
[ROW][C]9[/C][C]106.1[/C][C]106.288641944843[/C][C]-0.188641944843008[/C][/ROW]
[ROW][C]10[/C][C]106.4[/C][C]106.419640982433[/C][C]-0.0196409824333840[/C][/ROW]
[ROW][C]11[/C][C]106.4[/C][C]106.486643869662[/C][C]-0.0866438696622418[/C][/ROW]
[ROW][C]12[/C][C]106.3[/C][C]106.452638095205[/C][C]-0.152638095204531[/C][/ROW]
[ROW][C]13[/C][C]106.2[/C][C]106.142207478593[/C][C]0.0577925214074108[/C][/ROW]
[ROW][C]14[/C][C]106.2[/C][C]106.183797393386[/C][C]0.0162026066141837[/C][/ROW]
[ROW][C]15[/C][C]106.3[/C][C]106.232798355795[/C][C]0.0672016442045595[/C][/ROW]
[ROW][C]16[/C][C]106.4[/C][C]106.608840701819[/C][C]-0.208840701818706[/C][/ROW]
[ROW][C]17[/C][C]106.5[/C][C]106.798850325915[/C][C]-0.298850325914904[/C][/ROW]
[ROW][C]18[/C][C]106.6[/C][C]107.059878235794[/C][C]-0.459878235793881[/C][/ROW]
[ROW][C]19[/C][C]106.6[/C][C]106.973864762059[/C][C]-0.373864762059206[/C][/ROW]
[ROW][C]20[/C][C]106.6[/C][C]106.961857062782[/C][C]-0.361857062782248[/C][/ROW]
[ROW][C]21[/C][C]106.8[/C][C]107.063855137963[/C][C]-0.263855137963003[/C][/ROW]
[ROW][C]22[/C][C]107[/C][C]107.149849363505[/C][C]-0.149849363505291[/C][/ROW]
[ROW][C]23[/C][C]107.2[/C][C]107.261857062782[/C][C]-0.0618570627822418[/C][/ROW]
[ROW][C]24[/C][C]107.3[/C][C]107.227851288325[/C][C]0.0721487116754713[/C][/ROW]
[ROW][C]25[/C][C]107.5[/C][C]107.232454356049[/C][C]0.267545643950726[/C][/ROW]
[ROW][C]26[/C][C]107.6[/C][C]107.049020210602[/C][C]0.550979789397979[/C][/ROW]
[ROW][C]27[/C][C]107.6[/C][C]107.053016360964[/C][C]0.546983639036463[/C][/ROW]
[ROW][C]28[/C][C]107.7[/C][C]107.114025022650[/C][C]0.585974977349888[/C][/ROW]
[ROW][C]29[/C][C]107.7[/C][C]107.484053894939[/C][C]0.2159461050613[/C][/ROW]
[ROW][C]30[/C][C]107.7[/C][C]107.205024060240[/C][C]0.494975939759512[/C][/ROW]
[ROW][C]31[/C][C]107.7[/C][C]107.299029834698[/C][C]0.400970165301796[/C][/ROW]
[ROW][C]32[/C][C]107.6[/C][C]107.287022135421[/C][C]0.312977864578741[/C][/ROW]
[ROW][C]33[/C][C]107.7[/C][C]107.299010586506[/C][C]0.400989413494189[/C][/ROW]
[ROW][C]34[/C][C]107.9[/C][C]107.565024060240[/C][C]0.334975939759511[/C][/ROW]
[ROW][C]35[/C][C]107.9[/C][C]107.407002887229[/C][C]0.492997112771146[/C][/ROW]
[ROW][C]36[/C][C]107.9[/C][C]107.508011548915[/C][C]0.39198845108457[/C][/ROW]
[ROW][C]37[/C][C]107.8[/C][C]107.602624240736[/C][C]0.197375759263615[/C][/ROW]
[ROW][C]38[/C][C]107.6[/C][C]107.689218967578[/C][C]-0.0892189675777174[/C][/ROW]
[ROW][C]39[/C][C]107.4[/C][C]107.828229554084[/C][C]-0.428229554083523[/C][/ROW]
[ROW][C]40[/C][C]107[/C][C]107.484194907337[/C][C]-0.484194907337222[/C][/ROW]
[ROW][C]41[/C][C]107[/C][C]107.269161223001[/C][C]-0.269161223000531[/C][/ROW]
[ROW][C]42[/C][C]107.2[/C][C]107.440179508783[/C][C]-0.240179508783302[/C][/ROW]
[ROW][C]43[/C][C]107.5[/C][C]107.444175659145[/C][C]0.0558243408551718[/C][/ROW]
[ROW][C]44[/C][C]107.8[/C][C]107.567182396012[/C][C]0.232817603987833[/C][/ROW]
[ROW][C]45[/C][C]107.8[/C][C]107.714185283241[/C][C]0.0858147167589736[/C][/ROW]
[ROW][C]46[/C][C]107.7[/C][C]107.440141012399[/C][C]0.259858987601482[/C][/ROW]
[ROW][C]47[/C][C]107.6[/C][C]107.642158335772[/C][C]-0.0421583357716794[/C][/ROW]
[ROW][C]48[/C][C]107.6[/C][C]107.878181433603[/C][C]-0.278181433602549[/C][/ROW]
[ROW][C]49[/C][C]107.5[/C][C]107.792774877231[/C][C]-0.292774877231100[/C][/ROW]
[ROW][C]50[/C][C]107.5[/C][C]107.654345543832[/C][C]-0.154345543831937[/C][/ROW]
[ROW][C]51[/C][C]107.6[/C][C]107.478322446001[/C][C]0.121677553998932[/C][/ROW]
[ROW][C]52[/C][C]107.6[/C][C]107.629340731784[/C][C]-0.0293407317838436[/C][/ROW]
[ROW][C]53[/C][C]107.9[/C][C]107.774345543832[/C][C]0.125654456168065[/C][/ROW]
[ROW][C]54[/C][C]107.6[/C][C]107.58532533323[/C][C]0.0146746667700741[/C][/ROW]
[ROW][C]55[/C][C]107.5[/C][C]107.634326295640[/C][C]-0.134326295639540[/C][/ROW]
[ROW][C]56[/C][C]107.5[/C][C]107.622318596363[/C][C]-0.122318596362581[/C][/ROW]
[ROW][C]57[/C][C]107.6[/C][C]107.634307047447[/C][C]-0.0343070474471519[/C][/ROW]
[ROW][C]58[/C][C]107.7[/C][C]108.125344581422[/C][C]-0.425344581422318[/C][/ROW]
[ROW][C]59[/C][C]107.8[/C][C]108.102337844555[/C][C]-0.302337844554983[/C][/ROW]
[ROW][C]60[/C][C]107.9[/C][C]107.933317633953[/C][C]-0.0333176339529607[/C][/ROW]
[ROW][C]61[/C][C]107.9[/C][C]107.892915889630[/C][C]0.00708411037038624[/C][/ROW]
[/TABLE]
Source: https://freestatistics.org/blog/index.php?pk=58121&T=4

Globally Unique Identifier (entire table): ba.freestatistics.org/blog/index.php?pk=58121&T=4

As an alternative you can also use a QR Code:  

The GUIDs for individual cells are displayed in the table below:

Multiple Linear Regression - Actuals, Interpolation, and Residuals
Time or IndexActualsInterpolationForecastResidualsPrediction Error
1105.4105.637023157761-0.237023157761039
2105.4105.723617884603-0.323617884602509
3105.6105.907633283156-0.307633283156431
4105.7105.563598636410.136401363589883
5105.8105.5735890123140.226410987686070
6105.8105.6095928619520.190407138047597
7105.8105.7486034484580.0513965515417788
8105.9105.961619809422-0.0616198094217461
9106.1106.288641944843-0.188641944843008
10106.4106.419640982433-0.0196409824333840
11106.4106.486643869662-0.0866438696622418
12106.3106.452638095205-0.152638095204531
13106.2106.1422074785930.0577925214074108
14106.2106.1837973933860.0162026066141837
15106.3106.2327983557950.0672016442045595
16106.4106.608840701819-0.208840701818706
17106.5106.798850325915-0.298850325914904
18106.6107.059878235794-0.459878235793881
19106.6106.973864762059-0.373864762059206
20106.6106.961857062782-0.361857062782248
21106.8107.063855137963-0.263855137963003
22107107.149849363505-0.149849363505291
23107.2107.261857062782-0.0618570627822418
24107.3107.2278512883250.0721487116754713
25107.5107.2324543560490.267545643950726
26107.6107.0490202106020.550979789397979
27107.6107.0530163609640.546983639036463
28107.7107.1140250226500.585974977349888
29107.7107.4840538949390.2159461050613
30107.7107.2050240602400.494975939759512
31107.7107.2990298346980.400970165301796
32107.6107.2870221354210.312977864578741
33107.7107.2990105865060.400989413494189
34107.9107.5650240602400.334975939759511
35107.9107.4070028872290.492997112771146
36107.9107.5080115489150.39198845108457
37107.8107.6026242407360.197375759263615
38107.6107.689218967578-0.0892189675777174
39107.4107.828229554084-0.428229554083523
40107107.484194907337-0.484194907337222
41107107.269161223001-0.269161223000531
42107.2107.440179508783-0.240179508783302
43107.5107.4441756591450.0558243408551718
44107.8107.5671823960120.232817603987833
45107.8107.7141852832410.0858147167589736
46107.7107.4401410123990.259858987601482
47107.6107.642158335772-0.0421583357716794
48107.6107.878181433603-0.278181433602549
49107.5107.792774877231-0.292774877231100
50107.5107.654345543832-0.154345543831937
51107.6107.4783224460010.121677553998932
52107.6107.629340731784-0.0293407317838436
53107.9107.7743455438320.125654456168065
54107.6107.585325333230.0146746667700741
55107.5107.634326295640-0.134326295639540
56107.5107.622318596363-0.122318596362581
57107.6107.634307047447-0.0343070474471519
58107.7108.125344581422-0.425344581422318
59107.8108.102337844555-0.302337844554983
60107.9107.933317633953-0.0333176339529607
61107.9107.8929158896300.00708411037038624


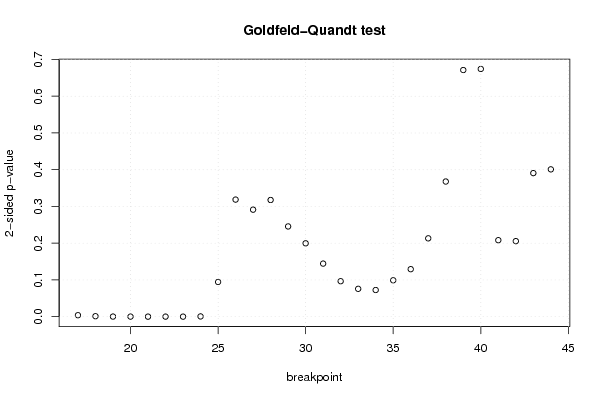
Goldfeld-Quandt test for Heteroskedasticity
p-valuesAlternative Hypothesis
breakpoint indexgreater2-sidedless
170.001984641674128970.003969283348257940.998015358325871
180.0006175765023720920.001235153004744180.999382423497628
190.0001256030394151030.0002512060788302060.999874396960585
203.82999762714609e-057.65999525429218e-050.999961700023729
211.26262254317022e-052.52524508634043e-050.999987373774568
223.25860107899585e-056.5172021579917e-050.99996741398921
231.61640286269508e-053.23280572539016e-050.999983835971373
240.0003301995040447060.0006603990080894120.999669800495955
250.04720129811359540.09440259622719070.952798701886405
260.1593153920886510.3186307841773010.84068460791135
270.1455921633325550.2911843266651100.854407836667445
280.1587733723094550.3175467446189090.841226627690545
290.1227929733767060.2455859467534130.877207026623294
300.09980579293541750.1996115858708350.900194207064583
310.07219783023148570.1443956604629710.927802169768514
320.04823643571799430.09647287143598860.951763564282006
330.03788713037963070.07577426075926140.96211286962037
340.03627053518061090.07254107036122180.96372946481939
350.04951489746971720.09902979493943450.950485102530283
360.06462745187801780.1292549037560360.935372548121982
370.106592736410530.213185472821060.89340726358947
380.1838952023705190.3677904047410370.816104797629482
390.3355919865722720.6711839731445440.664408013427728
400.6629110440702560.6741779118594890.337088955929744
410.8959434020097350.2081131959805290.104056597990265
420.8972218595865570.2055562808268860.102778140413443
430.8046569572082860.3906860855834290.195343042791714
440.7995291334743070.4009417330513860.200470866525693

\begin{tabular}{lllllllll}
\hline
Goldfeld-Quandt test for Heteroskedasticity \tabularnewline
p-values & Alternative Hypothesis \tabularnewline
breakpoint index & greater & 2-sided & less \tabularnewline
17 & 0.00198464167412897 & 0.00396928334825794 & 0.998015358325871 \tabularnewline
18 & 0.000617576502372092 & 0.00123515300474418 & 0.999382423497628 \tabularnewline
19 & 0.000125603039415103 & 0.000251206078830206 & 0.999874396960585 \tabularnewline
20 & 3.82999762714609e-05 & 7.65999525429218e-05 & 0.999961700023729 \tabularnewline
21 & 1.26262254317022e-05 & 2.52524508634043e-05 & 0.999987373774568 \tabularnewline
22 & 3.25860107899585e-05 & 6.5172021579917e-05 & 0.99996741398921 \tabularnewline
23 & 1.61640286269508e-05 & 3.23280572539016e-05 & 0.999983835971373 \tabularnewline
24 & 0.000330199504044706 & 0.000660399008089412 & 0.999669800495955 \tabularnewline
25 & 0.0472012981135954 & 0.0944025962271907 & 0.952798701886405 \tabularnewline
26 & 0.159315392088651 & 0.318630784177301 & 0.84068460791135 \tabularnewline
27 & 0.145592163332555 & 0.291184326665110 & 0.854407836667445 \tabularnewline
28 & 0.158773372309455 & 0.317546744618909 & 0.841226627690545 \tabularnewline
29 & 0.122792973376706 & 0.245585946753413 & 0.877207026623294 \tabularnewline
30 & 0.0998057929354175 & 0.199611585870835 & 0.900194207064583 \tabularnewline
31 & 0.0721978302314857 & 0.144395660462971 & 0.927802169768514 \tabularnewline
32 & 0.0482364357179943 & 0.0964728714359886 & 0.951763564282006 \tabularnewline
33 & 0.0378871303796307 & 0.0757742607592614 & 0.96211286962037 \tabularnewline
34 & 0.0362705351806109 & 0.0725410703612218 & 0.96372946481939 \tabularnewline
35 & 0.0495148974697172 & 0.0990297949394345 & 0.950485102530283 \tabularnewline
36 & 0.0646274518780178 & 0.129254903756036 & 0.935372548121982 \tabularnewline
37 & 0.10659273641053 & 0.21318547282106 & 0.89340726358947 \tabularnewline
38 & 0.183895202370519 & 0.367790404741037 & 0.816104797629482 \tabularnewline
39 & 0.335591986572272 & 0.671183973144544 & 0.664408013427728 \tabularnewline
40 & 0.662911044070256 & 0.674177911859489 & 0.337088955929744 \tabularnewline
41 & 0.895943402009735 & 0.208113195980529 & 0.104056597990265 \tabularnewline
42 & 0.897221859586557 & 0.205556280826886 & 0.102778140413443 \tabularnewline
43 & 0.804656957208286 & 0.390686085583429 & 0.195343042791714 \tabularnewline
44 & 0.799529133474307 & 0.400941733051386 & 0.200470866525693 \tabularnewline
\hline
\end{tabular}
%Source: https://freestatistics.org/blog/index.php?pk=58121&T=5

[TABLE]
[ROW][C]Goldfeld-Quandt test for Heteroskedasticity[/C][/ROW]
[ROW][C]p-values[/C][C]Alternative Hypothesis[/C][/ROW]
[ROW][C]breakpoint index[/C][C]greater[/C][C]2-sided[/C][C]less[/C][/ROW]
[ROW][C]17[/C][C]0.00198464167412897[/C][C]0.00396928334825794[/C][C]0.998015358325871[/C][/ROW]
[ROW][C]18[/C][C]0.000617576502372092[/C][C]0.00123515300474418[/C][C]0.999382423497628[/C][/ROW]
[ROW][C]19[/C][C]0.000125603039415103[/C][C]0.000251206078830206[/C][C]0.999874396960585[/C][/ROW]
[ROW][C]20[/C][C]3.82999762714609e-05[/C][C]7.65999525429218e-05[/C][C]0.999961700023729[/C][/ROW]
[ROW][C]21[/C][C]1.26262254317022e-05[/C][C]2.52524508634043e-05[/C][C]0.999987373774568[/C][/ROW]
[ROW][C]22[/C][C]3.25860107899585e-05[/C][C]6.5172021579917e-05[/C][C]0.99996741398921[/C][/ROW]
[ROW][C]23[/C][C]1.61640286269508e-05[/C][C]3.23280572539016e-05[/C][C]0.999983835971373[/C][/ROW]
[ROW][C]24[/C][C]0.000330199504044706[/C][C]0.000660399008089412[/C][C]0.999669800495955[/C][/ROW]
[ROW][C]25[/C][C]0.0472012981135954[/C][C]0.0944025962271907[/C][C]0.952798701886405[/C][/ROW]
[ROW][C]26[/C][C]0.159315392088651[/C][C]0.318630784177301[/C][C]0.84068460791135[/C][/ROW]
[ROW][C]27[/C][C]0.145592163332555[/C][C]0.291184326665110[/C][C]0.854407836667445[/C][/ROW]
[ROW][C]28[/C][C]0.158773372309455[/C][C]0.317546744618909[/C][C]0.841226627690545[/C][/ROW]
[ROW][C]29[/C][C]0.122792973376706[/C][C]0.245585946753413[/C][C]0.877207026623294[/C][/ROW]
[ROW][C]30[/C][C]0.0998057929354175[/C][C]0.199611585870835[/C][C]0.900194207064583[/C][/ROW]
[ROW][C]31[/C][C]0.0721978302314857[/C][C]0.144395660462971[/C][C]0.927802169768514[/C][/ROW]
[ROW][C]32[/C][C]0.0482364357179943[/C][C]0.0964728714359886[/C][C]0.951763564282006[/C][/ROW]
[ROW][C]33[/C][C]0.0378871303796307[/C][C]0.0757742607592614[/C][C]0.96211286962037[/C][/ROW]
[ROW][C]34[/C][C]0.0362705351806109[/C][C]0.0725410703612218[/C][C]0.96372946481939[/C][/ROW]
[ROW][C]35[/C][C]0.0495148974697172[/C][C]0.0990297949394345[/C][C]0.950485102530283[/C][/ROW]
[ROW][C]36[/C][C]0.0646274518780178[/C][C]0.129254903756036[/C][C]0.935372548121982[/C][/ROW]
[ROW][C]37[/C][C]0.10659273641053[/C][C]0.21318547282106[/C][C]0.89340726358947[/C][/ROW]
[ROW][C]38[/C][C]0.183895202370519[/C][C]0.367790404741037[/C][C]0.816104797629482[/C][/ROW]
[ROW][C]39[/C][C]0.335591986572272[/C][C]0.671183973144544[/C][C]0.664408013427728[/C][/ROW]
[ROW][C]40[/C][C]0.662911044070256[/C][C]0.674177911859489[/C][C]0.337088955929744[/C][/ROW]
[ROW][C]41[/C][C]0.895943402009735[/C][C]0.208113195980529[/C][C]0.104056597990265[/C][/ROW]
[ROW][C]42[/C][C]0.897221859586557[/C][C]0.205556280826886[/C][C]0.102778140413443[/C][/ROW]
[ROW][C]43[/C][C]0.804656957208286[/C][C]0.390686085583429[/C][C]0.195343042791714[/C][/ROW]
[ROW][C]44[/C][C]0.799529133474307[/C][C]0.400941733051386[/C][C]0.200470866525693[/C][/ROW]
[/TABLE]
Source: https://freestatistics.org/blog/index.php?pk=58121&T=5

Globally Unique Identifier (entire table): ba.freestatistics.org/blog/index.php?pk=58121&T=5

As an alternative you can also use a QR Code:  

The GUIDs for individual cells are displayed in the table below:

Goldfeld-Quandt test for Heteroskedasticity
p-valuesAlternative Hypothesis
breakpoint indexgreater2-sidedless
170.001984641674128970.003969283348257940.998015358325871
180.0006175765023720920.001235153004744180.999382423497628
190.0001256030394151030.0002512060788302060.999874396960585
203.82999762714609e-057.65999525429218e-050.999961700023729
211.26262254317022e-052.52524508634043e-050.999987373774568
223.25860107899585e-056.5172021579917e-050.99996741398921
231.61640286269508e-053.23280572539016e-050.999983835971373
240.0003301995040447060.0006603990080894120.999669800495955
250.04720129811359540.09440259622719070.952798701886405
260.1593153920886510.3186307841773010.84068460791135
270.1455921633325550.2911843266651100.854407836667445
280.1587733723094550.3175467446189090.841226627690545
290.1227929733767060.2455859467534130.877207026623294
300.09980579293541750.1996115858708350.900194207064583
310.07219783023148570.1443956604629710.927802169768514
320.04823643571799430.09647287143598860.951763564282006
330.03788713037963070.07577426075926140.96211286962037
340.03627053518061090.07254107036122180.96372946481939
350.04951489746971720.09902979493943450.950485102530283
360.06462745187801780.1292549037560360.935372548121982
370.106592736410530.213185472821060.89340726358947
380.1838952023705190.3677904047410370.816104797629482
390.3355919865722720.6711839731445440.664408013427728
400.6629110440702560.6741779118594890.337088955929744
410.8959434020097350.2081131959805290.104056597990265
420.8972218595865570.2055562808268860.102778140413443
430.8046569572082860.3906860855834290.195343042791714
440.7995291334743070.4009417330513860.200470866525693


Meta Analysis of Goldfeld-Quandt test for Heteroskedasticity
Description# significant tests% significant testsOK/NOK
1% type I error level80.285714285714286NOK
5% type I error level80.285714285714286NOK
10% type I error level130.464285714285714NOK

\begin{tabular}{lllllllll}
\hline
Meta Analysis of Goldfeld-Quandt test for Heteroskedasticity \tabularnewline
Description & # significant tests & % significant tests & OK/NOK \tabularnewline
1% type I error level & 8 & 0.285714285714286 & NOK \tabularnewline
5% type I error level & 8 & 0.285714285714286 & NOK \tabularnewline
10% type I error level & 13 & 0.464285714285714 & NOK \tabularnewline
\hline
\end{tabular}
%Source: https://freestatistics.org/blog/index.php?pk=58121&T=6

[TABLE]
[ROW][C]Meta Analysis of Goldfeld-Quandt test for Heteroskedasticity[/C][/ROW]
[ROW][C]Description[/C][C]# significant tests[/C][C]% significant tests[/C][C]OK/NOK[/C][/ROW]
[ROW][C]1% type I error level[/C][C]8[/C][C]0.285714285714286[/C][C]NOK[/C][/ROW]
[ROW][C]5% type I error level[/C][C]8[/C][C]0.285714285714286[/C][C]NOK[/C][/ROW]
[ROW][C]10% type I error level[/C][C]13[/C][C]0.464285714285714[/C][C]NOK[/C][/ROW]
[/TABLE]
Source: https://freestatistics.org/blog/index.php?pk=58121&T=6

Globally Unique Identifier (entire table): ba.freestatistics.org/blog/index.php?pk=58121&T=6

As an alternative you can also use a QR Code:  

The GUIDs for individual cells are displayed in the table below:

Meta Analysis of Goldfeld-Quandt test for Heteroskedasticity
Description# significant tests% significant testsOK/NOK
1% type I error level80.285714285714286NOK
5% type I error level80.285714285714286NOK
10% type I error level130.464285714285714NOK


Parameters (Session):
par1 = 1 ; par2 = Include Monthly Dummies ; par3 = Linear Trend ;
Parameters (R input):
par1 = 1 ; par2 = Include Monthly Dummies ; par3 = Linear Trend ;
R code (references can be found in the software module):
library(lattice)
library(lmtest)
n25 <- 25 #minimum number of obs. for Goldfeld-Quandt test
par1 <- as.numeric(par1)
x <- t(y)
k <- length(x[1,])
n <- length(x[,1])
x1 <- cbind(x[,par1], x[,1:k!=par1])
mycolnames <- c(colnames(x)[par1], colnames(x)[1:k!=par1])
colnames(x1) <- mycolnames #colnames(x)[par1]
x <- x1
if (par3 == 'First Differences'){
x2 <- array(0, dim=c(n-1,k), dimnames=list(1:(n-1), paste('(1-B)',colnames(x),sep='')))
for (i in 1:n-1) {
for (j in 1:k) {
x2[i,j] <- x[i+1,j] - x[i,j]
}
}
x <- x2
}
if (par2 == 'Include Monthly Dummies'){
x2 <- array(0, dim=c(n,11), dimnames=list(1:n, paste('M', seq(1:11), sep ='')))
for (i in 1:11){
x2[seq(i,n,12),i] <- 1
}
x <- cbind(x, x2)
}
if (par2 == 'Include Quarterly Dummies'){
x2 <- array(0, dim=c(n,3), dimnames=list(1:n, paste('Q', seq(1:3), sep ='')))
for (i in 1:3){
x2[seq(i,n,4),i] <- 1
}
x <- cbind(x, x2)
}
k <- length(x[1,])
if (par3 == 'Linear Trend'){
x <- cbind(x, c(1:n))
colnames(x)[k+1] <- 't'
}
x
k <- length(x[1,])
df <- as.data.frame(x)
(mylm <- lm(df))
(mysum <- summary(mylm))
if (n > n25) {
kp3 <- k + 3
nmkm3 <- n - k - 3
gqarr <- array(NA, dim=c(nmkm3-kp3+1,3))
numgqtests <- 0
numsignificant1 <- 0
numsignificant5 <- 0
numsignificant10 <- 0
for (mypoint in kp3:nmkm3) {
j <- 0
numgqtests <- numgqtests + 1
for (myalt in c('greater', 'two.sided', 'less')) {
j <- j + 1
gqarr[mypoint-kp3+1,j] <- gqtest(mylm, point=mypoint, alternative=myalt)$p.value
}
if (gqarr[mypoint-kp3+1,2] < 0.01) numsignificant1 <- numsignificant1 + 1
if (gqarr[mypoint-kp3+1,2] < 0.05) numsignificant5 <- numsignificant5 + 1
if (gqarr[mypoint-kp3+1,2] < 0.10) numsignificant10 <- numsignificant10 + 1
}
gqarr
}
bitmap(file='test0.png')
plot(x[,1], type='l', main='Actuals and Interpolation', ylab='value of Actuals and Interpolation (dots)', xlab='time or index')
points(x[,1]-mysum$resid)
grid()
dev.off()
bitmap(file='test1.png')
plot(mysum$resid, type='b', pch=19, main='Residuals', ylab='value of Residuals', xlab='time or index')
grid()
dev.off()
bitmap(file='test2.png')
hist(mysum$resid, main='Residual Histogram', xlab='values of Residuals')
grid()
dev.off()
bitmap(file='test3.png')
densityplot(~mysum$resid,col='black',main='Residual Density Plot', xlab='values of Residuals')
dev.off()
bitmap(file='test4.png')
qqnorm(mysum$resid, main='Residual Normal Q-Q Plot')
qqline(mysum$resid)
grid()
dev.off()
(myerror <- as.ts(mysum$resid))
bitmap(file='test5.png')
dum <- cbind(lag(myerror,k=1),myerror)
dum
dum1 <- dum[2:length(myerror),]
dum1
z <- as.data.frame(dum1)
z
plot(z,main=paste('Residual Lag plot, lowess, and regression line'), ylab='values of Residuals', xlab='lagged values of Residuals')
lines(lowess(z))
abline(lm(z))
grid()
dev.off()
bitmap(file='test6.png')
acf(mysum$resid, lag.max=length(mysum$resid)/2, main='Residual Autocorrelation Function')
grid()
dev.off()
bitmap(file='test7.png')
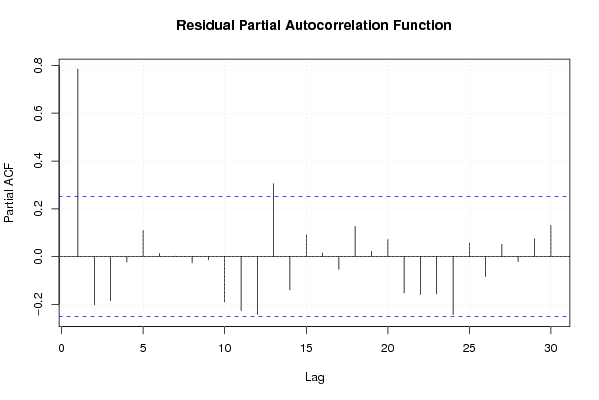
pacf(mysum$resid, lag.max=length(mysum$resid)/2, main='Residual Partial Autocorrelation Function')
grid()
dev.off()
bitmap(file='test8.png')
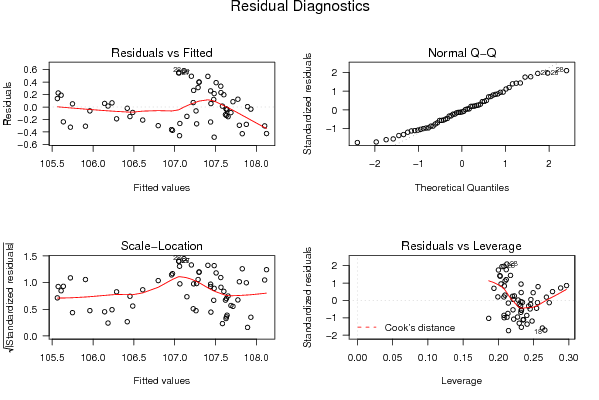
opar <- par(mfrow = c(2,2), oma = c(0, 0, 1.1, 0))
plot(mylm, las = 1, sub='Residual Diagnostics')
par(opar)
dev.off()
if (n > n25) {
bitmap(file='test9.png')
plot(kp3:nmkm3,gqarr[,2], main='Goldfeld-Quandt test',ylab='2-sided p-value',xlab='breakpoint')
grid()
dev.off()
}
load(file='createtable')
a<-table.start()
a<-table.row.start(a)
a<-table.element(a, 'Multiple Linear Regression - Estimated Regression Equation', 1, TRUE)
a<-table.row.end(a)
myeq <- colnames(x)[1]
myeq <- paste(myeq, '[t] = ', sep='')
for (i in 1:k){
if (mysum$coefficients[i,1] > 0) myeq <- paste(myeq, '+', '')
myeq <- paste(myeq, mysum$coefficients[i,1], sep=' ')
if (rownames(mysum$coefficients)[i] != '(Intercept)') {
myeq <- paste(myeq, rownames(mysum$coefficients)[i], sep='')
if (rownames(mysum$coefficients)[i] != 't') myeq <- paste(myeq, '[t]', sep='')
}
}
myeq <- paste(myeq, ' + e[t]')
a<-table.row.start(a)
a<-table.element(a, myeq)
a<-table.row.end(a)
a<-table.end(a)
table.save(a,file='mytable1.tab')
a<-table.start()
a<-table.row.start(a)
a<-table.element(a,hyperlink('ols1.htm','Multiple Linear Regression - Ordinary Least Squares',''), 6, TRUE)
a<-table.row.end(a)
a<-table.row.start(a)
a<-table.element(a,'Variable',header=TRUE)
a<-table.element(a,'Parameter',header=TRUE)
a<-table.element(a,'S.D.',header=TRUE)
a<-table.element(a,'T-STAT
H0: parameter = 0',header=TRUE)
a<-table.element(a,'2-tail p-value',header=TRUE)
a<-table.element(a,'1-tail p-value',header=TRUE)
a<-table.row.end(a)
for (i in 1:k){
a<-table.row.start(a)
a<-table.element(a,rownames(mysum$coefficients)[i],header=TRUE)
a<-table.element(a,mysum$coefficients[i,1])
a<-table.element(a, round(mysum$coefficients[i,2],6))
a<-table.element(a, round(mysum$coefficients[i,3],4))
a<-table.element(a, round(mysum$coefficients[i,4],6))
a<-table.element(a, round(mysum$coefficients[i,4]/2,6))
a<-table.row.end(a)
}
a<-table.end(a)
table.save(a,file='mytable2.tab')
a<-table.start()
a<-table.row.start(a)
a<-table.element(a, 'Multiple Linear Regression - Regression Statistics', 2, TRUE)
a<-table.row.end(a)
a<-table.row.start(a)
a<-table.element(a, 'Multiple R',1,TRUE)
a<-table.element(a, sqrt(mysum$r.squared))
a<-table.row.end(a)
a<-table.row.start(a)
a<-table.element(a, 'R-squared',1,TRUE)
a<-table.element(a, mysum$r.squared)
a<-table.row.end(a)
a<-table.row.start(a)
a<-table.element(a, 'Adjusted R-squared',1,TRUE)
a<-table.element(a, mysum$adj.r.squared)
a<-table.row.end(a)
a<-table.row.start(a)
a<-table.element(a, 'F-TEST (value)',1,TRUE)
a<-table.element(a, mysum$fstatistic[1])
a<-table.row.end(a)
a<-table.row.start(a)
a<-table.element(a, 'F-TEST (DF numerator)',1,TRUE)
a<-table.element(a, mysum$fstatistic[2])
a<-table.row.end(a)
a<-table.row.start(a)
a<-table.element(a, 'F-TEST (DF denominator)',1,TRUE)
a<-table.element(a, mysum$fstatistic[3])
a<-table.row.end(a)
a<-table.row.start(a)
a<-table.element(a, 'p-value',1,TRUE)
a<-table.element(a, 1-pf(mysum$fstatistic[1],mysum$fstatistic[2],mysum$fstatistic[3]))
a<-table.row.end(a)
a<-table.row.start(a)
a<-table.element(a, 'Multiple Linear Regression - Residual Statistics', 2, TRUE)
a<-table.row.end(a)
a<-table.row.start(a)
a<-table.element(a, 'Residual Standard Deviation',1,TRUE)
a<-table.element(a, mysum$sigma)
a<-table.row.end(a)
a<-table.row.start(a)
a<-table.element(a, 'Sum Squared Residuals',1,TRUE)
a<-table.element(a, sum(myerror*myerror))
a<-table.row.end(a)
a<-table.end(a)
table.save(a,file='mytable3.tab')
a<-table.start()
a<-table.row.start(a)
a<-table.element(a, 'Multiple Linear Regression - Actuals, Interpolation, and Residuals', 4, TRUE)
a<-table.row.end(a)
a<-table.row.start(a)
a<-table.element(a, 'Time or Index', 1, TRUE)
a<-table.element(a, 'Actuals', 1, TRUE)
a<-table.element(a, 'Interpolation
Forecast', 1, TRUE)
a<-table.element(a, 'Residuals
Prediction Error', 1, TRUE)
a<-table.row.end(a)
for (i in 1:n) {
a<-table.row.start(a)
a<-table.element(a,i, 1, TRUE)
a<-table.element(a,x[i])
a<-table.element(a,x[i]-mysum$resid[i])
a<-table.element(a,mysum$resid[i])
a<-table.row.end(a)
}
a<-table.end(a)
table.save(a,file='mytable4.tab')
if (n > n25) {
a<-table.start()
a<-table.row.start(a)
a<-table.element(a,'Goldfeld-Quandt test for Heteroskedasticity',4,TRUE)
a<-table.row.end(a)
a<-table.row.start(a)
a<-table.element(a,'p-values',header=TRUE)
a<-table.element(a,'Alternative Hypothesis',3,header=TRUE)
a<-table.row.end(a)
a<-table.row.start(a)
a<-table.element(a,'breakpoint index',header=TRUE)
a<-table.element(a,'greater',header=TRUE)
a<-table.element(a,'2-sided',header=TRUE)
a<-table.element(a,'less',header=TRUE)
a<-table.row.end(a)
for (mypoint in kp3:nmkm3) {
a<-table.row.start(a)
a<-table.element(a,mypoint,header=TRUE)
a<-table.element(a,gqarr[mypoint-kp3+1,1])
a<-table.element(a,gqarr[mypoint-kp3+1,2])
a<-table.element(a,gqarr[mypoint-kp3+1,3])
a<-table.row.end(a)
}
a<-table.end(a)
table.save(a,file='mytable5.tab')
a<-table.start()
a<-table.row.start(a)
a<-table.element(a,'Meta Analysis of Goldfeld-Quandt test for Heteroskedasticity',4,TRUE)
a<-table.row.end(a)
a<-table.row.start(a)
a<-table.element(a,'Description',header=TRUE)
a<-table.element(a,'# significant tests',header=TRUE)
a<-table.element(a,'% significant tests',header=TRUE)
a<-table.element(a,'OK/NOK',header=TRUE)
a<-table.row.end(a)
a<-table.row.start(a)
a<-table.element(a,'1% type I error level',header=TRUE)
a<-table.element(a,numsignificant1)
a<-table.element(a,numsignificant1/numgqtests)
if (numsignificant1/numgqtests < 0.01) dum <- 'OK' else dum <- 'NOK'
a<-table.element(a,dum)
a<-table.row.end(a)
a<-table.row.start(a)
a<-table.element(a,'5% type I error level',header=TRUE)
a<-table.element(a,numsignificant5)
a<-table.element(a,numsignificant5/numgqtests)
if (numsignificant5/numgqtests < 0.05) dum <- 'OK' else dum <- 'NOK'
a<-table.element(a,dum)
a<-table.row.end(a)
a<-table.row.start(a)
a<-table.element(a,'10% type I error level',header=TRUE)
a<-table.element(a,numsignificant10)
a<-table.element(a,numsignificant10/numgqtests)
if (numsignificant10/numgqtests < 0.1) dum <- 'OK' else dum <- 'NOK'
a<-table.element(a,dum)
a<-table.row.end(a)
a<-table.end(a)
table.save(a,file='mytable6.tab')
}