Free Statistics

of Irreproducible Research!

Author's title

Author*The author of this computation has been verified*
R Software Modulerwasp_multipleregression.wasp
Title produced by softwareMultiple Regression
Date of computationFri, 20 Nov 2009 12:45:00 -0700
Cite this page as followsStatistical Computations at FreeStatistics.org, Office for Research Development and Education, URL https://freestatistics.org/blog/index.php?v=date/2009/Nov/20/t12587464388qcxhiqe69i2yuf.htm/, Retrieved Fri, 26 Apr 2024 16:05:06 +0000
Statistical Computations at FreeStatistics.org, Office for Research Development and Education, URL https://freestatistics.org/blog/index.php?pk=58445, Retrieved Fri, 26 Apr 2024 16:05:06 +0000
QR Codes:

Original text written by user:
IsPrivate?No (this computation is public)
User-defined keywords
Estimated Impact129
Family? (F = Feedback message, R = changed R code, M = changed R Module, P = changed Parameters, D = changed Data)
-     [Multiple Regression] [Q1 The Seatbeltlaw] [2007-11-14 19:27:43] [8cd6641b921d30ebe00b648d1481bba0]
- RMPD  [Multiple Regression] [Seatbelt] [2009-11-12 14:03:14] [b98453cac15ba1066b407e146608df68]
-   PD      [Multiple Regression] [] [2009-11-20 19:45:00] [24029b2c7217429de6ff94b5379eb52c] [Current]
Feedback Forum

Post a new message
Dataseries X:
103.8		122.5		80.2		19
103.5		122.4		74.8		18
104.1		121.9		77.8		19
101.9		122.2		73		19
102		123.7		72		22
100.7		122.6		75.8		23
99		115.7		72.6		20
96.5		116.1		71.9		14
101.8		120.5		74.8		14
100.5		122.6		72.9		14
103.3		119.9		72.9		15
102.3		120.7		79.9		11
100.4		120.2		74		17
103		122.1		76		16
99		119.3		69.6		20
104.8		121.7		77.3		24
104.5		113.5		75.2		23
104.8		123.7		75.8		20
103.8		123.4		77.6		21
106.3		126.4		76.7		19
105.2		124.1		77		23
108.2		125.6		77.9		23
106.2		124.8		76.7		23
103.9		123		71.9		23
104.9		126.9		73.4		27
106.2		127.3		72.5		26
107.9		129		73.7		17
106.9		126.2		69.5		24
110.3		125.4		74.7		26
109.8		126.3		72.5		24
108.3		126.3		72.1		27
110.9		128.4		70.7		27
109.8		127.2		71.4		26
109.3		128.5		69.5		24
109		129		73.5		23
107.9		128.9		72.4		23
108.4		128.3		74.5		24
107.2		124.6		72.2		17
109.5		126.2		73		21
109.9		129.1		73.3		19
108		127.3		71.3		22
114.7		129.2		73.6		22
115.6		130.4		71.3		18
107.6		125.9		71.2		16
115.9		135.8		81.4		14
111.8		126.4		76.1		12
110		129.5		71.1		14
109.2		128.4		75.7		16
108		125.6		70		8
105.6		127.7		68.5		3
103		126.4		56.7		0
99.6		124.2		57.9		5
97.9		126.4		58.8		1
97.6		123.7		59.3		1
96.2		121.8		61.3		3
97.9		124		62.9		6
94.5		122.7		61.4		7
95.4		122.9		64.5		8
94.4		121		63.8		14
96.3		122.8		61.6		14
95.1		122.9		64.7		13


Summary of computational transaction
Raw Inputview raw input (R code)
Raw Outputview raw output of R engine
Computing time3 seconds
R Server'Gwilym Jenkins' @ 72.249.127.135
R Framework error message
Warning: there are blank lines in the 'Data X' field.
Please, use NA for missing data - blank lines are simply
 deleted and are NOT treated as missing values.

\begin{tabular}{lllllllll}
\hline
Summary of computational transaction \tabularnewline
Raw Input & view raw input (R code)  \tabularnewline
Raw Output & view raw output of R engine  \tabularnewline
Computing time & 3 seconds \tabularnewline
R Server & 'Gwilym Jenkins' @ 72.249.127.135 \tabularnewline
R Framework error message & 
Warning: there are blank lines in the 'Data X' field.
Please, use NA for missing data - blank lines are simply
 deleted and are NOT treated as missing values.
\tabularnewline \hline \end{tabular} %Source: https://freestatistics.org/blog/index.php?pk=58445&T=0

[TABLE]
[ROW][C]Summary of computational transaction[/C][/ROW]
[ROW][C]Raw Input[/C][C]view raw input (R code) [/C][/ROW]
[ROW][C]Raw Output[/C][C]view raw output of R engine [/C][/ROW]
[ROW][C]Computing time[/C][C]3 seconds[/C][/ROW]
[ROW][C]R Server[/C][C]'Gwilym Jenkins' @ 72.249.127.135[/C][/ROW]
[ROW][C]R Framework error message[/C][C]
Warning: there are blank lines in the 'Data X' field.
Please, use NA for missing data - blank lines are simply
 deleted and are NOT treated as missing values.
[/C][/ROW] [/TABLE] Source: https://freestatistics.org/blog/index.php?pk=58445&T=0

Globally Unique Identifier (entire table): ba.freestatistics.org/blog/index.php?pk=58445&T=0

As an alternative you can also use a QR Code:  

The GUIDs for individual cells are displayed in the table below:

Summary of computational transaction
Raw Inputview raw input (R code)
Raw Outputview raw output of R engine
Computing time3 seconds
R Server'Gwilym Jenkins' @ 72.249.127.135
R Framework error message
Warning: there are blank lines in the 'Data X' field.
Please, use NA for missing data - blank lines are simply
 deleted and are NOT treated as missing values.


Multiple Linear Regression - Estimated Regression Equation
dzcg[t] = + 86.4486262206775 + 0.820422117853948totid[t] -0.834444510665815ndzcg[t] + 0.270023243827998`indc `[t] + 0.436858127219093M1[t] -0.0399988870685178M2[t] -2.40677166640325M3[t] -2.95706963841343M4[t] -4.03836102042737M5[t] -2.09097820123675M6[t] -3.00419908854042M7[t] -1.78500969314317M8[t] + 0.899750191024355M9[t] -0.347689294709870M10[t] -1.28273233446154M11[t] + e[t]

\begin{tabular}{lllllllll}
\hline
Multiple Linear Regression - Estimated Regression Equation \tabularnewline
dzcg[t] =  +  86.4486262206775 +  0.820422117853948totid[t] -0.834444510665815ndzcg[t] +  0.270023243827998`indc
`[t] +  0.436858127219093M1[t] -0.0399988870685178M2[t] -2.40677166640325M3[t] -2.95706963841343M4[t] -4.03836102042737M5[t] -2.09097820123675M6[t] -3.00419908854042M7[t] -1.78500969314317M8[t] +  0.899750191024355M9[t] -0.347689294709870M10[t] -1.28273233446154M11[t]  + e[t] \tabularnewline
\hline
\end{tabular}
%Source: https://freestatistics.org/blog/index.php?pk=58445&T=1

[TABLE]
[ROW][C]Multiple Linear Regression - Estimated Regression Equation[/C][/ROW]
[ROW][C]dzcg[t] =  +  86.4486262206775 +  0.820422117853948totid[t] -0.834444510665815ndzcg[t] +  0.270023243827998`indc
`[t] +  0.436858127219093M1[t] -0.0399988870685178M2[t] -2.40677166640325M3[t] -2.95706963841343M4[t] -4.03836102042737M5[t] -2.09097820123675M6[t] -3.00419908854042M7[t] -1.78500969314317M8[t] +  0.899750191024355M9[t] -0.347689294709870M10[t] -1.28273233446154M11[t]  + e[t][/C][/ROW]
[/TABLE]
Source: https://freestatistics.org/blog/index.php?pk=58445&T=1

Globally Unique Identifier (entire table): ba.freestatistics.org/blog/index.php?pk=58445&T=1

As an alternative you can also use a QR Code:  

The GUIDs for individual cells are displayed in the table below:

Multiple Linear Regression - Estimated Regression Equation
dzcg[t] = + 86.4486262206775 + 0.820422117853948totid[t] -0.834444510665815ndzcg[t] + 0.270023243827998`indc `[t] + 0.436858127219093M1[t] -0.0399988870685178M2[t] -2.40677166640325M3[t] -2.95706963841343M4[t] -4.03836102042737M5[t] -2.09097820123675M6[t] -3.00419908854042M7[t] -1.78500969314317M8[t] + 0.899750191024355M9[t] -0.347689294709870M10[t] -1.28273233446154M11[t] + e[t]


Multiple Linear Regression - Ordinary Least Squares
VariableParameterS.D.T-STATH0: parameter = 02-tail p-value1-tail p-value
(Intercept)86.448626220677516.9484435.10076e-063e-06
totid0.8204221178539480.1682034.87761.3e-057e-06
ndzcg-0.8344445106658150.205969-4.05130.0001949.7e-05
`indc `0.2700232438279980.0882863.05850.0037020.001851
M10.4368581272190932.327070.18770.8519150.425957
M2-0.03999888706851782.445107-0.01640.9870190.493509
M3-2.406771666403252.447676-0.98330.3306090.165305
M4-2.957069638413432.431048-1.21640.2300460.115023
M5-4.038361020427372.454271-1.64540.1066960.053348
M6-2.090978201236752.43641-0.85820.395220.19761
M7-3.004199088540422.451304-1.22560.2266050.113303
M8-1.785009693143172.434525-0.73320.4671530.233576
M90.8997501910243552.4371780.36920.713690.356845
M10-0.3476892947098702.438123-0.14260.8872250.443612
M11-1.282732334461542.430166-0.52780.6001490.300075

\begin{tabular}{lllllllll}
\hline
Multiple Linear Regression - Ordinary Least Squares \tabularnewline
Variable & Parameter & S.D. & T-STATH0: parameter = 0 & 2-tail p-value & 1-tail p-value \tabularnewline
(Intercept) & 86.4486262206775 & 16.948443 & 5.1007 & 6e-06 & 3e-06 \tabularnewline
totid & 0.820422117853948 & 0.168203 & 4.8776 & 1.3e-05 & 7e-06 \tabularnewline
ndzcg & -0.834444510665815 & 0.205969 & -4.0513 & 0.000194 & 9.7e-05 \tabularnewline
`indc
` & 0.270023243827998 & 0.088286 & 3.0585 & 0.003702 & 0.001851 \tabularnewline
M1 & 0.436858127219093 & 2.32707 & 0.1877 & 0.851915 & 0.425957 \tabularnewline
M2 & -0.0399988870685178 & 2.445107 & -0.0164 & 0.987019 & 0.493509 \tabularnewline
M3 & -2.40677166640325 & 2.447676 & -0.9833 & 0.330609 & 0.165305 \tabularnewline
M4 & -2.95706963841343 & 2.431048 & -1.2164 & 0.230046 & 0.115023 \tabularnewline
M5 & -4.03836102042737 & 2.454271 & -1.6454 & 0.106696 & 0.053348 \tabularnewline
M6 & -2.09097820123675 & 2.43641 & -0.8582 & 0.39522 & 0.19761 \tabularnewline
M7 & -3.00419908854042 & 2.451304 & -1.2256 & 0.226605 & 0.113303 \tabularnewline
M8 & -1.78500969314317 & 2.434525 & -0.7332 & 0.467153 & 0.233576 \tabularnewline
M9 & 0.899750191024355 & 2.437178 & 0.3692 & 0.71369 & 0.356845 \tabularnewline
M10 & -0.347689294709870 & 2.438123 & -0.1426 & 0.887225 & 0.443612 \tabularnewline
M11 & -1.28273233446154 & 2.430166 & -0.5278 & 0.600149 & 0.300075 \tabularnewline
\hline
\end{tabular}
%Source: https://freestatistics.org/blog/index.php?pk=58445&T=2

[TABLE]
[ROW][C]Multiple Linear Regression - Ordinary Least Squares[/C][/ROW]
[ROW][C]Variable[/C][C]Parameter[/C][C]S.D.[/C][C]T-STATH0: parameter = 0[/C][C]2-tail p-value[/C][C]1-tail p-value[/C][/ROW]
[ROW][C](Intercept)[/C][C]86.4486262206775[/C][C]16.948443[/C][C]5.1007[/C][C]6e-06[/C][C]3e-06[/C][/ROW]
[ROW][C]totid[/C][C]0.820422117853948[/C][C]0.168203[/C][C]4.8776[/C][C]1.3e-05[/C][C]7e-06[/C][/ROW]
[ROW][C]ndzcg[/C][C]-0.834444510665815[/C][C]0.205969[/C][C]-4.0513[/C][C]0.000194[/C][C]9.7e-05[/C][/ROW]
[ROW][C]`indc
`[/C][C]0.270023243827998[/C][C]0.088286[/C][C]3.0585[/C][C]0.003702[/C][C]0.001851[/C][/ROW]
[ROW][C]M1[/C][C]0.436858127219093[/C][C]2.32707[/C][C]0.1877[/C][C]0.851915[/C][C]0.425957[/C][/ROW]
[ROW][C]M2[/C][C]-0.0399988870685178[/C][C]2.445107[/C][C]-0.0164[/C][C]0.987019[/C][C]0.493509[/C][/ROW]
[ROW][C]M3[/C][C]-2.40677166640325[/C][C]2.447676[/C][C]-0.9833[/C][C]0.330609[/C][C]0.165305[/C][/ROW]
[ROW][C]M4[/C][C]-2.95706963841343[/C][C]2.431048[/C][C]-1.2164[/C][C]0.230046[/C][C]0.115023[/C][/ROW]
[ROW][C]M5[/C][C]-4.03836102042737[/C][C]2.454271[/C][C]-1.6454[/C][C]0.106696[/C][C]0.053348[/C][/ROW]
[ROW][C]M6[/C][C]-2.09097820123675[/C][C]2.43641[/C][C]-0.8582[/C][C]0.39522[/C][C]0.19761[/C][/ROW]
[ROW][C]M7[/C][C]-3.00419908854042[/C][C]2.451304[/C][C]-1.2256[/C][C]0.226605[/C][C]0.113303[/C][/ROW]
[ROW][C]M8[/C][C]-1.78500969314317[/C][C]2.434525[/C][C]-0.7332[/C][C]0.467153[/C][C]0.233576[/C][/ROW]
[ROW][C]M9[/C][C]0.899750191024355[/C][C]2.437178[/C][C]0.3692[/C][C]0.71369[/C][C]0.356845[/C][/ROW]
[ROW][C]M10[/C][C]-0.347689294709870[/C][C]2.438123[/C][C]-0.1426[/C][C]0.887225[/C][C]0.443612[/C][/ROW]
[ROW][C]M11[/C][C]-1.28273233446154[/C][C]2.430166[/C][C]-0.5278[/C][C]0.600149[/C][C]0.300075[/C][/ROW]
[/TABLE]
Source: https://freestatistics.org/blog/index.php?pk=58445&T=2

Globally Unique Identifier (entire table): ba.freestatistics.org/blog/index.php?pk=58445&T=2

As an alternative you can also use a QR Code:  

The GUIDs for individual cells are displayed in the table below:

Multiple Linear Regression - Ordinary Least Squares
VariableParameterS.D.T-STATH0: parameter = 02-tail p-value1-tail p-value
(Intercept)86.448626220677516.9484435.10076e-063e-06
totid0.8204221178539480.1682034.87761.3e-057e-06
ndzcg-0.8344445106658150.205969-4.05130.0001949.7e-05
`indc `0.2700232438279980.0882863.05850.0037020.001851
M10.4368581272190932.327070.18770.8519150.425957
M2-0.03999888706851782.445107-0.01640.9870190.493509
M3-2.406771666403252.447676-0.98330.3306090.165305
M4-2.957069638413432.431048-1.21640.2300460.115023
M5-4.038361020427372.454271-1.64540.1066960.053348
M6-2.090978201236752.43641-0.85820.395220.19761
M7-3.004199088540422.451304-1.22560.2266050.113303
M8-1.785009693143172.434525-0.73320.4671530.233576
M90.8997501910243552.4371780.36920.713690.356845
M10-0.3476892947098702.438123-0.14260.8872250.443612
M11-1.282732334461542.430166-0.52780.6001490.300075


Multiple Linear Regression - Regression Statistics
Multiple R0.806556871701163
R-squared0.650533987288366
Adjusted R-squared0.544174766028304
F-TEST (value)6.11638539264709
F-TEST (DF numerator)14
F-TEST (DF denominator)46
p-value1.30419228838718e-06
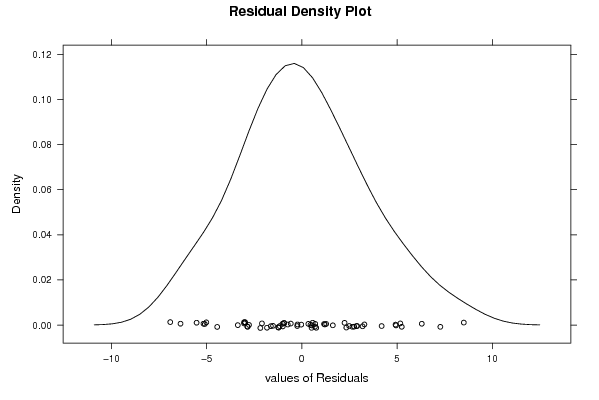
Multiple Linear Regression - Residual Statistics
Residual Standard Deviation3.84022541403812
Sum Squared Residuals678.377236608714

\begin{tabular}{lllllllll}
\hline
Multiple Linear Regression - Regression Statistics \tabularnewline
Multiple R & 0.806556871701163 \tabularnewline
R-squared & 0.650533987288366 \tabularnewline
Adjusted R-squared & 0.544174766028304 \tabularnewline
F-TEST (value) & 6.11638539264709 \tabularnewline
F-TEST (DF numerator) & 14 \tabularnewline
F-TEST (DF denominator) & 46 \tabularnewline
p-value & 1.30419228838718e-06 \tabularnewline
Multiple Linear Regression - Residual Statistics \tabularnewline
Residual Standard Deviation & 3.84022541403812 \tabularnewline
Sum Squared Residuals & 678.377236608714 \tabularnewline
\hline
\end{tabular}
%Source: https://freestatistics.org/blog/index.php?pk=58445&T=3

[TABLE]
[ROW][C]Multiple Linear Regression - Regression Statistics[/C][/ROW]
[ROW][C]Multiple R[/C][C]0.806556871701163[/C][/ROW]
[ROW][C]R-squared[/C][C]0.650533987288366[/C][/ROW]
[ROW][C]Adjusted R-squared[/C][C]0.544174766028304[/C][/ROW]
[ROW][C]F-TEST (value)[/C][C]6.11638539264709[/C][/ROW]
[ROW][C]F-TEST (DF numerator)[/C][C]14[/C][/ROW]
[ROW][C]F-TEST (DF denominator)[/C][C]46[/C][/ROW]
[ROW][C]p-value[/C][C]1.30419228838718e-06[/C][/ROW]
[ROW][C]Multiple Linear Regression - Residual Statistics[/C][/ROW]
[ROW][C]Residual Standard Deviation[/C][C]3.84022541403812[/C][/ROW]
[ROW][C]Sum Squared Residuals[/C][C]678.377236608714[/C][/ROW]
[/TABLE]
Source: https://freestatistics.org/blog/index.php?pk=58445&T=3

Globally Unique Identifier (entire table): ba.freestatistics.org/blog/index.php?pk=58445&T=3

As an alternative you can also use a QR Code:  

The GUIDs for individual cells are displayed in the table below:

Multiple Linear Regression - Regression Statistics
Multiple R0.806556871701163
R-squared0.650533987288366
Adjusted R-squared0.544174766028304
F-TEST (value)6.11638539264709
F-TEST (DF numerator)14
F-TEST (DF denominator)46
p-value1.30419228838718e-06
Multiple Linear Regression - Residual Statistics
Residual Standard Deviation3.84022541403812
Sum Squared Residuals678.377236608714


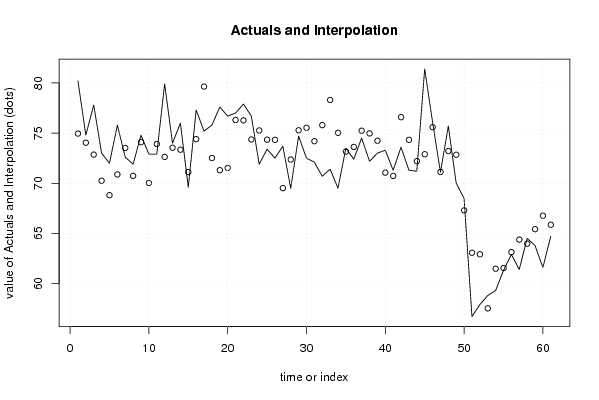
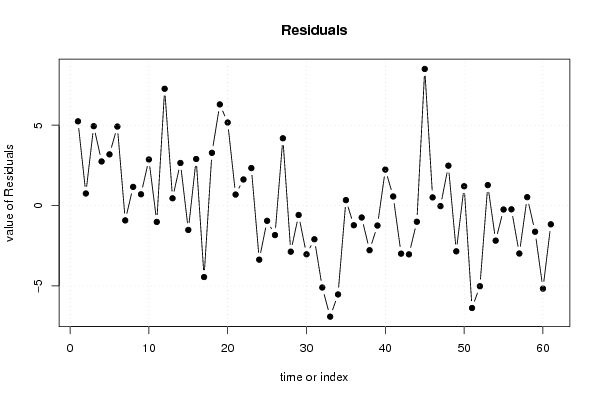
Multiple Linear Regression - Actuals, Interpolation, and Residuals
Time or IndexActualsInterpolationForecastResidualsPrediction Error
180.274.95628925730625.24371074269383
274.874.0467268149010.753273185099047
377.872.85945280543954.94054719456051
47370.25389282095092.74610717904912
57268.81304661620763.18695338379240
675.870.88179288774854.9182071122515
772.673.5214517922032-0.921451792203235
871.970.73566862573131.16433137426871
974.874.09710988759520.702890112404835
1072.970.03078817625262.8692118237474
1172.973.9159504891177-1.01595048911766
1279.972.63061212188067.26938787811938
137473.54602994347810.453970056521884
147673.34680262151772.65319737848227
1569.671.1148789759435-1.51487897594348
1677.374.40045543720022.89954456279978
1775.279.6454591634618-4.44545916346178
1875.872.51756487773333.28243512226671
1977.671.30427846960346.29572153039659
2076.771.53114313998215.16885686001792
217776.31275404435360.687245955646354
2277.976.27491414618261.62508585381746
2376.774.36658247925562.33341752074438
2471.975.2643440618515-3.36434406185155
2573.474.3473836906399-0.9473836906399
2672.574.3332743814681-1.83327438146811
2773.769.51245433990124.18754566009878
2869.572.3683415866974-2.86834158669735
2974.775.2840875015755-0.584087501575478
3072.575.5302127145839-3.03021271458391
3172.174.1964283819833-2.09642838198331
3270.775.7963818114026-5.0963818114026
3371.478.3099875349018-6.90998753490176
3469.575.027512638719-5.52751263871902
3573.573.15909746445030.340902535549746
3672.473.622809920339-1.22280992033903
3774.575.2405690567126-0.740569056712586
3872.274.9764874836678-2.77648748366777
397374.2416673336438-1.24166733364381
4073.371.05960264018832.24039735981165
4171.370.73157908493440.568420915065627
4273.676.5903455234814-2.99034552348141
4371.374.3340781541353-3.0340781541353
4471.272.2048444170411-1.00484441704112
4581.472.89806073614898.50193926385113
4676.175.59062247981610.50937752018388
4771.171.1320881325193-0.0320881325193157
4875.773.21641822208612.48358177791392
497072.8450284871207-2.84502848712074
5068.567.29670869844541.20329130155456
5156.763.071546545072-6.37154654507201
5257.962.9177075149632-5.01770751496319
5358.857.52582763382081.27417236617924
5459.361.4800839964529-2.18008399645289
5561.361.5437632020747-0.243763202074747
5662.963.1319620058429-0.231962005842906
5761.464.3820877970006-2.98208779700056
5864.563.97616255902970.523837440970271
5963.865.4262814346571-1.62628143465715
6061.666.7658156738427-5.16581567384272
6164.765.8646995647425-1.16469956474248

\begin{tabular}{lllllllll}
\hline
Multiple Linear Regression - Actuals, Interpolation, and Residuals \tabularnewline
Time or Index & Actuals & InterpolationForecast & ResidualsPrediction Error \tabularnewline
1 & 80.2 & 74.9562892573062 & 5.24371074269383 \tabularnewline
2 & 74.8 & 74.046726814901 & 0.753273185099047 \tabularnewline
3 & 77.8 & 72.8594528054395 & 4.94054719456051 \tabularnewline
4 & 73 & 70.2538928209509 & 2.74610717904912 \tabularnewline
5 & 72 & 68.8130466162076 & 3.18695338379240 \tabularnewline
6 & 75.8 & 70.8817928877485 & 4.9182071122515 \tabularnewline
7 & 72.6 & 73.5214517922032 & -0.921451792203235 \tabularnewline
8 & 71.9 & 70.7356686257313 & 1.16433137426871 \tabularnewline
9 & 74.8 & 74.0971098875952 & 0.702890112404835 \tabularnewline
10 & 72.9 & 70.0307881762526 & 2.8692118237474 \tabularnewline
11 & 72.9 & 73.9159504891177 & -1.01595048911766 \tabularnewline
12 & 79.9 & 72.6306121218806 & 7.26938787811938 \tabularnewline
13 & 74 & 73.5460299434781 & 0.453970056521884 \tabularnewline
14 & 76 & 73.3468026215177 & 2.65319737848227 \tabularnewline
15 & 69.6 & 71.1148789759435 & -1.51487897594348 \tabularnewline
16 & 77.3 & 74.4004554372002 & 2.89954456279978 \tabularnewline
17 & 75.2 & 79.6454591634618 & -4.44545916346178 \tabularnewline
18 & 75.8 & 72.5175648777333 & 3.28243512226671 \tabularnewline
19 & 77.6 & 71.3042784696034 & 6.29572153039659 \tabularnewline
20 & 76.7 & 71.5311431399821 & 5.16885686001792 \tabularnewline
21 & 77 & 76.3127540443536 & 0.687245955646354 \tabularnewline
22 & 77.9 & 76.2749141461826 & 1.62508585381746 \tabularnewline
23 & 76.7 & 74.3665824792556 & 2.33341752074438 \tabularnewline
24 & 71.9 & 75.2643440618515 & -3.36434406185155 \tabularnewline
25 & 73.4 & 74.3473836906399 & -0.9473836906399 \tabularnewline
26 & 72.5 & 74.3332743814681 & -1.83327438146811 \tabularnewline
27 & 73.7 & 69.5124543399012 & 4.18754566009878 \tabularnewline
28 & 69.5 & 72.3683415866974 & -2.86834158669735 \tabularnewline
29 & 74.7 & 75.2840875015755 & -0.584087501575478 \tabularnewline
30 & 72.5 & 75.5302127145839 & -3.03021271458391 \tabularnewline
31 & 72.1 & 74.1964283819833 & -2.09642838198331 \tabularnewline
32 & 70.7 & 75.7963818114026 & -5.0963818114026 \tabularnewline
33 & 71.4 & 78.3099875349018 & -6.90998753490176 \tabularnewline
34 & 69.5 & 75.027512638719 & -5.52751263871902 \tabularnewline
35 & 73.5 & 73.1590974644503 & 0.340902535549746 \tabularnewline
36 & 72.4 & 73.622809920339 & -1.22280992033903 \tabularnewline
37 & 74.5 & 75.2405690567126 & -0.740569056712586 \tabularnewline
38 & 72.2 & 74.9764874836678 & -2.77648748366777 \tabularnewline
39 & 73 & 74.2416673336438 & -1.24166733364381 \tabularnewline
40 & 73.3 & 71.0596026401883 & 2.24039735981165 \tabularnewline
41 & 71.3 & 70.7315790849344 & 0.568420915065627 \tabularnewline
42 & 73.6 & 76.5903455234814 & -2.99034552348141 \tabularnewline
43 & 71.3 & 74.3340781541353 & -3.0340781541353 \tabularnewline
44 & 71.2 & 72.2048444170411 & -1.00484441704112 \tabularnewline
45 & 81.4 & 72.8980607361489 & 8.50193926385113 \tabularnewline
46 & 76.1 & 75.5906224798161 & 0.50937752018388 \tabularnewline
47 & 71.1 & 71.1320881325193 & -0.0320881325193157 \tabularnewline
48 & 75.7 & 73.2164182220861 & 2.48358177791392 \tabularnewline
49 & 70 & 72.8450284871207 & -2.84502848712074 \tabularnewline
50 & 68.5 & 67.2967086984454 & 1.20329130155456 \tabularnewline
51 & 56.7 & 63.071546545072 & -6.37154654507201 \tabularnewline
52 & 57.9 & 62.9177075149632 & -5.01770751496319 \tabularnewline
53 & 58.8 & 57.5258276338208 & 1.27417236617924 \tabularnewline
54 & 59.3 & 61.4800839964529 & -2.18008399645289 \tabularnewline
55 & 61.3 & 61.5437632020747 & -0.243763202074747 \tabularnewline
56 & 62.9 & 63.1319620058429 & -0.231962005842906 \tabularnewline
57 & 61.4 & 64.3820877970006 & -2.98208779700056 \tabularnewline
58 & 64.5 & 63.9761625590297 & 0.523837440970271 \tabularnewline
59 & 63.8 & 65.4262814346571 & -1.62628143465715 \tabularnewline
60 & 61.6 & 66.7658156738427 & -5.16581567384272 \tabularnewline
61 & 64.7 & 65.8646995647425 & -1.16469956474248 \tabularnewline
\hline
\end{tabular}
%Source: https://freestatistics.org/blog/index.php?pk=58445&T=4

[TABLE]
[ROW][C]Multiple Linear Regression - Actuals, Interpolation, and Residuals[/C][/ROW]
[ROW][C]Time or Index[/C][C]Actuals[/C][C]InterpolationForecast[/C][C]ResidualsPrediction Error[/C][/ROW]
[ROW][C]1[/C][C]80.2[/C][C]74.9562892573062[/C][C]5.24371074269383[/C][/ROW]
[ROW][C]2[/C][C]74.8[/C][C]74.046726814901[/C][C]0.753273185099047[/C][/ROW]
[ROW][C]3[/C][C]77.8[/C][C]72.8594528054395[/C][C]4.94054719456051[/C][/ROW]
[ROW][C]4[/C][C]73[/C][C]70.2538928209509[/C][C]2.74610717904912[/C][/ROW]
[ROW][C]5[/C][C]72[/C][C]68.8130466162076[/C][C]3.18695338379240[/C][/ROW]
[ROW][C]6[/C][C]75.8[/C][C]70.8817928877485[/C][C]4.9182071122515[/C][/ROW]
[ROW][C]7[/C][C]72.6[/C][C]73.5214517922032[/C][C]-0.921451792203235[/C][/ROW]
[ROW][C]8[/C][C]71.9[/C][C]70.7356686257313[/C][C]1.16433137426871[/C][/ROW]
[ROW][C]9[/C][C]74.8[/C][C]74.0971098875952[/C][C]0.702890112404835[/C][/ROW]
[ROW][C]10[/C][C]72.9[/C][C]70.0307881762526[/C][C]2.8692118237474[/C][/ROW]
[ROW][C]11[/C][C]72.9[/C][C]73.9159504891177[/C][C]-1.01595048911766[/C][/ROW]
[ROW][C]12[/C][C]79.9[/C][C]72.6306121218806[/C][C]7.26938787811938[/C][/ROW]
[ROW][C]13[/C][C]74[/C][C]73.5460299434781[/C][C]0.453970056521884[/C][/ROW]
[ROW][C]14[/C][C]76[/C][C]73.3468026215177[/C][C]2.65319737848227[/C][/ROW]
[ROW][C]15[/C][C]69.6[/C][C]71.1148789759435[/C][C]-1.51487897594348[/C][/ROW]
[ROW][C]16[/C][C]77.3[/C][C]74.4004554372002[/C][C]2.89954456279978[/C][/ROW]
[ROW][C]17[/C][C]75.2[/C][C]79.6454591634618[/C][C]-4.44545916346178[/C][/ROW]
[ROW][C]18[/C][C]75.8[/C][C]72.5175648777333[/C][C]3.28243512226671[/C][/ROW]
[ROW][C]19[/C][C]77.6[/C][C]71.3042784696034[/C][C]6.29572153039659[/C][/ROW]
[ROW][C]20[/C][C]76.7[/C][C]71.5311431399821[/C][C]5.16885686001792[/C][/ROW]
[ROW][C]21[/C][C]77[/C][C]76.3127540443536[/C][C]0.687245955646354[/C][/ROW]
[ROW][C]22[/C][C]77.9[/C][C]76.2749141461826[/C][C]1.62508585381746[/C][/ROW]
[ROW][C]23[/C][C]76.7[/C][C]74.3665824792556[/C][C]2.33341752074438[/C][/ROW]
[ROW][C]24[/C][C]71.9[/C][C]75.2643440618515[/C][C]-3.36434406185155[/C][/ROW]
[ROW][C]25[/C][C]73.4[/C][C]74.3473836906399[/C][C]-0.9473836906399[/C][/ROW]
[ROW][C]26[/C][C]72.5[/C][C]74.3332743814681[/C][C]-1.83327438146811[/C][/ROW]
[ROW][C]27[/C][C]73.7[/C][C]69.5124543399012[/C][C]4.18754566009878[/C][/ROW]
[ROW][C]28[/C][C]69.5[/C][C]72.3683415866974[/C][C]-2.86834158669735[/C][/ROW]
[ROW][C]29[/C][C]74.7[/C][C]75.2840875015755[/C][C]-0.584087501575478[/C][/ROW]
[ROW][C]30[/C][C]72.5[/C][C]75.5302127145839[/C][C]-3.03021271458391[/C][/ROW]
[ROW][C]31[/C][C]72.1[/C][C]74.1964283819833[/C][C]-2.09642838198331[/C][/ROW]
[ROW][C]32[/C][C]70.7[/C][C]75.7963818114026[/C][C]-5.0963818114026[/C][/ROW]
[ROW][C]33[/C][C]71.4[/C][C]78.3099875349018[/C][C]-6.90998753490176[/C][/ROW]
[ROW][C]34[/C][C]69.5[/C][C]75.027512638719[/C][C]-5.52751263871902[/C][/ROW]
[ROW][C]35[/C][C]73.5[/C][C]73.1590974644503[/C][C]0.340902535549746[/C][/ROW]
[ROW][C]36[/C][C]72.4[/C][C]73.622809920339[/C][C]-1.22280992033903[/C][/ROW]
[ROW][C]37[/C][C]74.5[/C][C]75.2405690567126[/C][C]-0.740569056712586[/C][/ROW]
[ROW][C]38[/C][C]72.2[/C][C]74.9764874836678[/C][C]-2.77648748366777[/C][/ROW]
[ROW][C]39[/C][C]73[/C][C]74.2416673336438[/C][C]-1.24166733364381[/C][/ROW]
[ROW][C]40[/C][C]73.3[/C][C]71.0596026401883[/C][C]2.24039735981165[/C][/ROW]
[ROW][C]41[/C][C]71.3[/C][C]70.7315790849344[/C][C]0.568420915065627[/C][/ROW]
[ROW][C]42[/C][C]73.6[/C][C]76.5903455234814[/C][C]-2.99034552348141[/C][/ROW]
[ROW][C]43[/C][C]71.3[/C][C]74.3340781541353[/C][C]-3.0340781541353[/C][/ROW]
[ROW][C]44[/C][C]71.2[/C][C]72.2048444170411[/C][C]-1.00484441704112[/C][/ROW]
[ROW][C]45[/C][C]81.4[/C][C]72.8980607361489[/C][C]8.50193926385113[/C][/ROW]
[ROW][C]46[/C][C]76.1[/C][C]75.5906224798161[/C][C]0.50937752018388[/C][/ROW]
[ROW][C]47[/C][C]71.1[/C][C]71.1320881325193[/C][C]-0.0320881325193157[/C][/ROW]
[ROW][C]48[/C][C]75.7[/C][C]73.2164182220861[/C][C]2.48358177791392[/C][/ROW]
[ROW][C]49[/C][C]70[/C][C]72.8450284871207[/C][C]-2.84502848712074[/C][/ROW]
[ROW][C]50[/C][C]68.5[/C][C]67.2967086984454[/C][C]1.20329130155456[/C][/ROW]
[ROW][C]51[/C][C]56.7[/C][C]63.071546545072[/C][C]-6.37154654507201[/C][/ROW]
[ROW][C]52[/C][C]57.9[/C][C]62.9177075149632[/C][C]-5.01770751496319[/C][/ROW]
[ROW][C]53[/C][C]58.8[/C][C]57.5258276338208[/C][C]1.27417236617924[/C][/ROW]
[ROW][C]54[/C][C]59.3[/C][C]61.4800839964529[/C][C]-2.18008399645289[/C][/ROW]
[ROW][C]55[/C][C]61.3[/C][C]61.5437632020747[/C][C]-0.243763202074747[/C][/ROW]
[ROW][C]56[/C][C]62.9[/C][C]63.1319620058429[/C][C]-0.231962005842906[/C][/ROW]
[ROW][C]57[/C][C]61.4[/C][C]64.3820877970006[/C][C]-2.98208779700056[/C][/ROW]
[ROW][C]58[/C][C]64.5[/C][C]63.9761625590297[/C][C]0.523837440970271[/C][/ROW]
[ROW][C]59[/C][C]63.8[/C][C]65.4262814346571[/C][C]-1.62628143465715[/C][/ROW]
[ROW][C]60[/C][C]61.6[/C][C]66.7658156738427[/C][C]-5.16581567384272[/C][/ROW]
[ROW][C]61[/C][C]64.7[/C][C]65.8646995647425[/C][C]-1.16469956474248[/C][/ROW]
[/TABLE]
Source: https://freestatistics.org/blog/index.php?pk=58445&T=4

Globally Unique Identifier (entire table): ba.freestatistics.org/blog/index.php?pk=58445&T=4

As an alternative you can also use a QR Code:  

The GUIDs for individual cells are displayed in the table below:

Multiple Linear Regression - Actuals, Interpolation, and Residuals
Time or IndexActualsInterpolationForecastResidualsPrediction Error
180.274.95628925730625.24371074269383
274.874.0467268149010.753273185099047
377.872.85945280543954.94054719456051
47370.25389282095092.74610717904912
57268.81304661620763.18695338379240
675.870.88179288774854.9182071122515
772.673.5214517922032-0.921451792203235
871.970.73566862573131.16433137426871
974.874.09710988759520.702890112404835
1072.970.03078817625262.8692118237474
1172.973.9159504891177-1.01595048911766
1279.972.63061212188067.26938787811938
137473.54602994347810.453970056521884
147673.34680262151772.65319737848227
1569.671.1148789759435-1.51487897594348
1677.374.40045543720022.89954456279978
1775.279.6454591634618-4.44545916346178
1875.872.51756487773333.28243512226671
1977.671.30427846960346.29572153039659
2076.771.53114313998215.16885686001792
217776.31275404435360.687245955646354
2277.976.27491414618261.62508585381746
2376.774.36658247925562.33341752074438
2471.975.2643440618515-3.36434406185155
2573.474.3473836906399-0.9473836906399
2672.574.3332743814681-1.83327438146811
2773.769.51245433990124.18754566009878
2869.572.3683415866974-2.86834158669735
2974.775.2840875015755-0.584087501575478
3072.575.5302127145839-3.03021271458391
3172.174.1964283819833-2.09642838198331
3270.775.7963818114026-5.0963818114026
3371.478.3099875349018-6.90998753490176
3469.575.027512638719-5.52751263871902
3573.573.15909746445030.340902535549746
3672.473.622809920339-1.22280992033903
3774.575.2405690567126-0.740569056712586
3872.274.9764874836678-2.77648748366777
397374.2416673336438-1.24166733364381
4073.371.05960264018832.24039735981165
4171.370.73157908493440.568420915065627
4273.676.5903455234814-2.99034552348141
4371.374.3340781541353-3.0340781541353
4471.272.2048444170411-1.00484441704112
4581.472.89806073614898.50193926385113
4676.175.59062247981610.50937752018388
4771.171.1320881325193-0.0320881325193157
4875.773.21641822208612.48358177791392
497072.8450284871207-2.84502848712074
5068.567.29670869844541.20329130155456
5156.763.071546545072-6.37154654507201
5257.962.9177075149632-5.01770751496319
5358.857.52582763382081.27417236617924
5459.361.4800839964529-2.18008399645289
5561.361.5437632020747-0.243763202074747
5662.963.1319620058429-0.231962005842906
5761.464.3820877970006-2.98208779700056
5864.563.97616255902970.523837440970271
5963.865.4262814346571-1.62628143465715
6061.666.7658156738427-5.16581567384272
6164.765.8646995647425-1.16469956474248


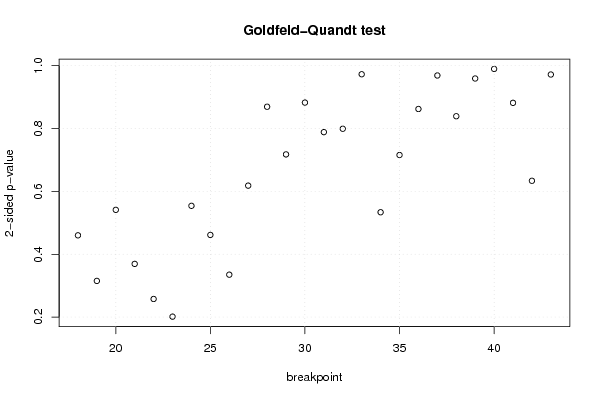
Goldfeld-Quandt test for Heteroskedasticity
p-valuesAlternative Hypothesis
breakpoint indexgreater2-sidedless
180.2300968153559850.460193630711970.769903184644015
190.1575753423399810.3151506846799620.842424657660019
200.2706477131297170.5412954262594340.729352286870283
210.1846652726594140.3693305453188270.815334727340586
220.1288535537234350.2577071074468690.871146446276565
230.1007260020652530.2014520041305060.899273997934747
240.2770374680239520.5540749360479050.722962531976048
250.2307548962732670.4615097925465350.769245103726732
260.1674791543764470.3349583087528940.832520845623553
270.3091458855720480.6182917711440970.690854114427952
280.4346695784919320.8693391569838640.565330421508068
290.3588417757291750.717683551458350.641158224270825
300.4412664732699450.882532946539890.558733526730055
310.39427741097740.78855482195480.6057225890226
320.3996349973136090.7992699946272170.600365002686391
330.4863439923489480.9726879846978960.513656007651052
340.7331853294105970.5336293411788060.266814670589403
350.642165844907510.715668310184980.35783415509249
360.5689223481327380.8621553037345240.431077651867262
370.484399823873010.968799647746020.51560017612699
380.4195662800612550.839132560122510.580433719938745
390.4795948514605720.9591897029211450.520405148539428
400.5052147385197040.9895705229605930.494785261480296
410.4408490785239380.8816981570478750.559150921476062
420.3168644288188210.6337288576376420.683135571181179
430.5140806671115280.9718386657769440.485919332888472

\begin{tabular}{lllllllll}
\hline
Goldfeld-Quandt test for Heteroskedasticity \tabularnewline
p-values & Alternative Hypothesis \tabularnewline
breakpoint index & greater & 2-sided & less \tabularnewline
18 & 0.230096815355985 & 0.46019363071197 & 0.769903184644015 \tabularnewline
19 & 0.157575342339981 & 0.315150684679962 & 0.842424657660019 \tabularnewline
20 & 0.270647713129717 & 0.541295426259434 & 0.729352286870283 \tabularnewline
21 & 0.184665272659414 & 0.369330545318827 & 0.815334727340586 \tabularnewline
22 & 0.128853553723435 & 0.257707107446869 & 0.871146446276565 \tabularnewline
23 & 0.100726002065253 & 0.201452004130506 & 0.899273997934747 \tabularnewline
24 & 0.277037468023952 & 0.554074936047905 & 0.722962531976048 \tabularnewline
25 & 0.230754896273267 & 0.461509792546535 & 0.769245103726732 \tabularnewline
26 & 0.167479154376447 & 0.334958308752894 & 0.832520845623553 \tabularnewline
27 & 0.309145885572048 & 0.618291771144097 & 0.690854114427952 \tabularnewline
28 & 0.434669578491932 & 0.869339156983864 & 0.565330421508068 \tabularnewline
29 & 0.358841775729175 & 0.71768355145835 & 0.641158224270825 \tabularnewline
30 & 0.441266473269945 & 0.88253294653989 & 0.558733526730055 \tabularnewline
31 & 0.3942774109774 & 0.7885548219548 & 0.6057225890226 \tabularnewline
32 & 0.399634997313609 & 0.799269994627217 & 0.600365002686391 \tabularnewline
33 & 0.486343992348948 & 0.972687984697896 & 0.513656007651052 \tabularnewline
34 & 0.733185329410597 & 0.533629341178806 & 0.266814670589403 \tabularnewline
35 & 0.64216584490751 & 0.71566831018498 & 0.35783415509249 \tabularnewline
36 & 0.568922348132738 & 0.862155303734524 & 0.431077651867262 \tabularnewline
37 & 0.48439982387301 & 0.96879964774602 & 0.51560017612699 \tabularnewline
38 & 0.419566280061255 & 0.83913256012251 & 0.580433719938745 \tabularnewline
39 & 0.479594851460572 & 0.959189702921145 & 0.520405148539428 \tabularnewline
40 & 0.505214738519704 & 0.989570522960593 & 0.494785261480296 \tabularnewline
41 & 0.440849078523938 & 0.881698157047875 & 0.559150921476062 \tabularnewline
42 & 0.316864428818821 & 0.633728857637642 & 0.683135571181179 \tabularnewline
43 & 0.514080667111528 & 0.971838665776944 & 0.485919332888472 \tabularnewline
\hline
\end{tabular}
%Source: https://freestatistics.org/blog/index.php?pk=58445&T=5

[TABLE]
[ROW][C]Goldfeld-Quandt test for Heteroskedasticity[/C][/ROW]
[ROW][C]p-values[/C][C]Alternative Hypothesis[/C][/ROW]
[ROW][C]breakpoint index[/C][C]greater[/C][C]2-sided[/C][C]less[/C][/ROW]
[ROW][C]18[/C][C]0.230096815355985[/C][C]0.46019363071197[/C][C]0.769903184644015[/C][/ROW]
[ROW][C]19[/C][C]0.157575342339981[/C][C]0.315150684679962[/C][C]0.842424657660019[/C][/ROW]
[ROW][C]20[/C][C]0.270647713129717[/C][C]0.541295426259434[/C][C]0.729352286870283[/C][/ROW]
[ROW][C]21[/C][C]0.184665272659414[/C][C]0.369330545318827[/C][C]0.815334727340586[/C][/ROW]
[ROW][C]22[/C][C]0.128853553723435[/C][C]0.257707107446869[/C][C]0.871146446276565[/C][/ROW]
[ROW][C]23[/C][C]0.100726002065253[/C][C]0.201452004130506[/C][C]0.899273997934747[/C][/ROW]
[ROW][C]24[/C][C]0.277037468023952[/C][C]0.554074936047905[/C][C]0.722962531976048[/C][/ROW]
[ROW][C]25[/C][C]0.230754896273267[/C][C]0.461509792546535[/C][C]0.769245103726732[/C][/ROW]
[ROW][C]26[/C][C]0.167479154376447[/C][C]0.334958308752894[/C][C]0.832520845623553[/C][/ROW]
[ROW][C]27[/C][C]0.309145885572048[/C][C]0.618291771144097[/C][C]0.690854114427952[/C][/ROW]
[ROW][C]28[/C][C]0.434669578491932[/C][C]0.869339156983864[/C][C]0.565330421508068[/C][/ROW]
[ROW][C]29[/C][C]0.358841775729175[/C][C]0.71768355145835[/C][C]0.641158224270825[/C][/ROW]
[ROW][C]30[/C][C]0.441266473269945[/C][C]0.88253294653989[/C][C]0.558733526730055[/C][/ROW]
[ROW][C]31[/C][C]0.3942774109774[/C][C]0.7885548219548[/C][C]0.6057225890226[/C][/ROW]
[ROW][C]32[/C][C]0.399634997313609[/C][C]0.799269994627217[/C][C]0.600365002686391[/C][/ROW]
[ROW][C]33[/C][C]0.486343992348948[/C][C]0.972687984697896[/C][C]0.513656007651052[/C][/ROW]
[ROW][C]34[/C][C]0.733185329410597[/C][C]0.533629341178806[/C][C]0.266814670589403[/C][/ROW]
[ROW][C]35[/C][C]0.64216584490751[/C][C]0.71566831018498[/C][C]0.35783415509249[/C][/ROW]
[ROW][C]36[/C][C]0.568922348132738[/C][C]0.862155303734524[/C][C]0.431077651867262[/C][/ROW]
[ROW][C]37[/C][C]0.48439982387301[/C][C]0.96879964774602[/C][C]0.51560017612699[/C][/ROW]
[ROW][C]38[/C][C]0.419566280061255[/C][C]0.83913256012251[/C][C]0.580433719938745[/C][/ROW]
[ROW][C]39[/C][C]0.479594851460572[/C][C]0.959189702921145[/C][C]0.520405148539428[/C][/ROW]
[ROW][C]40[/C][C]0.505214738519704[/C][C]0.989570522960593[/C][C]0.494785261480296[/C][/ROW]
[ROW][C]41[/C][C]0.440849078523938[/C][C]0.881698157047875[/C][C]0.559150921476062[/C][/ROW]
[ROW][C]42[/C][C]0.316864428818821[/C][C]0.633728857637642[/C][C]0.683135571181179[/C][/ROW]
[ROW][C]43[/C][C]0.514080667111528[/C][C]0.971838665776944[/C][C]0.485919332888472[/C][/ROW]
[/TABLE]
Source: https://freestatistics.org/blog/index.php?pk=58445&T=5

Globally Unique Identifier (entire table): ba.freestatistics.org/blog/index.php?pk=58445&T=5

As an alternative you can also use a QR Code:  

The GUIDs for individual cells are displayed in the table below:

Goldfeld-Quandt test for Heteroskedasticity
p-valuesAlternative Hypothesis
breakpoint indexgreater2-sidedless
180.2300968153559850.460193630711970.769903184644015
190.1575753423399810.3151506846799620.842424657660019
200.2706477131297170.5412954262594340.729352286870283
210.1846652726594140.3693305453188270.815334727340586
220.1288535537234350.2577071074468690.871146446276565
230.1007260020652530.2014520041305060.899273997934747
240.2770374680239520.5540749360479050.722962531976048
250.2307548962732670.4615097925465350.769245103726732
260.1674791543764470.3349583087528940.832520845623553
270.3091458855720480.6182917711440970.690854114427952
280.4346695784919320.8693391569838640.565330421508068
290.3588417757291750.717683551458350.641158224270825
300.4412664732699450.882532946539890.558733526730055
310.39427741097740.78855482195480.6057225890226
320.3996349973136090.7992699946272170.600365002686391
330.4863439923489480.9726879846978960.513656007651052
340.7331853294105970.5336293411788060.266814670589403
350.642165844907510.715668310184980.35783415509249
360.5689223481327380.8621553037345240.431077651867262
370.484399823873010.968799647746020.51560017612699
380.4195662800612550.839132560122510.580433719938745
390.4795948514605720.9591897029211450.520405148539428
400.5052147385197040.9895705229605930.494785261480296
410.4408490785239380.8816981570478750.559150921476062
420.3168644288188210.6337288576376420.683135571181179
430.5140806671115280.9718386657769440.485919332888472


Meta Analysis of Goldfeld-Quandt test for Heteroskedasticity
Description# significant tests% significant testsOK/NOK
1% type I error level00OK
5% type I error level00OK
10% type I error level00OK

\begin{tabular}{lllllllll}
\hline
Meta Analysis of Goldfeld-Quandt test for Heteroskedasticity \tabularnewline
Description & # significant tests & % significant tests & OK/NOK \tabularnewline
1% type I error level & 0 & 0 & OK \tabularnewline
5% type I error level & 0 & 0 & OK \tabularnewline
10% type I error level & 0 & 0 & OK \tabularnewline
\hline
\end{tabular}
%Source: https://freestatistics.org/blog/index.php?pk=58445&T=6

[TABLE]
[ROW][C]Meta Analysis of Goldfeld-Quandt test for Heteroskedasticity[/C][/ROW]
[ROW][C]Description[/C][C]# significant tests[/C][C]% significant tests[/C][C]OK/NOK[/C][/ROW]
[ROW][C]1% type I error level[/C][C]0[/C][C]0[/C][C]OK[/C][/ROW]
[ROW][C]5% type I error level[/C][C]0[/C][C]0[/C][C]OK[/C][/ROW]
[ROW][C]10% type I error level[/C][C]0[/C][C]0[/C][C]OK[/C][/ROW]
[/TABLE]
Source: https://freestatistics.org/blog/index.php?pk=58445&T=6

Globally Unique Identifier (entire table): ba.freestatistics.org/blog/index.php?pk=58445&T=6

As an alternative you can also use a QR Code:  

The GUIDs for individual cells are displayed in the table below:

Meta Analysis of Goldfeld-Quandt test for Heteroskedasticity
Description# significant tests% significant testsOK/NOK
1% type I error level00OK
5% type I error level00OK
10% type I error level00OK


Parameters (Session):
par1 = 3 ; par2 = Include Monthly Dummies ; par3 = No Linear Trend ;
Parameters (R input):
par1 = 3 ; par2 = Include Monthly Dummies ; par3 = No Linear Trend ;
R code (references can be found in the software module):
library(lattice)
library(lmtest)
n25 <- 25 #minimum number of obs. for Goldfeld-Quandt test
par1 <- as.numeric(par1)
x <- t(y)
k <- length(x[1,])
n <- length(x[,1])
x1 <- cbind(x[,par1], x[,1:k!=par1])
mycolnames <- c(colnames(x)[par1], colnames(x)[1:k!=par1])
colnames(x1) <- mycolnames #colnames(x)[par1]
x <- x1
if (par3 == 'First Differences'){
x2 <- array(0, dim=c(n-1,k), dimnames=list(1:(n-1), paste('(1-B)',colnames(x),sep='')))
for (i in 1:n-1) {
for (j in 1:k) {
x2[i,j] <- x[i+1,j] - x[i,j]
}
}
x <- x2
}
if (par2 == 'Include Monthly Dummies'){
x2 <- array(0, dim=c(n,11), dimnames=list(1:n, paste('M', seq(1:11), sep ='')))
for (i in 1:11){
x2[seq(i,n,12),i] <- 1
}
x <- cbind(x, x2)
}
if (par2 == 'Include Quarterly Dummies'){
x2 <- array(0, dim=c(n,3), dimnames=list(1:n, paste('Q', seq(1:3), sep ='')))
for (i in 1:3){
x2[seq(i,n,4),i] <- 1
}
x <- cbind(x, x2)
}
k <- length(x[1,])
if (par3 == 'Linear Trend'){
x <- cbind(x, c(1:n))
colnames(x)[k+1] <- 't'
}
x
k <- length(x[1,])
df <- as.data.frame(x)
(mylm <- lm(df))
(mysum <- summary(mylm))
if (n > n25) {
kp3 <- k + 3
nmkm3 <- n - k - 3
gqarr <- array(NA, dim=c(nmkm3-kp3+1,3))
numgqtests <- 0
numsignificant1 <- 0
numsignificant5 <- 0
numsignificant10 <- 0
for (mypoint in kp3:nmkm3) {
j <- 0
numgqtests <- numgqtests + 1
for (myalt in c('greater', 'two.sided', 'less')) {
j <- j + 1
gqarr[mypoint-kp3+1,j] <- gqtest(mylm, point=mypoint, alternative=myalt)$p.value
}
if (gqarr[mypoint-kp3+1,2] < 0.01) numsignificant1 <- numsignificant1 + 1
if (gqarr[mypoint-kp3+1,2] < 0.05) numsignificant5 <- numsignificant5 + 1
if (gqarr[mypoint-kp3+1,2] < 0.10) numsignificant10 <- numsignificant10 + 1
}
gqarr
}
bitmap(file='test0.png')
plot(x[,1], type='l', main='Actuals and Interpolation', ylab='value of Actuals and Interpolation (dots)', xlab='time or index')
points(x[,1]-mysum$resid)
grid()
dev.off()
bitmap(file='test1.png')
plot(mysum$resid, type='b', pch=19, main='Residuals', ylab='value of Residuals', xlab='time or index')
grid()
dev.off()
bitmap(file='test2.png')
hist(mysum$resid, main='Residual Histogram', xlab='values of Residuals')
grid()
dev.off()
bitmap(file='test3.png')
densityplot(~mysum$resid,col='black',main='Residual Density Plot', xlab='values of Residuals')
dev.off()
bitmap(file='test4.png')
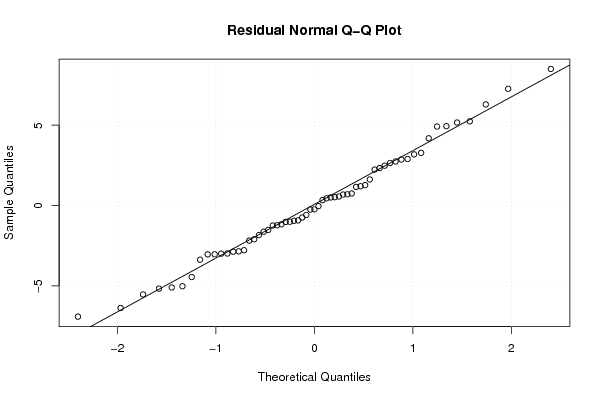
qqnorm(mysum$resid, main='Residual Normal Q-Q Plot')
qqline(mysum$resid)
grid()
dev.off()
(myerror <- as.ts(mysum$resid))
bitmap(file='test5.png')
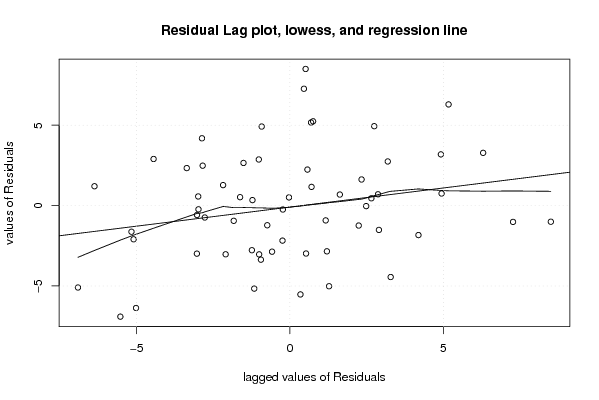
dum <- cbind(lag(myerror,k=1),myerror)
dum
dum1 <- dum[2:length(myerror),]
dum1
z <- as.data.frame(dum1)
z
plot(z,main=paste('Residual Lag plot, lowess, and regression line'), ylab='values of Residuals', xlab='lagged values of Residuals')
lines(lowess(z))
abline(lm(z))
grid()
dev.off()
bitmap(file='test6.png')
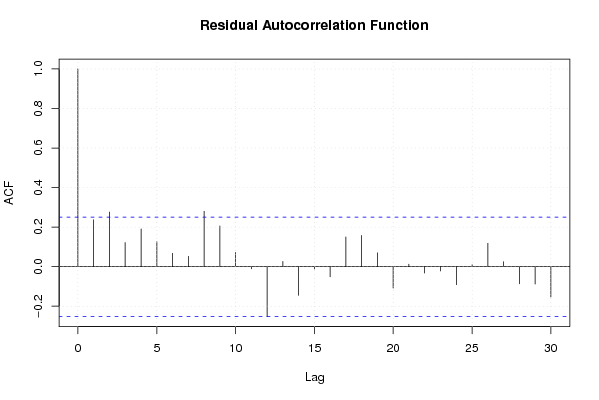
acf(mysum$resid, lag.max=length(mysum$resid)/2, main='Residual Autocorrelation Function')
grid()
dev.off()
bitmap(file='test7.png')
pacf(mysum$resid, lag.max=length(mysum$resid)/2, main='Residual Partial Autocorrelation Function')
grid()
dev.off()
bitmap(file='test8.png')
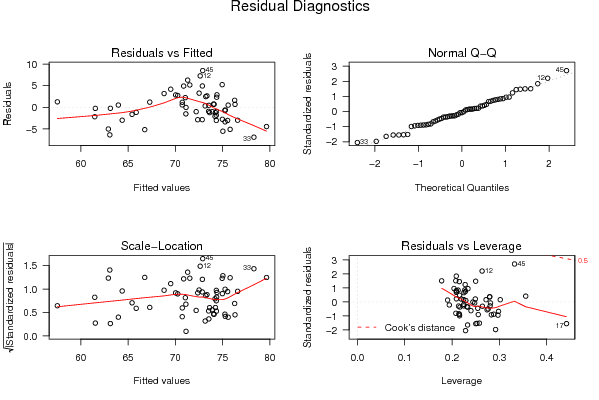
opar <- par(mfrow = c(2,2), oma = c(0, 0, 1.1, 0))
plot(mylm, las = 1, sub='Residual Diagnostics')
par(opar)
dev.off()
if (n > n25) {
bitmap(file='test9.png')
plot(kp3:nmkm3,gqarr[,2], main='Goldfeld-Quandt test',ylab='2-sided p-value',xlab='breakpoint')
grid()
dev.off()
}
load(file='createtable')
a<-table.start()
a<-table.row.start(a)
a<-table.element(a, 'Multiple Linear Regression - Estimated Regression Equation', 1, TRUE)
a<-table.row.end(a)
myeq <- colnames(x)[1]
myeq <- paste(myeq, '[t] = ', sep='')
for (i in 1:k){
if (mysum$coefficients[i,1] > 0) myeq <- paste(myeq, '+', '')
myeq <- paste(myeq, mysum$coefficients[i,1], sep=' ')
if (rownames(mysum$coefficients)[i] != '(Intercept)') {
myeq <- paste(myeq, rownames(mysum$coefficients)[i], sep='')
if (rownames(mysum$coefficients)[i] != 't') myeq <- paste(myeq, '[t]', sep='')
}
}
myeq <- paste(myeq, ' + e[t]')
a<-table.row.start(a)
a<-table.element(a, myeq)
a<-table.row.end(a)
a<-table.end(a)
table.save(a,file='mytable1.tab')
a<-table.start()
a<-table.row.start(a)
a<-table.element(a,hyperlink('ols1.htm','Multiple Linear Regression - Ordinary Least Squares',''), 6, TRUE)
a<-table.row.end(a)
a<-table.row.start(a)
a<-table.element(a,'Variable',header=TRUE)
a<-table.element(a,'Parameter',header=TRUE)
a<-table.element(a,'S.D.',header=TRUE)
a<-table.element(a,'T-STAT
H0: parameter = 0',header=TRUE)
a<-table.element(a,'2-tail p-value',header=TRUE)
a<-table.element(a,'1-tail p-value',header=TRUE)
a<-table.row.end(a)
for (i in 1:k){
a<-table.row.start(a)
a<-table.element(a,rownames(mysum$coefficients)[i],header=TRUE)
a<-table.element(a,mysum$coefficients[i,1])
a<-table.element(a, round(mysum$coefficients[i,2],6))
a<-table.element(a, round(mysum$coefficients[i,3],4))
a<-table.element(a, round(mysum$coefficients[i,4],6))
a<-table.element(a, round(mysum$coefficients[i,4]/2,6))
a<-table.row.end(a)
}
a<-table.end(a)
table.save(a,file='mytable2.tab')
a<-table.start()
a<-table.row.start(a)
a<-table.element(a, 'Multiple Linear Regression - Regression Statistics', 2, TRUE)
a<-table.row.end(a)
a<-table.row.start(a)
a<-table.element(a, 'Multiple R',1,TRUE)
a<-table.element(a, sqrt(mysum$r.squared))
a<-table.row.end(a)
a<-table.row.start(a)
a<-table.element(a, 'R-squared',1,TRUE)
a<-table.element(a, mysum$r.squared)
a<-table.row.end(a)
a<-table.row.start(a)
a<-table.element(a, 'Adjusted R-squared',1,TRUE)
a<-table.element(a, mysum$adj.r.squared)
a<-table.row.end(a)
a<-table.row.start(a)
a<-table.element(a, 'F-TEST (value)',1,TRUE)
a<-table.element(a, mysum$fstatistic[1])
a<-table.row.end(a)
a<-table.row.start(a)
a<-table.element(a, 'F-TEST (DF numerator)',1,TRUE)
a<-table.element(a, mysum$fstatistic[2])
a<-table.row.end(a)
a<-table.row.start(a)
a<-table.element(a, 'F-TEST (DF denominator)',1,TRUE)
a<-table.element(a, mysum$fstatistic[3])
a<-table.row.end(a)
a<-table.row.start(a)
a<-table.element(a, 'p-value',1,TRUE)
a<-table.element(a, 1-pf(mysum$fstatistic[1],mysum$fstatistic[2],mysum$fstatistic[3]))
a<-table.row.end(a)
a<-table.row.start(a)
a<-table.element(a, 'Multiple Linear Regression - Residual Statistics', 2, TRUE)
a<-table.row.end(a)
a<-table.row.start(a)
a<-table.element(a, 'Residual Standard Deviation',1,TRUE)
a<-table.element(a, mysum$sigma)
a<-table.row.end(a)
a<-table.row.start(a)
a<-table.element(a, 'Sum Squared Residuals',1,TRUE)
a<-table.element(a, sum(myerror*myerror))
a<-table.row.end(a)
a<-table.end(a)
table.save(a,file='mytable3.tab')
a<-table.start()
a<-table.row.start(a)
a<-table.element(a, 'Multiple Linear Regression - Actuals, Interpolation, and Residuals', 4, TRUE)
a<-table.row.end(a)
a<-table.row.start(a)
a<-table.element(a, 'Time or Index', 1, TRUE)
a<-table.element(a, 'Actuals', 1, TRUE)
a<-table.element(a, 'Interpolation
Forecast', 1, TRUE)
a<-table.element(a, 'Residuals
Prediction Error', 1, TRUE)
a<-table.row.end(a)
for (i in 1:n) {
a<-table.row.start(a)
a<-table.element(a,i, 1, TRUE)
a<-table.element(a,x[i])
a<-table.element(a,x[i]-mysum$resid[i])
a<-table.element(a,mysum$resid[i])
a<-table.row.end(a)
}
a<-table.end(a)
table.save(a,file='mytable4.tab')
if (n > n25) {
a<-table.start()
a<-table.row.start(a)
a<-table.element(a,'Goldfeld-Quandt test for Heteroskedasticity',4,TRUE)
a<-table.row.end(a)
a<-table.row.start(a)
a<-table.element(a,'p-values',header=TRUE)
a<-table.element(a,'Alternative Hypothesis',3,header=TRUE)
a<-table.row.end(a)
a<-table.row.start(a)
a<-table.element(a,'breakpoint index',header=TRUE)
a<-table.element(a,'greater',header=TRUE)
a<-table.element(a,'2-sided',header=TRUE)
a<-table.element(a,'less',header=TRUE)
a<-table.row.end(a)
for (mypoint in kp3:nmkm3) {
a<-table.row.start(a)
a<-table.element(a,mypoint,header=TRUE)
a<-table.element(a,gqarr[mypoint-kp3+1,1])
a<-table.element(a,gqarr[mypoint-kp3+1,2])
a<-table.element(a,gqarr[mypoint-kp3+1,3])
a<-table.row.end(a)
}
a<-table.end(a)
table.save(a,file='mytable5.tab')
a<-table.start()
a<-table.row.start(a)
a<-table.element(a,'Meta Analysis of Goldfeld-Quandt test for Heteroskedasticity',4,TRUE)
a<-table.row.end(a)
a<-table.row.start(a)
a<-table.element(a,'Description',header=TRUE)
a<-table.element(a,'# significant tests',header=TRUE)
a<-table.element(a,'% significant tests',header=TRUE)
a<-table.element(a,'OK/NOK',header=TRUE)
a<-table.row.end(a)
a<-table.row.start(a)
a<-table.element(a,'1% type I error level',header=TRUE)
a<-table.element(a,numsignificant1)
a<-table.element(a,numsignificant1/numgqtests)
if (numsignificant1/numgqtests < 0.01) dum <- 'OK' else dum <- 'NOK'
a<-table.element(a,dum)
a<-table.row.end(a)
a<-table.row.start(a)
a<-table.element(a,'5% type I error level',header=TRUE)
a<-table.element(a,numsignificant5)
a<-table.element(a,numsignificant5/numgqtests)
if (numsignificant5/numgqtests < 0.05) dum <- 'OK' else dum <- 'NOK'
a<-table.element(a,dum)
a<-table.row.end(a)
a<-table.row.start(a)
a<-table.element(a,'10% type I error level',header=TRUE)
a<-table.element(a,numsignificant10)
a<-table.element(a,numsignificant10/numgqtests)
if (numsignificant10/numgqtests < 0.1) dum <- 'OK' else dum <- 'NOK'
a<-table.element(a,dum)
a<-table.row.end(a)
a<-table.end(a)
table.save(a,file='mytable6.tab')
}