Free Statistics

of Irreproducible Research!

Author's title

Author*The author of this computation has been verified*
R Software Modulerwasp_multipleregression.wasp
Title produced by softwareMultiple Regression
Date of computationFri, 20 Nov 2009 15:56:26 -0700
Cite this page as followsStatistical Computations at FreeStatistics.org, Office for Research Development and Education, URL https://freestatistics.org/blog/index.php?v=date/2009/Nov/21/t12587581278cjlr067uouaqyt.htm/, Retrieved Sat, 27 Apr 2024 14:09:36 +0000
Statistical Computations at FreeStatistics.org, Office for Research Development and Education, URL https://freestatistics.org/blog/index.php?pk=58486, Retrieved Sat, 27 Apr 2024 14:09:36 +0000
QR Codes:

Original text written by user:
IsPrivate?No (this computation is public)
User-defined keywords
Estimated Impact187
Family? (F = Feedback message, R = changed R code, M = changed R Module, P = changed Parameters, D = changed Data)
-     [Multiple Regression] [Q1 The Seatbeltlaw] [2007-11-14 19:27:43] [8cd6641b921d30ebe00b648d1481bba0]
- RMPD  [Multiple Regression] [Seatbelt] [2009-11-12 13:54:52] [b98453cac15ba1066b407e146608df68]
-    D    [Multiple Regression] [] [2009-11-20 07:36:00] [5d885a68c2332cc44f6191ec94766bfa]
-   PD        [Multiple Regression] [Model3] [2009-11-20 22:56:26] [82f29a5d509ab8039aab37a0145f886d] [Current]
Feedback Forum

Post a new message
Dataseries X:
562	13.9
561	15.9
555	18.2
544	19.7
537	20.1
543	19.9
594	20
611	22.6
613	20.6
611	20.1
594	20.2
595	21.8
591	22
589	19.5
584	17.5
573	18.2
567	18.8
569	19.7
621	18.8
629	18.5
628	18.7
612	18.5
595	19.3
597	18.9
593	21.4
590	22.5
580	25
574	22.9
573	22.9
573	21.3
620	22.3
626	20.9
620	19.9
588	20.2
566	19.8
557	17.7
561	18.1
549	17.6
532	18.2
526	16
511	16.3
499	17.3
555	19
565	18.6
542	18
527	17.9
510	17.8
514	18.5
517	17.4
508	19
493	17.4
490	20.6
469	18.5
478	20
528	18.8
534	18.8
518	19.7
506	15.3
502	10.6
516	6.1
528	0.9


Summary of computational transaction
Raw Inputview raw input (R code)
Raw Outputview raw output of R engine
Computing time4 seconds
R Server'Gwilym Jenkins' @ 72.249.127.135

\begin{tabular}{lllllllll}
\hline
Summary of computational transaction \tabularnewline
Raw Input & view raw input (R code)  \tabularnewline
Raw Output & view raw output of R engine  \tabularnewline
Computing time & 4 seconds \tabularnewline
R Server & 'Gwilym Jenkins' @ 72.249.127.135 \tabularnewline
\hline
\end{tabular}
%Source: https://freestatistics.org/blog/index.php?pk=58486&T=0

[TABLE]
[ROW][C]Summary of computational transaction[/C][/ROW]
[ROW][C]Raw Input[/C][C]view raw input (R code) [/C][/ROW]
[ROW][C]Raw Output[/C][C]view raw output of R engine [/C][/ROW]
[ROW][C]Computing time[/C][C]4 seconds[/C][/ROW]
[ROW][C]R Server[/C][C]'Gwilym Jenkins' @ 72.249.127.135[/C][/ROW]
[/TABLE]
Source: https://freestatistics.org/blog/index.php?pk=58486&T=0

Globally Unique Identifier (entire table): ba.freestatistics.org/blog/index.php?pk=58486&T=0

As an alternative you can also use a QR Code:  

The GUIDs for individual cells are displayed in the table below:

Summary of computational transaction
Raw Inputview raw input (R code)
Raw Outputview raw output of R engine
Computing time4 seconds
R Server'Gwilym Jenkins' @ 72.249.127.135


Multiple Linear Regression - Estimated Regression Equation
Y[t] = + 582.265639057551 + 1.75858938712907X[t] -3.13436250319707M1[t] -15.9053730581449M2[t] -25.5924034907366M3[t] -31.8332314091302M4[t] -40.0057953604147M5[t] -38.0224822175212M6[t] + 14.4773770150556M7[t] + 25.2475798231175M8[t] + 18.8729362634568M9[t] + 6.74241560961807M10[t] -5.59913577067612M11[t] -1.54606174677481t + e[t]

\begin{tabular}{lllllllll}
\hline
Multiple Linear Regression - Estimated Regression Equation \tabularnewline
Y[t] =  +  582.265639057551 +  1.75858938712907X[t] -3.13436250319707M1[t] -15.9053730581449M2[t] -25.5924034907366M3[t] -31.8332314091302M4[t] -40.0057953604147M5[t] -38.0224822175212M6[t] +  14.4773770150556M7[t] +  25.2475798231175M8[t] +  18.8729362634568M9[t] +  6.74241560961807M10[t] -5.59913577067612M11[t] -1.54606174677481t  + e[t] \tabularnewline
\hline
\end{tabular}
%Source: https://freestatistics.org/blog/index.php?pk=58486&T=1

[TABLE]
[ROW][C]Multiple Linear Regression - Estimated Regression Equation[/C][/ROW]
[ROW][C]Y[t] =  +  582.265639057551 +  1.75858938712907X[t] -3.13436250319707M1[t] -15.9053730581449M2[t] -25.5924034907366M3[t] -31.8332314091302M4[t] -40.0057953604147M5[t] -38.0224822175212M6[t] +  14.4773770150556M7[t] +  25.2475798231175M8[t] +  18.8729362634568M9[t] +  6.74241560961807M10[t] -5.59913577067612M11[t] -1.54606174677481t  + e[t][/C][/ROW]
[/TABLE]
Source: https://freestatistics.org/blog/index.php?pk=58486&T=1

Globally Unique Identifier (entire table): ba.freestatistics.org/blog/index.php?pk=58486&T=1

As an alternative you can also use a QR Code:  

The GUIDs for individual cells are displayed in the table below:

Multiple Linear Regression - Estimated Regression Equation
Y[t] = + 582.265639057551 + 1.75858938712907X[t] -3.13436250319707M1[t] -15.9053730581449M2[t] -25.5924034907366M3[t] -31.8332314091302M4[t] -40.0057953604147M5[t] -38.0224822175212M6[t] + 14.4773770150556M7[t] + 25.2475798231175M8[t] + 18.8729362634568M9[t] + 6.74241560961807M10[t] -5.59913577067612M11[t] -1.54606174677481t + e[t]


Multiple Linear Regression - Ordinary Least Squares
VariableParameterS.D.T-STATH0: parameter = 02-tail p-value1-tail p-value
(Intercept)582.26563905755124.04439124.216300
X1.758589387129071.043191.68580.0984670.049234
M1-3.1343625031970715.126943-0.20720.8367460.418373
M2-15.905373058144915.88376-1.00140.321780.16089
M3-25.592403490736615.915677-1.6080.1145330.057267
M4-31.833231409130215.940638-1.9970.0516360.025818
M5-40.005795360414715.912614-2.51410.0154170.007708
M6-38.022482217521215.9634-2.38190.0213260.010663
M714.477377015055615.9917560.90530.3699230.184961
M825.247579823117516.0173041.57630.1216720.060836
M918.872936263456815.9309751.18470.2421040.121052
M106.7424156096180715.7963480.42680.6714490.335725
M11-5.5991357706761215.725664-0.35610.7233960.361698
t-1.546061746774810.200869-7.696900

\begin{tabular}{lllllllll}
\hline
Multiple Linear Regression - Ordinary Least Squares \tabularnewline
Variable & Parameter & S.D. & T-STATH0: parameter = 0 & 2-tail p-value & 1-tail p-value \tabularnewline
(Intercept) & 582.265639057551 & 24.044391 & 24.2163 & 0 & 0 \tabularnewline
X & 1.75858938712907 & 1.04319 & 1.6858 & 0.098467 & 0.049234 \tabularnewline
M1 & -3.13436250319707 & 15.126943 & -0.2072 & 0.836746 & 0.418373 \tabularnewline
M2 & -15.9053730581449 & 15.88376 & -1.0014 & 0.32178 & 0.16089 \tabularnewline
M3 & -25.5924034907366 & 15.915677 & -1.608 & 0.114533 & 0.057267 \tabularnewline
M4 & -31.8332314091302 & 15.940638 & -1.997 & 0.051636 & 0.025818 \tabularnewline
M5 & -40.0057953604147 & 15.912614 & -2.5141 & 0.015417 & 0.007708 \tabularnewline
M6 & -38.0224822175212 & 15.9634 & -2.3819 & 0.021326 & 0.010663 \tabularnewline
M7 & 14.4773770150556 & 15.991756 & 0.9053 & 0.369923 & 0.184961 \tabularnewline
M8 & 25.2475798231175 & 16.017304 & 1.5763 & 0.121672 & 0.060836 \tabularnewline
M9 & 18.8729362634568 & 15.930975 & 1.1847 & 0.242104 & 0.121052 \tabularnewline
M10 & 6.74241560961807 & 15.796348 & 0.4268 & 0.671449 & 0.335725 \tabularnewline
M11 & -5.59913577067612 & 15.725664 & -0.3561 & 0.723396 & 0.361698 \tabularnewline
t & -1.54606174677481 & 0.200869 & -7.6969 & 0 & 0 \tabularnewline
\hline
\end{tabular}
%Source: https://freestatistics.org/blog/index.php?pk=58486&T=2

[TABLE]
[ROW][C]Multiple Linear Regression - Ordinary Least Squares[/C][/ROW]
[ROW][C]Variable[/C][C]Parameter[/C][C]S.D.[/C][C]T-STATH0: parameter = 0[/C][C]2-tail p-value[/C][C]1-tail p-value[/C][/ROW]
[ROW][C](Intercept)[/C][C]582.265639057551[/C][C]24.044391[/C][C]24.2163[/C][C]0[/C][C]0[/C][/ROW]
[ROW][C]X[/C][C]1.75858938712907[/C][C]1.04319[/C][C]1.6858[/C][C]0.098467[/C][C]0.049234[/C][/ROW]
[ROW][C]M1[/C][C]-3.13436250319707[/C][C]15.126943[/C][C]-0.2072[/C][C]0.836746[/C][C]0.418373[/C][/ROW]
[ROW][C]M2[/C][C]-15.9053730581449[/C][C]15.88376[/C][C]-1.0014[/C][C]0.32178[/C][C]0.16089[/C][/ROW]
[ROW][C]M3[/C][C]-25.5924034907366[/C][C]15.915677[/C][C]-1.608[/C][C]0.114533[/C][C]0.057267[/C][/ROW]
[ROW][C]M4[/C][C]-31.8332314091302[/C][C]15.940638[/C][C]-1.997[/C][C]0.051636[/C][C]0.025818[/C][/ROW]
[ROW][C]M5[/C][C]-40.0057953604147[/C][C]15.912614[/C][C]-2.5141[/C][C]0.015417[/C][C]0.007708[/C][/ROW]
[ROW][C]M6[/C][C]-38.0224822175212[/C][C]15.9634[/C][C]-2.3819[/C][C]0.021326[/C][C]0.010663[/C][/ROW]
[ROW][C]M7[/C][C]14.4773770150556[/C][C]15.991756[/C][C]0.9053[/C][C]0.369923[/C][C]0.184961[/C][/ROW]
[ROW][C]M8[/C][C]25.2475798231175[/C][C]16.017304[/C][C]1.5763[/C][C]0.121672[/C][C]0.060836[/C][/ROW]
[ROW][C]M9[/C][C]18.8729362634568[/C][C]15.930975[/C][C]1.1847[/C][C]0.242104[/C][C]0.121052[/C][/ROW]
[ROW][C]M10[/C][C]6.74241560961807[/C][C]15.796348[/C][C]0.4268[/C][C]0.671449[/C][C]0.335725[/C][/ROW]
[ROW][C]M11[/C][C]-5.59913577067612[/C][C]15.725664[/C][C]-0.3561[/C][C]0.723396[/C][C]0.361698[/C][/ROW]
[ROW][C]t[/C][C]-1.54606174677481[/C][C]0.200869[/C][C]-7.6969[/C][C]0[/C][C]0[/C][/ROW]
[/TABLE]
Source: https://freestatistics.org/blog/index.php?pk=58486&T=2

Globally Unique Identifier (entire table): ba.freestatistics.org/blog/index.php?pk=58486&T=2

As an alternative you can also use a QR Code:  

The GUIDs for individual cells are displayed in the table below:

Multiple Linear Regression - Ordinary Least Squares
VariableParameterS.D.T-STATH0: parameter = 02-tail p-value1-tail p-value
(Intercept)582.26563905755124.04439124.216300
X1.758589387129071.043191.68580.0984670.049234
M1-3.1343625031970715.126943-0.20720.8367460.418373
M2-15.905373058144915.88376-1.00140.321780.16089
M3-25.592403490736615.915677-1.6080.1145330.057267
M4-31.833231409130215.940638-1.9970.0516360.025818
M5-40.005795360414715.912614-2.51410.0154170.007708
M6-38.022482217521215.9634-2.38190.0213260.010663
M714.477377015055615.9917560.90530.3699230.184961
M825.247579823117516.0173041.57630.1216720.060836
M918.872936263456815.9309751.18470.2421040.121052
M106.7424156096180715.7963480.42680.6714490.335725
M11-5.5991357706761215.725664-0.35610.7233960.361698
t-1.546061746774810.200869-7.696900


Multiple Linear Regression - Regression Statistics
Multiple R0.850876194482518
R-squared0.723990298337052
Adjusted R-squared0.647647189366449
F-TEST (value)9.48337457170938
F-TEST (DF numerator)13
F-TEST (DF denominator)47
p-value3.27576876735236e-09
Multiple Linear Regression - Residual Statistics
Residual Standard Deviation24.8221773982055
Sum Squared Residuals28958.6030670352

\begin{tabular}{lllllllll}
\hline
Multiple Linear Regression - Regression Statistics \tabularnewline
Multiple R & 0.850876194482518 \tabularnewline
R-squared & 0.723990298337052 \tabularnewline
Adjusted R-squared & 0.647647189366449 \tabularnewline
F-TEST (value) & 9.48337457170938 \tabularnewline
F-TEST (DF numerator) & 13 \tabularnewline
F-TEST (DF denominator) & 47 \tabularnewline
p-value & 3.27576876735236e-09 \tabularnewline
Multiple Linear Regression - Residual Statistics \tabularnewline
Residual Standard Deviation & 24.8221773982055 \tabularnewline
Sum Squared Residuals & 28958.6030670352 \tabularnewline
\hline
\end{tabular}
%Source: https://freestatistics.org/blog/index.php?pk=58486&T=3

[TABLE]
[ROW][C]Multiple Linear Regression - Regression Statistics[/C][/ROW]
[ROW][C]Multiple R[/C][C]0.850876194482518[/C][/ROW]
[ROW][C]R-squared[/C][C]0.723990298337052[/C][/ROW]
[ROW][C]Adjusted R-squared[/C][C]0.647647189366449[/C][/ROW]
[ROW][C]F-TEST (value)[/C][C]9.48337457170938[/C][/ROW]
[ROW][C]F-TEST (DF numerator)[/C][C]13[/C][/ROW]
[ROW][C]F-TEST (DF denominator)[/C][C]47[/C][/ROW]
[ROW][C]p-value[/C][C]3.27576876735236e-09[/C][/ROW]
[ROW][C]Multiple Linear Regression - Residual Statistics[/C][/ROW]
[ROW][C]Residual Standard Deviation[/C][C]24.8221773982055[/C][/ROW]
[ROW][C]Sum Squared Residuals[/C][C]28958.6030670352[/C][/ROW]
[/TABLE]
Source: https://freestatistics.org/blog/index.php?pk=58486&T=3

Globally Unique Identifier (entire table): ba.freestatistics.org/blog/index.php?pk=58486&T=3

As an alternative you can also use a QR Code:  

The GUIDs for individual cells are displayed in the table below:

Multiple Linear Regression - Regression Statistics
Multiple R0.850876194482518
R-squared0.723990298337052
Adjusted R-squared0.647647189366449
F-TEST (value)9.48337457170938
F-TEST (DF numerator)13
F-TEST (DF denominator)47
p-value3.27576876735236e-09
Multiple Linear Regression - Residual Statistics
Residual Standard Deviation24.8221773982055
Sum Squared Residuals28958.6030670352


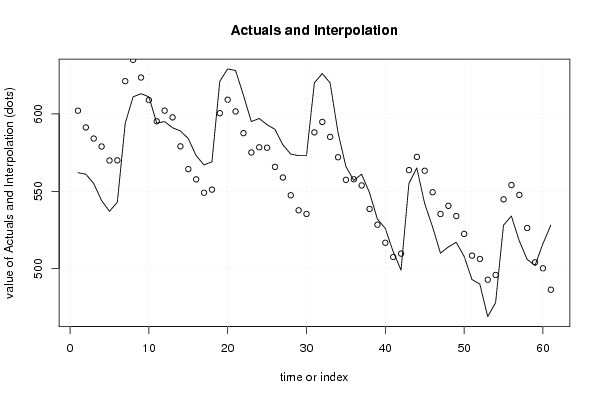
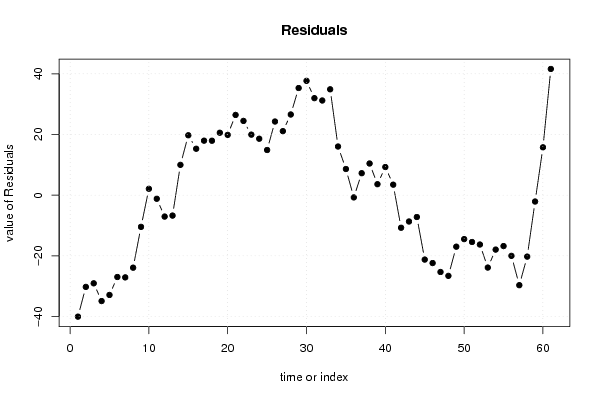
Multiple Linear Regression - Actuals, Interpolation, and Residuals
Time or IndexActualsInterpolationForecastResidualsPrediction Error
1562602.029607288672-40.0296072886724
2561591.229713761208-30.2297137612081
3555584.041377172239-29.0413771722385
4544578.892371587764-34.8923715877638
5537569.877181644556-32.877181644556
6543569.962715163249-26.9627151632489
7594621.092371587764-27.0923715877637
8611634.888845055586-23.8888450555864
9613623.450960974893-10.4509609748928
10611608.8950838807152.10491611928523
11594595.183329692359-1.18332969235863
12595602.050146735666-7.05014673566647
13591597.72144036312-6.72144036312042
14589579.0078945935759.99210540642488
15584564.25762363995119.7423763600495
16573557.70174654577215.2982534542275
17567549.0382744799917.9617255200094
18569551.05825632452517.9417436754746
19621600.42932336191120.5706766380888
20629609.1258876070619.8741123929404
21628601.5569001780526.4430998219501
22612587.52859990001124.4714000999894
23595575.04785828264519.9521417173552
24597578.39749655169518.6025034483055
25593578.11354576954514.8864542304547
26590565.73092179366524.2690782063354
27580558.89430308212121.1056969178792
28574547.41437570398126.5856242960186
29573537.69575000592235.3042499940779
30573535.31925838263437.6807416173657
31620588.03164525556531.9683547444348
32626594.79376117487231.2062388251283
33620585.11446648130734.8855335186929
34588571.96546089683216.0345391031677
35566557.3744120149128.62558798508829
36557557.734448325842-0.734448325841977
37561553.7574598307227.24254016927827
38549538.56109283543510.4389071645655
39532528.3831542883463.61684571165448
40526516.7273679714939.27263202850682
41511507.5363190895733.46368091042744
42499509.73215987282-10.7321598728203
43555563.675559316742-8.67555931674166
44565572.196264623177-7.19626462317713
45542563.220405684464-21.2204056844642
46527549.367964345138-22.3679643451378
47510535.304492279356-25.3044922793559
48514540.588578874248-26.5885788742476
49517533.973706298434-16.9737062984337
50508522.470377016118-14.4703770161176
51493508.423541817345-15.4235418173446
52490506.264138190989-16.2641381909892
53469492.852474779959-23.8524747799588
54478495.927610256771-17.9276102567711
55528544.771100478018-16.7711004780182
56534553.995241539305-19.9952415393053
57518547.657266681286-29.6572666812860
58506526.242890977305-20.2428909773046
59502504.089907730729-2.08990773072896
60516500.2293295125515.7706704874505
61528486.40424044950641.5957595504935

\begin{tabular}{lllllllll}
\hline
Multiple Linear Regression - Actuals, Interpolation, and Residuals \tabularnewline
Time or Index & Actuals & InterpolationForecast & ResidualsPrediction Error \tabularnewline
1 & 562 & 602.029607288672 & -40.0296072886724 \tabularnewline
2 & 561 & 591.229713761208 & -30.2297137612081 \tabularnewline
3 & 555 & 584.041377172239 & -29.0413771722385 \tabularnewline
4 & 544 & 578.892371587764 & -34.8923715877638 \tabularnewline
5 & 537 & 569.877181644556 & -32.877181644556 \tabularnewline
6 & 543 & 569.962715163249 & -26.9627151632489 \tabularnewline
7 & 594 & 621.092371587764 & -27.0923715877637 \tabularnewline
8 & 611 & 634.888845055586 & -23.8888450555864 \tabularnewline
9 & 613 & 623.450960974893 & -10.4509609748928 \tabularnewline
10 & 611 & 608.895083880715 & 2.10491611928523 \tabularnewline
11 & 594 & 595.183329692359 & -1.18332969235863 \tabularnewline
12 & 595 & 602.050146735666 & -7.05014673566647 \tabularnewline
13 & 591 & 597.72144036312 & -6.72144036312042 \tabularnewline
14 & 589 & 579.007894593575 & 9.99210540642488 \tabularnewline
15 & 584 & 564.257623639951 & 19.7423763600495 \tabularnewline
16 & 573 & 557.701746545772 & 15.2982534542275 \tabularnewline
17 & 567 & 549.03827447999 & 17.9617255200094 \tabularnewline
18 & 569 & 551.058256324525 & 17.9417436754746 \tabularnewline
19 & 621 & 600.429323361911 & 20.5706766380888 \tabularnewline
20 & 629 & 609.12588760706 & 19.8741123929404 \tabularnewline
21 & 628 & 601.55690017805 & 26.4430998219501 \tabularnewline
22 & 612 & 587.528599900011 & 24.4714000999894 \tabularnewline
23 & 595 & 575.047858282645 & 19.9521417173552 \tabularnewline
24 & 597 & 578.397496551695 & 18.6025034483055 \tabularnewline
25 & 593 & 578.113545769545 & 14.8864542304547 \tabularnewline
26 & 590 & 565.730921793665 & 24.2690782063354 \tabularnewline
27 & 580 & 558.894303082121 & 21.1056969178792 \tabularnewline
28 & 574 & 547.414375703981 & 26.5856242960186 \tabularnewline
29 & 573 & 537.695750005922 & 35.3042499940779 \tabularnewline
30 & 573 & 535.319258382634 & 37.6807416173657 \tabularnewline
31 & 620 & 588.031645255565 & 31.9683547444348 \tabularnewline
32 & 626 & 594.793761174872 & 31.2062388251283 \tabularnewline
33 & 620 & 585.114466481307 & 34.8855335186929 \tabularnewline
34 & 588 & 571.965460896832 & 16.0345391031677 \tabularnewline
35 & 566 & 557.374412014912 & 8.62558798508829 \tabularnewline
36 & 557 & 557.734448325842 & -0.734448325841977 \tabularnewline
37 & 561 & 553.757459830722 & 7.24254016927827 \tabularnewline
38 & 549 & 538.561092835435 & 10.4389071645655 \tabularnewline
39 & 532 & 528.383154288346 & 3.61684571165448 \tabularnewline
40 & 526 & 516.727367971493 & 9.27263202850682 \tabularnewline
41 & 511 & 507.536319089573 & 3.46368091042744 \tabularnewline
42 & 499 & 509.73215987282 & -10.7321598728203 \tabularnewline
43 & 555 & 563.675559316742 & -8.67555931674166 \tabularnewline
44 & 565 & 572.196264623177 & -7.19626462317713 \tabularnewline
45 & 542 & 563.220405684464 & -21.2204056844642 \tabularnewline
46 & 527 & 549.367964345138 & -22.3679643451378 \tabularnewline
47 & 510 & 535.304492279356 & -25.3044922793559 \tabularnewline
48 & 514 & 540.588578874248 & -26.5885788742476 \tabularnewline
49 & 517 & 533.973706298434 & -16.9737062984337 \tabularnewline
50 & 508 & 522.470377016118 & -14.4703770161176 \tabularnewline
51 & 493 & 508.423541817345 & -15.4235418173446 \tabularnewline
52 & 490 & 506.264138190989 & -16.2641381909892 \tabularnewline
53 & 469 & 492.852474779959 & -23.8524747799588 \tabularnewline
54 & 478 & 495.927610256771 & -17.9276102567711 \tabularnewline
55 & 528 & 544.771100478018 & -16.7711004780182 \tabularnewline
56 & 534 & 553.995241539305 & -19.9952415393053 \tabularnewline
57 & 518 & 547.657266681286 & -29.6572666812860 \tabularnewline
58 & 506 & 526.242890977305 & -20.2428909773046 \tabularnewline
59 & 502 & 504.089907730729 & -2.08990773072896 \tabularnewline
60 & 516 & 500.22932951255 & 15.7706704874505 \tabularnewline
61 & 528 & 486.404240449506 & 41.5957595504935 \tabularnewline
\hline
\end{tabular}
%Source: https://freestatistics.org/blog/index.php?pk=58486&T=4

[TABLE]
[ROW][C]Multiple Linear Regression - Actuals, Interpolation, and Residuals[/C][/ROW]
[ROW][C]Time or Index[/C][C]Actuals[/C][C]InterpolationForecast[/C][C]ResidualsPrediction Error[/C][/ROW]
[ROW][C]1[/C][C]562[/C][C]602.029607288672[/C][C]-40.0296072886724[/C][/ROW]
[ROW][C]2[/C][C]561[/C][C]591.229713761208[/C][C]-30.2297137612081[/C][/ROW]
[ROW][C]3[/C][C]555[/C][C]584.041377172239[/C][C]-29.0413771722385[/C][/ROW]
[ROW][C]4[/C][C]544[/C][C]578.892371587764[/C][C]-34.8923715877638[/C][/ROW]
[ROW][C]5[/C][C]537[/C][C]569.877181644556[/C][C]-32.877181644556[/C][/ROW]
[ROW][C]6[/C][C]543[/C][C]569.962715163249[/C][C]-26.9627151632489[/C][/ROW]
[ROW][C]7[/C][C]594[/C][C]621.092371587764[/C][C]-27.0923715877637[/C][/ROW]
[ROW][C]8[/C][C]611[/C][C]634.888845055586[/C][C]-23.8888450555864[/C][/ROW]
[ROW][C]9[/C][C]613[/C][C]623.450960974893[/C][C]-10.4509609748928[/C][/ROW]
[ROW][C]10[/C][C]611[/C][C]608.895083880715[/C][C]2.10491611928523[/C][/ROW]
[ROW][C]11[/C][C]594[/C][C]595.183329692359[/C][C]-1.18332969235863[/C][/ROW]
[ROW][C]12[/C][C]595[/C][C]602.050146735666[/C][C]-7.05014673566647[/C][/ROW]
[ROW][C]13[/C][C]591[/C][C]597.72144036312[/C][C]-6.72144036312042[/C][/ROW]
[ROW][C]14[/C][C]589[/C][C]579.007894593575[/C][C]9.99210540642488[/C][/ROW]
[ROW][C]15[/C][C]584[/C][C]564.257623639951[/C][C]19.7423763600495[/C][/ROW]
[ROW][C]16[/C][C]573[/C][C]557.701746545772[/C][C]15.2982534542275[/C][/ROW]
[ROW][C]17[/C][C]567[/C][C]549.03827447999[/C][C]17.9617255200094[/C][/ROW]
[ROW][C]18[/C][C]569[/C][C]551.058256324525[/C][C]17.9417436754746[/C][/ROW]
[ROW][C]19[/C][C]621[/C][C]600.429323361911[/C][C]20.5706766380888[/C][/ROW]
[ROW][C]20[/C][C]629[/C][C]609.12588760706[/C][C]19.8741123929404[/C][/ROW]
[ROW][C]21[/C][C]628[/C][C]601.55690017805[/C][C]26.4430998219501[/C][/ROW]
[ROW][C]22[/C][C]612[/C][C]587.528599900011[/C][C]24.4714000999894[/C][/ROW]
[ROW][C]23[/C][C]595[/C][C]575.047858282645[/C][C]19.9521417173552[/C][/ROW]
[ROW][C]24[/C][C]597[/C][C]578.397496551695[/C][C]18.6025034483055[/C][/ROW]
[ROW][C]25[/C][C]593[/C][C]578.113545769545[/C][C]14.8864542304547[/C][/ROW]
[ROW][C]26[/C][C]590[/C][C]565.730921793665[/C][C]24.2690782063354[/C][/ROW]
[ROW][C]27[/C][C]580[/C][C]558.894303082121[/C][C]21.1056969178792[/C][/ROW]
[ROW][C]28[/C][C]574[/C][C]547.414375703981[/C][C]26.5856242960186[/C][/ROW]
[ROW][C]29[/C][C]573[/C][C]537.695750005922[/C][C]35.3042499940779[/C][/ROW]
[ROW][C]30[/C][C]573[/C][C]535.319258382634[/C][C]37.6807416173657[/C][/ROW]
[ROW][C]31[/C][C]620[/C][C]588.031645255565[/C][C]31.9683547444348[/C][/ROW]
[ROW][C]32[/C][C]626[/C][C]594.793761174872[/C][C]31.2062388251283[/C][/ROW]
[ROW][C]33[/C][C]620[/C][C]585.114466481307[/C][C]34.8855335186929[/C][/ROW]
[ROW][C]34[/C][C]588[/C][C]571.965460896832[/C][C]16.0345391031677[/C][/ROW]
[ROW][C]35[/C][C]566[/C][C]557.374412014912[/C][C]8.62558798508829[/C][/ROW]
[ROW][C]36[/C][C]557[/C][C]557.734448325842[/C][C]-0.734448325841977[/C][/ROW]
[ROW][C]37[/C][C]561[/C][C]553.757459830722[/C][C]7.24254016927827[/C][/ROW]
[ROW][C]38[/C][C]549[/C][C]538.561092835435[/C][C]10.4389071645655[/C][/ROW]
[ROW][C]39[/C][C]532[/C][C]528.383154288346[/C][C]3.61684571165448[/C][/ROW]
[ROW][C]40[/C][C]526[/C][C]516.727367971493[/C][C]9.27263202850682[/C][/ROW]
[ROW][C]41[/C][C]511[/C][C]507.536319089573[/C][C]3.46368091042744[/C][/ROW]
[ROW][C]42[/C][C]499[/C][C]509.73215987282[/C][C]-10.7321598728203[/C][/ROW]
[ROW][C]43[/C][C]555[/C][C]563.675559316742[/C][C]-8.67555931674166[/C][/ROW]
[ROW][C]44[/C][C]565[/C][C]572.196264623177[/C][C]-7.19626462317713[/C][/ROW]
[ROW][C]45[/C][C]542[/C][C]563.220405684464[/C][C]-21.2204056844642[/C][/ROW]
[ROW][C]46[/C][C]527[/C][C]549.367964345138[/C][C]-22.3679643451378[/C][/ROW]
[ROW][C]47[/C][C]510[/C][C]535.304492279356[/C][C]-25.3044922793559[/C][/ROW]
[ROW][C]48[/C][C]514[/C][C]540.588578874248[/C][C]-26.5885788742476[/C][/ROW]
[ROW][C]49[/C][C]517[/C][C]533.973706298434[/C][C]-16.9737062984337[/C][/ROW]
[ROW][C]50[/C][C]508[/C][C]522.470377016118[/C][C]-14.4703770161176[/C][/ROW]
[ROW][C]51[/C][C]493[/C][C]508.423541817345[/C][C]-15.4235418173446[/C][/ROW]
[ROW][C]52[/C][C]490[/C][C]506.264138190989[/C][C]-16.2641381909892[/C][/ROW]
[ROW][C]53[/C][C]469[/C][C]492.852474779959[/C][C]-23.8524747799588[/C][/ROW]
[ROW][C]54[/C][C]478[/C][C]495.927610256771[/C][C]-17.9276102567711[/C][/ROW]
[ROW][C]55[/C][C]528[/C][C]544.771100478018[/C][C]-16.7711004780182[/C][/ROW]
[ROW][C]56[/C][C]534[/C][C]553.995241539305[/C][C]-19.9952415393053[/C][/ROW]
[ROW][C]57[/C][C]518[/C][C]547.657266681286[/C][C]-29.6572666812860[/C][/ROW]
[ROW][C]58[/C][C]506[/C][C]526.242890977305[/C][C]-20.2428909773046[/C][/ROW]
[ROW][C]59[/C][C]502[/C][C]504.089907730729[/C][C]-2.08990773072896[/C][/ROW]
[ROW][C]60[/C][C]516[/C][C]500.22932951255[/C][C]15.7706704874505[/C][/ROW]
[ROW][C]61[/C][C]528[/C][C]486.404240449506[/C][C]41.5957595504935[/C][/ROW]
[/TABLE]
Source: https://freestatistics.org/blog/index.php?pk=58486&T=4

Globally Unique Identifier (entire table): ba.freestatistics.org/blog/index.php?pk=58486&T=4

As an alternative you can also use a QR Code:  

The GUIDs for individual cells are displayed in the table below:

Multiple Linear Regression - Actuals, Interpolation, and Residuals
Time or IndexActualsInterpolationForecastResidualsPrediction Error
1562602.029607288672-40.0296072886724
2561591.229713761208-30.2297137612081
3555584.041377172239-29.0413771722385
4544578.892371587764-34.8923715877638
5537569.877181644556-32.877181644556
6543569.962715163249-26.9627151632489
7594621.092371587764-27.0923715877637
8611634.888845055586-23.8888450555864
9613623.450960974893-10.4509609748928
10611608.8950838807152.10491611928523
11594595.183329692359-1.18332969235863
12595602.050146735666-7.05014673566647
13591597.72144036312-6.72144036312042
14589579.0078945935759.99210540642488
15584564.25762363995119.7423763600495
16573557.70174654577215.2982534542275
17567549.0382744799917.9617255200094
18569551.05825632452517.9417436754746
19621600.42932336191120.5706766380888
20629609.1258876070619.8741123929404
21628601.5569001780526.4430998219501
22612587.52859990001124.4714000999894
23595575.04785828264519.9521417173552
24597578.39749655169518.6025034483055
25593578.11354576954514.8864542304547
26590565.73092179366524.2690782063354
27580558.89430308212121.1056969178792
28574547.41437570398126.5856242960186
29573537.69575000592235.3042499940779
30573535.31925838263437.6807416173657
31620588.03164525556531.9683547444348
32626594.79376117487231.2062388251283
33620585.11446648130734.8855335186929
34588571.96546089683216.0345391031677
35566557.3744120149128.62558798508829
36557557.734448325842-0.734448325841977
37561553.7574598307227.24254016927827
38549538.56109283543510.4389071645655
39532528.3831542883463.61684571165448
40526516.7273679714939.27263202850682
41511507.5363190895733.46368091042744
42499509.73215987282-10.7321598728203
43555563.675559316742-8.67555931674166
44565572.196264623177-7.19626462317713
45542563.220405684464-21.2204056844642
46527549.367964345138-22.3679643451378
47510535.304492279356-25.3044922793559
48514540.588578874248-26.5885788742476
49517533.973706298434-16.9737062984337
50508522.470377016118-14.4703770161176
51493508.423541817345-15.4235418173446
52490506.264138190989-16.2641381909892
53469492.852474779959-23.8524747799588
54478495.927610256771-17.9276102567711
55528544.771100478018-16.7711004780182
56534553.995241539305-19.9952415393053
57518547.657266681286-29.6572666812860
58506526.242890977305-20.2428909773046
59502504.089907730729-2.08990773072896
60516500.2293295125515.7706704874505
61528486.40424044950641.5957595504935


Goldfeld-Quandt test for Heteroskedasticity
p-valuesAlternative Hypothesis
breakpoint indexgreater2-sidedless
176.29250140119729e-050.0001258500280239460.999937074985988
186.60327958204104e-050.0001320655916408210.99993396720418
198.0168944908761e-061.60337889817522e-050.99999198310551
200.0002494547994328160.0004989095988656320.999750545200567
210.0007581975025070310.001516395005014060.999241802497493
220.01901896518256510.03803793036513030.980981034817435
230.04417704304979850.0883540860995970.955822956950201
240.04487559654274850.0897511930854970.955124403457251
250.05688125607964350.1137625121592870.943118743920357
260.05113679891444670.1022735978288930.948863201085553
270.0525122071180050.105024414236010.947487792881995
280.03414728907914980.06829457815829960.96585271092085
290.0363186938065740.0726373876131480.963681306193426
300.03883932572905560.07767865145811110.961160674270944
310.04724819934595070.09449639869190140.95275180065405
320.0725139975505450.1450279951010900.927486002449455
330.3452381793831690.6904763587663390.65476182061683
340.8885138564232470.2229722871535060.111486143576753
350.993928199317540.01214360136492060.00607180068246028
360.997287480805540.00542503838892170.00271251919446085
370.9990750015920980.001849996815803710.000924998407901855
380.9991031085206280.00179378295874310.00089689147937155
390.9997148580932250.0005702838135497080.000285141906774854
400.9989823973778220.002035205244356370.00101760262217819
410.999585779284940.000828441430120130.000414220715060065
420.9998314678945930.0003370642108133160.000168532105406658
430.9990866229864170.001826754027165510.000913377013582753
440.998987115601890.002025768796220520.00101288439811026

\begin{tabular}{lllllllll}
\hline
Goldfeld-Quandt test for Heteroskedasticity \tabularnewline
p-values & Alternative Hypothesis \tabularnewline
breakpoint index & greater & 2-sided & less \tabularnewline
17 & 6.29250140119729e-05 & 0.000125850028023946 & 0.999937074985988 \tabularnewline
18 & 6.60327958204104e-05 & 0.000132065591640821 & 0.99993396720418 \tabularnewline
19 & 8.0168944908761e-06 & 1.60337889817522e-05 & 0.99999198310551 \tabularnewline
20 & 0.000249454799432816 & 0.000498909598865632 & 0.999750545200567 \tabularnewline
21 & 0.000758197502507031 & 0.00151639500501406 & 0.999241802497493 \tabularnewline
22 & 0.0190189651825651 & 0.0380379303651303 & 0.980981034817435 \tabularnewline
23 & 0.0441770430497985 & 0.088354086099597 & 0.955822956950201 \tabularnewline
24 & 0.0448755965427485 & 0.089751193085497 & 0.955124403457251 \tabularnewline
25 & 0.0568812560796435 & 0.113762512159287 & 0.943118743920357 \tabularnewline
26 & 0.0511367989144467 & 0.102273597828893 & 0.948863201085553 \tabularnewline
27 & 0.052512207118005 & 0.10502441423601 & 0.947487792881995 \tabularnewline
28 & 0.0341472890791498 & 0.0682945781582996 & 0.96585271092085 \tabularnewline
29 & 0.036318693806574 & 0.072637387613148 & 0.963681306193426 \tabularnewline
30 & 0.0388393257290556 & 0.0776786514581111 & 0.961160674270944 \tabularnewline
31 & 0.0472481993459507 & 0.0944963986919014 & 0.95275180065405 \tabularnewline
32 & 0.072513997550545 & 0.145027995101090 & 0.927486002449455 \tabularnewline
33 & 0.345238179383169 & 0.690476358766339 & 0.65476182061683 \tabularnewline
34 & 0.888513856423247 & 0.222972287153506 & 0.111486143576753 \tabularnewline
35 & 0.99392819931754 & 0.0121436013649206 & 0.00607180068246028 \tabularnewline
36 & 0.99728748080554 & 0.0054250383889217 & 0.00271251919446085 \tabularnewline
37 & 0.999075001592098 & 0.00184999681580371 & 0.000924998407901855 \tabularnewline
38 & 0.999103108520628 & 0.0017937829587431 & 0.00089689147937155 \tabularnewline
39 & 0.999714858093225 & 0.000570283813549708 & 0.000285141906774854 \tabularnewline
40 & 0.998982397377822 & 0.00203520524435637 & 0.00101760262217819 \tabularnewline
41 & 0.99958577928494 & 0.00082844143012013 & 0.000414220715060065 \tabularnewline
42 & 0.999831467894593 & 0.000337064210813316 & 0.000168532105406658 \tabularnewline
43 & 0.999086622986417 & 0.00182675402716551 & 0.000913377013582753 \tabularnewline
44 & 0.99898711560189 & 0.00202576879622052 & 0.00101288439811026 \tabularnewline
\hline
\end{tabular}
%Source: https://freestatistics.org/blog/index.php?pk=58486&T=5

[TABLE]
[ROW][C]Goldfeld-Quandt test for Heteroskedasticity[/C][/ROW]
[ROW][C]p-values[/C][C]Alternative Hypothesis[/C][/ROW]
[ROW][C]breakpoint index[/C][C]greater[/C][C]2-sided[/C][C]less[/C][/ROW]
[ROW][C]17[/C][C]6.29250140119729e-05[/C][C]0.000125850028023946[/C][C]0.999937074985988[/C][/ROW]
[ROW][C]18[/C][C]6.60327958204104e-05[/C][C]0.000132065591640821[/C][C]0.99993396720418[/C][/ROW]
[ROW][C]19[/C][C]8.0168944908761e-06[/C][C]1.60337889817522e-05[/C][C]0.99999198310551[/C][/ROW]
[ROW][C]20[/C][C]0.000249454799432816[/C][C]0.000498909598865632[/C][C]0.999750545200567[/C][/ROW]
[ROW][C]21[/C][C]0.000758197502507031[/C][C]0.00151639500501406[/C][C]0.999241802497493[/C][/ROW]
[ROW][C]22[/C][C]0.0190189651825651[/C][C]0.0380379303651303[/C][C]0.980981034817435[/C][/ROW]
[ROW][C]23[/C][C]0.0441770430497985[/C][C]0.088354086099597[/C][C]0.955822956950201[/C][/ROW]
[ROW][C]24[/C][C]0.0448755965427485[/C][C]0.089751193085497[/C][C]0.955124403457251[/C][/ROW]
[ROW][C]25[/C][C]0.0568812560796435[/C][C]0.113762512159287[/C][C]0.943118743920357[/C][/ROW]
[ROW][C]26[/C][C]0.0511367989144467[/C][C]0.102273597828893[/C][C]0.948863201085553[/C][/ROW]
[ROW][C]27[/C][C]0.052512207118005[/C][C]0.10502441423601[/C][C]0.947487792881995[/C][/ROW]
[ROW][C]28[/C][C]0.0341472890791498[/C][C]0.0682945781582996[/C][C]0.96585271092085[/C][/ROW]
[ROW][C]29[/C][C]0.036318693806574[/C][C]0.072637387613148[/C][C]0.963681306193426[/C][/ROW]
[ROW][C]30[/C][C]0.0388393257290556[/C][C]0.0776786514581111[/C][C]0.961160674270944[/C][/ROW]
[ROW][C]31[/C][C]0.0472481993459507[/C][C]0.0944963986919014[/C][C]0.95275180065405[/C][/ROW]
[ROW][C]32[/C][C]0.072513997550545[/C][C]0.145027995101090[/C][C]0.927486002449455[/C][/ROW]
[ROW][C]33[/C][C]0.345238179383169[/C][C]0.690476358766339[/C][C]0.65476182061683[/C][/ROW]
[ROW][C]34[/C][C]0.888513856423247[/C][C]0.222972287153506[/C][C]0.111486143576753[/C][/ROW]
[ROW][C]35[/C][C]0.99392819931754[/C][C]0.0121436013649206[/C][C]0.00607180068246028[/C][/ROW]
[ROW][C]36[/C][C]0.99728748080554[/C][C]0.0054250383889217[/C][C]0.00271251919446085[/C][/ROW]
[ROW][C]37[/C][C]0.999075001592098[/C][C]0.00184999681580371[/C][C]0.000924998407901855[/C][/ROW]
[ROW][C]38[/C][C]0.999103108520628[/C][C]0.0017937829587431[/C][C]0.00089689147937155[/C][/ROW]
[ROW][C]39[/C][C]0.999714858093225[/C][C]0.000570283813549708[/C][C]0.000285141906774854[/C][/ROW]
[ROW][C]40[/C][C]0.998982397377822[/C][C]0.00203520524435637[/C][C]0.00101760262217819[/C][/ROW]
[ROW][C]41[/C][C]0.99958577928494[/C][C]0.00082844143012013[/C][C]0.000414220715060065[/C][/ROW]
[ROW][C]42[/C][C]0.999831467894593[/C][C]0.000337064210813316[/C][C]0.000168532105406658[/C][/ROW]
[ROW][C]43[/C][C]0.999086622986417[/C][C]0.00182675402716551[/C][C]0.000913377013582753[/C][/ROW]
[ROW][C]44[/C][C]0.99898711560189[/C][C]0.00202576879622052[/C][C]0.00101288439811026[/C][/ROW]
[/TABLE]
Source: https://freestatistics.org/blog/index.php?pk=58486&T=5

Globally Unique Identifier (entire table): ba.freestatistics.org/blog/index.php?pk=58486&T=5

As an alternative you can also use a QR Code:  

The GUIDs for individual cells are displayed in the table below:

Goldfeld-Quandt test for Heteroskedasticity
p-valuesAlternative Hypothesis
breakpoint indexgreater2-sidedless
176.29250140119729e-050.0001258500280239460.999937074985988
186.60327958204104e-050.0001320655916408210.99993396720418
198.0168944908761e-061.60337889817522e-050.99999198310551
200.0002494547994328160.0004989095988656320.999750545200567
210.0007581975025070310.001516395005014060.999241802497493
220.01901896518256510.03803793036513030.980981034817435
230.04417704304979850.0883540860995970.955822956950201
240.04487559654274850.0897511930854970.955124403457251
250.05688125607964350.1137625121592870.943118743920357
260.05113679891444670.1022735978288930.948863201085553
270.0525122071180050.105024414236010.947487792881995
280.03414728907914980.06829457815829960.96585271092085
290.0363186938065740.0726373876131480.963681306193426
300.03883932572905560.07767865145811110.961160674270944
310.04724819934595070.09449639869190140.95275180065405
320.0725139975505450.1450279951010900.927486002449455
330.3452381793831690.6904763587663390.65476182061683
340.8885138564232470.2229722871535060.111486143576753
350.993928199317540.01214360136492060.00607180068246028
360.997287480805540.00542503838892170.00271251919446085
370.9990750015920980.001849996815803710.000924998407901855
380.9991031085206280.00179378295874310.00089689147937155
390.9997148580932250.0005702838135497080.000285141906774854
400.9989823973778220.002035205244356370.00101760262217819
410.999585779284940.000828441430120130.000414220715060065
420.9998314678945930.0003370642108133160.000168532105406658
430.9990866229864170.001826754027165510.000913377013582753
440.998987115601890.002025768796220520.00101288439811026


Meta Analysis of Goldfeld-Quandt test for Heteroskedasticity
Description# significant tests% significant testsOK/NOK
1% type I error level140.5NOK
5% type I error level160.571428571428571NOK
10% type I error level220.785714285714286NOK

\begin{tabular}{lllllllll}
\hline
Meta Analysis of Goldfeld-Quandt test for Heteroskedasticity \tabularnewline
Description & # significant tests & % significant tests & OK/NOK \tabularnewline
1% type I error level & 14 & 0.5 & NOK \tabularnewline
5% type I error level & 16 & 0.571428571428571 & NOK \tabularnewline
10% type I error level & 22 & 0.785714285714286 & NOK \tabularnewline
\hline
\end{tabular}
%Source: https://freestatistics.org/blog/index.php?pk=58486&T=6

[TABLE]
[ROW][C]Meta Analysis of Goldfeld-Quandt test for Heteroskedasticity[/C][/ROW]
[ROW][C]Description[/C][C]# significant tests[/C][C]% significant tests[/C][C]OK/NOK[/C][/ROW]
[ROW][C]1% type I error level[/C][C]14[/C][C]0.5[/C][C]NOK[/C][/ROW]
[ROW][C]5% type I error level[/C][C]16[/C][C]0.571428571428571[/C][C]NOK[/C][/ROW]
[ROW][C]10% type I error level[/C][C]22[/C][C]0.785714285714286[/C][C]NOK[/C][/ROW]
[/TABLE]
Source: https://freestatistics.org/blog/index.php?pk=58486&T=6

Globally Unique Identifier (entire table): ba.freestatistics.org/blog/index.php?pk=58486&T=6

As an alternative you can also use a QR Code:  

The GUIDs for individual cells are displayed in the table below:

Meta Analysis of Goldfeld-Quandt test for Heteroskedasticity
Description# significant tests% significant testsOK/NOK
1% type I error level140.5NOK
5% type I error level160.571428571428571NOK
10% type I error level220.785714285714286NOK


Parameters (Session):
par1 = 1 ; par2 = Include Monthly Dummies ; par3 = Linear Trend ;
Parameters (R input):
par1 = 1 ; par2 = Include Monthly Dummies ; par3 = Linear Trend ;
R code (references can be found in the software module):
library(lattice)
library(lmtest)
n25 <- 25 #minimum number of obs. for Goldfeld-Quandt test
par1 <- as.numeric(par1)
x <- t(y)
k <- length(x[1,])
n <- length(x[,1])
x1 <- cbind(x[,par1], x[,1:k!=par1])
mycolnames <- c(colnames(x)[par1], colnames(x)[1:k!=par1])
colnames(x1) <- mycolnames #colnames(x)[par1]
x <- x1
if (par3 == 'First Differences'){
x2 <- array(0, dim=c(n-1,k), dimnames=list(1:(n-1), paste('(1-B)',colnames(x),sep='')))
for (i in 1:n-1) {
for (j in 1:k) {
x2[i,j] <- x[i+1,j] - x[i,j]
}
}
x <- x2
}
if (par2 == 'Include Monthly Dummies'){
x2 <- array(0, dim=c(n,11), dimnames=list(1:n, paste('M', seq(1:11), sep ='')))
for (i in 1:11){
x2[seq(i,n,12),i] <- 1
}
x <- cbind(x, x2)
}
if (par2 == 'Include Quarterly Dummies'){
x2 <- array(0, dim=c(n,3), dimnames=list(1:n, paste('Q', seq(1:3), sep ='')))
for (i in 1:3){
x2[seq(i,n,4),i] <- 1
}
x <- cbind(x, x2)
}
k <- length(x[1,])
if (par3 == 'Linear Trend'){
x <- cbind(x, c(1:n))
colnames(x)[k+1] <- 't'
}
x
k <- length(x[1,])
df <- as.data.frame(x)
(mylm <- lm(df))
(mysum <- summary(mylm))
if (n > n25) {
kp3 <- k + 3
nmkm3 <- n - k - 3
gqarr <- array(NA, dim=c(nmkm3-kp3+1,3))
numgqtests <- 0
numsignificant1 <- 0
numsignificant5 <- 0
numsignificant10 <- 0
for (mypoint in kp3:nmkm3) {
j <- 0
numgqtests <- numgqtests + 1
for (myalt in c('greater', 'two.sided', 'less')) {
j <- j + 1
gqarr[mypoint-kp3+1,j] <- gqtest(mylm, point=mypoint, alternative=myalt)$p.value
}
if (gqarr[mypoint-kp3+1,2] < 0.01) numsignificant1 <- numsignificant1 + 1
if (gqarr[mypoint-kp3+1,2] < 0.05) numsignificant5 <- numsignificant5 + 1
if (gqarr[mypoint-kp3+1,2] < 0.10) numsignificant10 <- numsignificant10 + 1
}
gqarr
}
bitmap(file='test0.png')
plot(x[,1], type='l', main='Actuals and Interpolation', ylab='value of Actuals and Interpolation (dots)', xlab='time or index')
points(x[,1]-mysum$resid)
grid()
dev.off()
bitmap(file='test1.png')
plot(mysum$resid, type='b', pch=19, main='Residuals', ylab='value of Residuals', xlab='time or index')
grid()
dev.off()
bitmap(file='test2.png')
hist(mysum$resid, main='Residual Histogram', xlab='values of Residuals')
grid()
dev.off()
bitmap(file='test3.png')
densityplot(~mysum$resid,col='black',main='Residual Density Plot', xlab='values of Residuals')
dev.off()
bitmap(file='test4.png')
qqnorm(mysum$resid, main='Residual Normal Q-Q Plot')
qqline(mysum$resid)
grid()
dev.off()
(myerror <- as.ts(mysum$resid))
bitmap(file='test5.png')
dum <- cbind(lag(myerror,k=1),myerror)
dum
dum1 <- dum[2:length(myerror),]
dum1
z <- as.data.frame(dum1)
z
plot(z,main=paste('Residual Lag plot, lowess, and regression line'), ylab='values of Residuals', xlab='lagged values of Residuals')
lines(lowess(z))
abline(lm(z))
grid()
dev.off()
bitmap(file='test6.png')
acf(mysum$resid, lag.max=length(mysum$resid)/2, main='Residual Autocorrelation Function')
grid()
dev.off()
bitmap(file='test7.png')
pacf(mysum$resid, lag.max=length(mysum$resid)/2, main='Residual Partial Autocorrelation Function')
grid()
dev.off()
bitmap(file='test8.png')
opar <- par(mfrow = c(2,2), oma = c(0, 0, 1.1, 0))
plot(mylm, las = 1, sub='Residual Diagnostics')
par(opar)
dev.off()
if (n > n25) {
bitmap(file='test9.png')
plot(kp3:nmkm3,gqarr[,2], main='Goldfeld-Quandt test',ylab='2-sided p-value',xlab='breakpoint')
grid()
dev.off()
}
load(file='createtable')
a<-table.start()
a<-table.row.start(a)
a<-table.element(a, 'Multiple Linear Regression - Estimated Regression Equation', 1, TRUE)
a<-table.row.end(a)
myeq <- colnames(x)[1]
myeq <- paste(myeq, '[t] = ', sep='')
for (i in 1:k){
if (mysum$coefficients[i,1] > 0) myeq <- paste(myeq, '+', '')
myeq <- paste(myeq, mysum$coefficients[i,1], sep=' ')
if (rownames(mysum$coefficients)[i] != '(Intercept)') {
myeq <- paste(myeq, rownames(mysum$coefficients)[i], sep='')
if (rownames(mysum$coefficients)[i] != 't') myeq <- paste(myeq, '[t]', sep='')
}
}
myeq <- paste(myeq, ' + e[t]')
a<-table.row.start(a)
a<-table.element(a, myeq)
a<-table.row.end(a)
a<-table.end(a)
table.save(a,file='mytable1.tab')
a<-table.start()
a<-table.row.start(a)
a<-table.element(a,hyperlink('ols1.htm','Multiple Linear Regression - Ordinary Least Squares',''), 6, TRUE)
a<-table.row.end(a)
a<-table.row.start(a)
a<-table.element(a,'Variable',header=TRUE)
a<-table.element(a,'Parameter',header=TRUE)
a<-table.element(a,'S.D.',header=TRUE)
a<-table.element(a,'T-STAT
H0: parameter = 0',header=TRUE)
a<-table.element(a,'2-tail p-value',header=TRUE)
a<-table.element(a,'1-tail p-value',header=TRUE)
a<-table.row.end(a)
for (i in 1:k){
a<-table.row.start(a)
a<-table.element(a,rownames(mysum$coefficients)[i],header=TRUE)
a<-table.element(a,mysum$coefficients[i,1])
a<-table.element(a, round(mysum$coefficients[i,2],6))
a<-table.element(a, round(mysum$coefficients[i,3],4))
a<-table.element(a, round(mysum$coefficients[i,4],6))
a<-table.element(a, round(mysum$coefficients[i,4]/2,6))
a<-table.row.end(a)
}
a<-table.end(a)
table.save(a,file='mytable2.tab')
a<-table.start()
a<-table.row.start(a)
a<-table.element(a, 'Multiple Linear Regression - Regression Statistics', 2, TRUE)
a<-table.row.end(a)
a<-table.row.start(a)
a<-table.element(a, 'Multiple R',1,TRUE)
a<-table.element(a, sqrt(mysum$r.squared))
a<-table.row.end(a)
a<-table.row.start(a)
a<-table.element(a, 'R-squared',1,TRUE)
a<-table.element(a, mysum$r.squared)
a<-table.row.end(a)
a<-table.row.start(a)
a<-table.element(a, 'Adjusted R-squared',1,TRUE)
a<-table.element(a, mysum$adj.r.squared)
a<-table.row.end(a)
a<-table.row.start(a)
a<-table.element(a, 'F-TEST (value)',1,TRUE)
a<-table.element(a, mysum$fstatistic[1])
a<-table.row.end(a)
a<-table.row.start(a)
a<-table.element(a, 'F-TEST (DF numerator)',1,TRUE)
a<-table.element(a, mysum$fstatistic[2])
a<-table.row.end(a)
a<-table.row.start(a)
a<-table.element(a, 'F-TEST (DF denominator)',1,TRUE)
a<-table.element(a, mysum$fstatistic[3])
a<-table.row.end(a)
a<-table.row.start(a)
a<-table.element(a, 'p-value',1,TRUE)
a<-table.element(a, 1-pf(mysum$fstatistic[1],mysum$fstatistic[2],mysum$fstatistic[3]))
a<-table.row.end(a)
a<-table.row.start(a)
a<-table.element(a, 'Multiple Linear Regression - Residual Statistics', 2, TRUE)
a<-table.row.end(a)
a<-table.row.start(a)
a<-table.element(a, 'Residual Standard Deviation',1,TRUE)
a<-table.element(a, mysum$sigma)
a<-table.row.end(a)
a<-table.row.start(a)
a<-table.element(a, 'Sum Squared Residuals',1,TRUE)
a<-table.element(a, sum(myerror*myerror))
a<-table.row.end(a)
a<-table.end(a)
table.save(a,file='mytable3.tab')
a<-table.start()
a<-table.row.start(a)
a<-table.element(a, 'Multiple Linear Regression - Actuals, Interpolation, and Residuals', 4, TRUE)
a<-table.row.end(a)
a<-table.row.start(a)
a<-table.element(a, 'Time or Index', 1, TRUE)
a<-table.element(a, 'Actuals', 1, TRUE)
a<-table.element(a, 'Interpolation
Forecast', 1, TRUE)
a<-table.element(a, 'Residuals
Prediction Error', 1, TRUE)
a<-table.row.end(a)
for (i in 1:n) {
a<-table.row.start(a)
a<-table.element(a,i, 1, TRUE)
a<-table.element(a,x[i])
a<-table.element(a,x[i]-mysum$resid[i])
a<-table.element(a,mysum$resid[i])
a<-table.row.end(a)
}
a<-table.end(a)
table.save(a,file='mytable4.tab')
if (n > n25) {
a<-table.start()
a<-table.row.start(a)
a<-table.element(a,'Goldfeld-Quandt test for Heteroskedasticity',4,TRUE)
a<-table.row.end(a)
a<-table.row.start(a)
a<-table.element(a,'p-values',header=TRUE)
a<-table.element(a,'Alternative Hypothesis',3,header=TRUE)
a<-table.row.end(a)
a<-table.row.start(a)
a<-table.element(a,'breakpoint index',header=TRUE)
a<-table.element(a,'greater',header=TRUE)
a<-table.element(a,'2-sided',header=TRUE)
a<-table.element(a,'less',header=TRUE)
a<-table.row.end(a)
for (mypoint in kp3:nmkm3) {
a<-table.row.start(a)
a<-table.element(a,mypoint,header=TRUE)
a<-table.element(a,gqarr[mypoint-kp3+1,1])
a<-table.element(a,gqarr[mypoint-kp3+1,2])
a<-table.element(a,gqarr[mypoint-kp3+1,3])
a<-table.row.end(a)
}
a<-table.end(a)
table.save(a,file='mytable5.tab')
a<-table.start()
a<-table.row.start(a)
a<-table.element(a,'Meta Analysis of Goldfeld-Quandt test for Heteroskedasticity',4,TRUE)
a<-table.row.end(a)
a<-table.row.start(a)
a<-table.element(a,'Description',header=TRUE)
a<-table.element(a,'# significant tests',header=TRUE)
a<-table.element(a,'% significant tests',header=TRUE)
a<-table.element(a,'OK/NOK',header=TRUE)
a<-table.row.end(a)
a<-table.row.start(a)
a<-table.element(a,'1% type I error level',header=TRUE)
a<-table.element(a,numsignificant1)
a<-table.element(a,numsignificant1/numgqtests)
if (numsignificant1/numgqtests < 0.01) dum <- 'OK' else dum <- 'NOK'
a<-table.element(a,dum)
a<-table.row.end(a)
a<-table.row.start(a)
a<-table.element(a,'5% type I error level',header=TRUE)
a<-table.element(a,numsignificant5)
a<-table.element(a,numsignificant5/numgqtests)
if (numsignificant5/numgqtests < 0.05) dum <- 'OK' else dum <- 'NOK'
a<-table.element(a,dum)
a<-table.row.end(a)
a<-table.row.start(a)
a<-table.element(a,'10% type I error level',header=TRUE)
a<-table.element(a,numsignificant10)
a<-table.element(a,numsignificant10/numgqtests)
if (numsignificant10/numgqtests < 0.1) dum <- 'OK' else dum <- 'NOK'
a<-table.element(a,dum)
a<-table.row.end(a)
a<-table.end(a)
table.save(a,file='mytable6.tab')
}