Free Statistics

of Irreproducible Research!

Author's title

Author*The author of this computation has been verified*
R Software Modulerwasp_multipleregression.wasp
Title produced by softwareMultiple Regression
Date of computationFri, 20 Nov 2009 16:01:02 -0700
Cite this page as followsStatistical Computations at FreeStatistics.org, Office for Research Development and Education, URL https://freestatistics.org/blog/index.php?v=date/2009/Nov/21/t1258758165sc2rackf3s1s10w.htm/, Retrieved Sat, 27 Apr 2024 16:26:53 +0000
Statistical Computations at FreeStatistics.org, Office for Research Development and Education, URL https://freestatistics.org/blog/index.php?pk=58488, Retrieved Sat, 27 Apr 2024 16:26:53 +0000
QR Codes:

Original text written by user:
IsPrivate?No (this computation is public)
User-defined keywords
Estimated Impact194
Family? (F = Feedback message, R = changed R code, M = changed R Module, P = changed Parameters, D = changed Data)
-     [Multiple Regression] [Q1 The Seatbeltlaw] [2007-11-14 19:27:43] [8cd6641b921d30ebe00b648d1481bba0]
- RMPD  [Multiple Regression] [Seatbelt] [2009-11-12 13:54:52] [b98453cac15ba1066b407e146608df68]
-    D    [Multiple Regression] [shwws7vr_1] [2009-11-20 20:49:17] [2b2cfeea2f5ac2a1bcb842baaf1415ef]
-   PD        [Multiple Regression] [shwws7vr_1] [2009-11-20 23:01:02] [d447d4b3e35da686436a520338c962fc] [Current]
Feedback Forum

Post a new message
Dataseries X:
100.35	102.1
100.35	102.86
100.36	102.99
100.39	103.73
100.34	105.02
100.34	104.43
100.35	104.63
100.43	104.93
100.47	105.87
100.67	105.66
100.75	106.76
100.78	106
100.79	107.22
100.67	107.33
100.64	107.11
100.64	108.86
100.76	107.72
100.79	107.88
100.79	108.38
100.9	107.72
100.98	108.41
101.11	109.9
101.18	111.45
101.22	112.18
101.23	113.34
101.09	113.46
101.26	114.06
101.28	115.54
101.43	116.39
101.53	115.94
101.54	116.97
101.54	115.94
101.79	115.91
102.18	116.43
102.37	116.26
102.46	116.35
102.46	117.9
102.03	117.7
102.26	117.53
102.33	117.86
102.44	117.65
102.5	116.51
102.52	115.93
102.66	115.31
102.72	115


Summary of computational transaction
Raw Inputview raw input (R code)
Raw Outputview raw output of R engine
Computing time5 seconds
R Server'Gwilym Jenkins' @ 72.249.127.135

\begin{tabular}{lllllllll}
\hline
Summary of computational transaction \tabularnewline
Raw Input & view raw input (R code)  \tabularnewline
Raw Output & view raw output of R engine  \tabularnewline
Computing time & 5 seconds \tabularnewline
R Server & 'Gwilym Jenkins' @ 72.249.127.135 \tabularnewline
\hline
\end{tabular}
%Source: https://freestatistics.org/blog/index.php?pk=58488&T=0

[TABLE]
[ROW][C]Summary of computational transaction[/C][/ROW]
[ROW][C]Raw Input[/C][C]view raw input (R code) [/C][/ROW]
[ROW][C]Raw Output[/C][C]view raw output of R engine [/C][/ROW]
[ROW][C]Computing time[/C][C]5 seconds[/C][/ROW]
[ROW][C]R Server[/C][C]'Gwilym Jenkins' @ 72.249.127.135[/C][/ROW]
[/TABLE]
Source: https://freestatistics.org/blog/index.php?pk=58488&T=0

Globally Unique Identifier (entire table): ba.freestatistics.org/blog/index.php?pk=58488&T=0

As an alternative you can also use a QR Code:  

The GUIDs for individual cells are displayed in the table below:

Summary of computational transaction
Raw Inputview raw input (R code)
Raw Outputview raw output of R engine
Computing time5 seconds
R Server'Gwilym Jenkins' @ 72.249.127.135


Multiple Linear Regression - Estimated Regression Equation
Ktot[t] = + 86.3391357853997 + 0.135840111929575Vmtot[t] -0.0930657133231456M1[t] -0.292394135429237M2[t] -0.208940544943249M3[t] -0.324968665267545M4[t] -0.269297087373633M5[t] -0.153197830849198M6[t] -0.182251863028952M7[t] -0.0314922067843380M8[t] + 0.0321993571183724M9[t] -0.0516553718996217M10[t] -0.0506165310947364M11[t] + e[t]

\begin{tabular}{lllllllll}
\hline
Multiple Linear Regression - Estimated Regression Equation \tabularnewline
Ktot[t] =  +  86.3391357853997 +  0.135840111929575Vmtot[t] -0.0930657133231456M1[t] -0.292394135429237M2[t] -0.208940544943249M3[t] -0.324968665267545M4[t] -0.269297087373633M5[t] -0.153197830849198M6[t] -0.182251863028952M7[t] -0.0314922067843380M8[t] +  0.0321993571183724M9[t] -0.0516553718996217M10[t] -0.0506165310947364M11[t]  + e[t] \tabularnewline
\hline
\end{tabular}
%Source: https://freestatistics.org/blog/index.php?pk=58488&T=1

[TABLE]
[ROW][C]Multiple Linear Regression - Estimated Regression Equation[/C][/ROW]
[ROW][C]Ktot[t] =  +  86.3391357853997 +  0.135840111929575Vmtot[t] -0.0930657133231456M1[t] -0.292394135429237M2[t] -0.208940544943249M3[t] -0.324968665267545M4[t] -0.269297087373633M5[t] -0.153197830849198M6[t] -0.182251863028952M7[t] -0.0314922067843380M8[t] +  0.0321993571183724M9[t] -0.0516553718996217M10[t] -0.0506165310947364M11[t]  + e[t][/C][/ROW]
[/TABLE]
Source: https://freestatistics.org/blog/index.php?pk=58488&T=1

Globally Unique Identifier (entire table): ba.freestatistics.org/blog/index.php?pk=58488&T=1

As an alternative you can also use a QR Code:  

The GUIDs for individual cells are displayed in the table below:

Multiple Linear Regression - Estimated Regression Equation
Ktot[t] = + 86.3391357853997 + 0.135840111929575Vmtot[t] -0.0930657133231456M1[t] -0.292394135429237M2[t] -0.208940544943249M3[t] -0.324968665267545M4[t] -0.269297087373633M5[t] -0.153197830849198M6[t] -0.182251863028952M7[t] -0.0314922067843380M8[t] + 0.0321993571183724M9[t] -0.0516553718996217M10[t] -0.0506165310947364M11[t] + e[t]


Multiple Linear Regression - Ordinary Least Squares
VariableParameterS.D.T-STATH0: parameter = 02-tail p-value1-tail p-value
(Intercept)86.33913578539971.22322770.583100
Vmtot0.1358401119295750.010812.577600
M1-0.09306571332314560.283748-0.3280.7450580.372529
M2-0.2923941354292370.283645-1.03080.3103410.155171
M3-0.2089405449432490.283605-0.73670.4666540.233327
M4-0.3249686652675450.283362-1.14680.2599540.129977
M5-0.2692970873736330.283369-0.95030.3490620.174531
M6-0.1531978308491980.283383-0.54060.5925240.296262
M7-0.1822518630289520.283362-0.64320.5246920.262346
M8-0.03149220678433800.283421-0.11110.9122190.45611
M90.03219935711837240.2833710.11360.9102410.455121
M10-0.05165537189962170.303065-0.17040.8657340.432867
M11-0.05061653109473640.302927-0.16710.8683490.434175

\begin{tabular}{lllllllll}
\hline
Multiple Linear Regression - Ordinary Least Squares \tabularnewline
Variable & Parameter & S.D. & T-STATH0: parameter = 0 & 2-tail p-value & 1-tail p-value \tabularnewline
(Intercept) & 86.3391357853997 & 1.223227 & 70.5831 & 0 & 0 \tabularnewline
Vmtot & 0.135840111929575 & 0.0108 & 12.5776 & 0 & 0 \tabularnewline
M1 & -0.0930657133231456 & 0.283748 & -0.328 & 0.745058 & 0.372529 \tabularnewline
M2 & -0.292394135429237 & 0.283645 & -1.0308 & 0.310341 & 0.155171 \tabularnewline
M3 & -0.208940544943249 & 0.283605 & -0.7367 & 0.466654 & 0.233327 \tabularnewline
M4 & -0.324968665267545 & 0.283362 & -1.1468 & 0.259954 & 0.129977 \tabularnewline
M5 & -0.269297087373633 & 0.283369 & -0.9503 & 0.349062 & 0.174531 \tabularnewline
M6 & -0.153197830849198 & 0.283383 & -0.5406 & 0.592524 & 0.296262 \tabularnewline
M7 & -0.182251863028952 & 0.283362 & -0.6432 & 0.524692 & 0.262346 \tabularnewline
M8 & -0.0314922067843380 & 0.283421 & -0.1111 & 0.912219 & 0.45611 \tabularnewline
M9 & 0.0321993571183724 & 0.283371 & 0.1136 & 0.910241 & 0.455121 \tabularnewline
M10 & -0.0516553718996217 & 0.303065 & -0.1704 & 0.865734 & 0.432867 \tabularnewline
M11 & -0.0506165310947364 & 0.302927 & -0.1671 & 0.868349 & 0.434175 \tabularnewline
\hline
\end{tabular}
%Source: https://freestatistics.org/blog/index.php?pk=58488&T=2

[TABLE]
[ROW][C]Multiple Linear Regression - Ordinary Least Squares[/C][/ROW]
[ROW][C]Variable[/C][C]Parameter[/C][C]S.D.[/C][C]T-STATH0: parameter = 0[/C][C]2-tail p-value[/C][C]1-tail p-value[/C][/ROW]
[ROW][C](Intercept)[/C][C]86.3391357853997[/C][C]1.223227[/C][C]70.5831[/C][C]0[/C][C]0[/C][/ROW]
[ROW][C]Vmtot[/C][C]0.135840111929575[/C][C]0.0108[/C][C]12.5776[/C][C]0[/C][C]0[/C][/ROW]
[ROW][C]M1[/C][C]-0.0930657133231456[/C][C]0.283748[/C][C]-0.328[/C][C]0.745058[/C][C]0.372529[/C][/ROW]
[ROW][C]M2[/C][C]-0.292394135429237[/C][C]0.283645[/C][C]-1.0308[/C][C]0.310341[/C][C]0.155171[/C][/ROW]
[ROW][C]M3[/C][C]-0.208940544943249[/C][C]0.283605[/C][C]-0.7367[/C][C]0.466654[/C][C]0.233327[/C][/ROW]
[ROW][C]M4[/C][C]-0.324968665267545[/C][C]0.283362[/C][C]-1.1468[/C][C]0.259954[/C][C]0.129977[/C][/ROW]
[ROW][C]M5[/C][C]-0.269297087373633[/C][C]0.283369[/C][C]-0.9503[/C][C]0.349062[/C][C]0.174531[/C][/ROW]
[ROW][C]M6[/C][C]-0.153197830849198[/C][C]0.283383[/C][C]-0.5406[/C][C]0.592524[/C][C]0.296262[/C][/ROW]
[ROW][C]M7[/C][C]-0.182251863028952[/C][C]0.283362[/C][C]-0.6432[/C][C]0.524692[/C][C]0.262346[/C][/ROW]
[ROW][C]M8[/C][C]-0.0314922067843380[/C][C]0.283421[/C][C]-0.1111[/C][C]0.912219[/C][C]0.45611[/C][/ROW]
[ROW][C]M9[/C][C]0.0321993571183724[/C][C]0.283371[/C][C]0.1136[/C][C]0.910241[/C][C]0.455121[/C][/ROW]
[ROW][C]M10[/C][C]-0.0516553718996217[/C][C]0.303065[/C][C]-0.1704[/C][C]0.865734[/C][C]0.432867[/C][/ROW]
[ROW][C]M11[/C][C]-0.0506165310947364[/C][C]0.302927[/C][C]-0.1671[/C][C]0.868349[/C][C]0.434175[/C][/ROW]
[/TABLE]
Source: https://freestatistics.org/blog/index.php?pk=58488&T=2

Globally Unique Identifier (entire table): ba.freestatistics.org/blog/index.php?pk=58488&T=2

As an alternative you can also use a QR Code:  

The GUIDs for individual cells are displayed in the table below:

Multiple Linear Regression - Ordinary Least Squares
VariableParameterS.D.T-STATH0: parameter = 02-tail p-value1-tail p-value
(Intercept)86.33913578539971.22322770.583100
Vmtot0.1358401119295750.010812.577600
M1-0.09306571332314560.283748-0.3280.7450580.372529
M2-0.2923941354292370.283645-1.03080.3103410.155171
M3-0.2089405449432490.283605-0.73670.4666540.233327
M4-0.3249686652675450.283362-1.14680.2599540.129977
M5-0.2692970873736330.283369-0.95030.3490620.174531
M6-0.1531978308491980.283383-0.54060.5925240.296262
M7-0.1822518630289520.283362-0.64320.5246920.262346
M8-0.03149220678433800.283421-0.11110.9122190.45611
M90.03219935711837240.2833710.11360.9102410.455121
M10-0.05165537189962170.303065-0.17040.8657340.432867
M11-0.05061653109473640.302927-0.16710.8683490.434175


Multiple Linear Regression - Regression Statistics
Multiple R0.914861614224816
R-squared0.836971773182037
Adjusted R-squared0.7758361881253
F-TEST (value)13.6904189663891
F-TEST (DF numerator)12
F-TEST (DF denominator)32
p-value2.20569318365449e-09
Multiple Linear Regression - Residual Statistics
Residual Standard Deviation0.371007714838415
Sum Squared Residuals4.40469518302793

\begin{tabular}{lllllllll}
\hline
Multiple Linear Regression - Regression Statistics \tabularnewline
Multiple R & 0.914861614224816 \tabularnewline
R-squared & 0.836971773182037 \tabularnewline
Adjusted R-squared & 0.7758361881253 \tabularnewline
F-TEST (value) & 13.6904189663891 \tabularnewline
F-TEST (DF numerator) & 12 \tabularnewline
F-TEST (DF denominator) & 32 \tabularnewline
p-value & 2.20569318365449e-09 \tabularnewline
Multiple Linear Regression - Residual Statistics \tabularnewline
Residual Standard Deviation & 0.371007714838415 \tabularnewline
Sum Squared Residuals & 4.40469518302793 \tabularnewline
\hline
\end{tabular}
%Source: https://freestatistics.org/blog/index.php?pk=58488&T=3

[TABLE]
[ROW][C]Multiple Linear Regression - Regression Statistics[/C][/ROW]
[ROW][C]Multiple R[/C][C]0.914861614224816[/C][/ROW]
[ROW][C]R-squared[/C][C]0.836971773182037[/C][/ROW]
[ROW][C]Adjusted R-squared[/C][C]0.7758361881253[/C][/ROW]
[ROW][C]F-TEST (value)[/C][C]13.6904189663891[/C][/ROW]
[ROW][C]F-TEST (DF numerator)[/C][C]12[/C][/ROW]
[ROW][C]F-TEST (DF denominator)[/C][C]32[/C][/ROW]
[ROW][C]p-value[/C][C]2.20569318365449e-09[/C][/ROW]
[ROW][C]Multiple Linear Regression - Residual Statistics[/C][/ROW]
[ROW][C]Residual Standard Deviation[/C][C]0.371007714838415[/C][/ROW]
[ROW][C]Sum Squared Residuals[/C][C]4.40469518302793[/C][/ROW]
[/TABLE]
Source: https://freestatistics.org/blog/index.php?pk=58488&T=3

Globally Unique Identifier (entire table): ba.freestatistics.org/blog/index.php?pk=58488&T=3

As an alternative you can also use a QR Code:  

The GUIDs for individual cells are displayed in the table below:

Multiple Linear Regression - Regression Statistics
Multiple R0.914861614224816
R-squared0.836971773182037
Adjusted R-squared0.7758361881253
F-TEST (value)13.6904189663891
F-TEST (DF numerator)12
F-TEST (DF denominator)32
p-value2.20569318365449e-09
Multiple Linear Regression - Residual Statistics
Residual Standard Deviation0.371007714838415
Sum Squared Residuals4.40469518302793


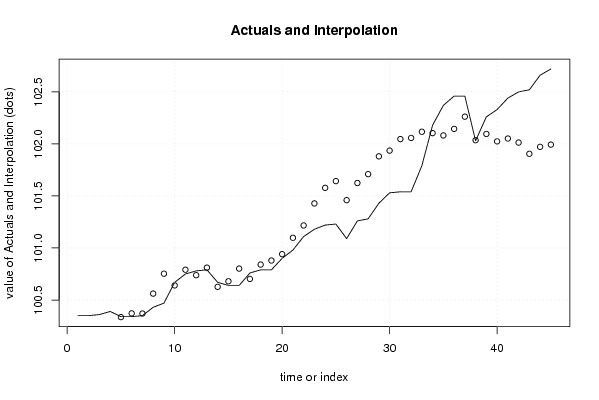
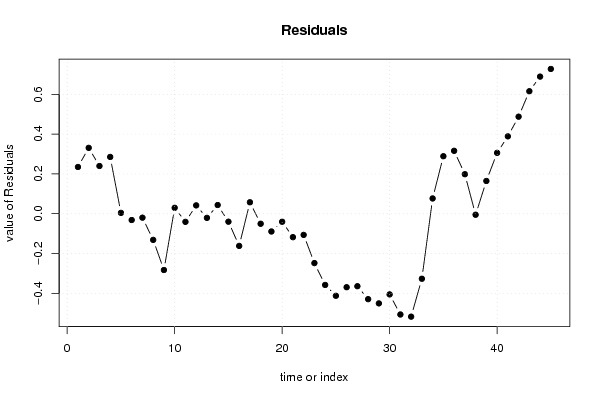
Multiple Linear Regression - Actuals, Interpolation, and Residuals
Time or IndexActualsInterpolationForecastResidualsPrediction Error
1100.35100.1153455000860.234654499913785
2100.35100.0192555630470.330744436953394
3100.36100.1203683680830.239631631916567
4100.39100.1048619305870.285138069412977
5100.34100.335767252870.0042327471299166
6100.34100.371720843356-0.0317208433560704
7100.35100.369834833562-0.0198348335622384
8100.43100.561346523386-0.131346523385714
9100.47100.752727792502-0.282727792502233
10100.67100.6403466399790.0296533600209756
11100.75100.790809603906-0.0408096039064457
12100.78100.7381876499350.0418123500652971
13100.79100.810846873166-0.0208468731656339
14100.67100.6264608633720.0435391366281996
15100.64100.680029629233-0.0400296292332835
16100.64100.801721704786-0.161721704785744
17100.76100.702535555080.0574644449200642
18100.79100.840369229513-0.0503692295131011
19100.79100.879235253298-0.0892352532981342
20100.9100.940340435669-0.0403404356692299
21100.98101.097761676803-0.117761676803349
22101.11101.216308714560-0.106308714560428
23101.18101.427899728856-0.247899728856147
24101.22101.577679541659-0.357679541659482
25101.23101.642188358175-0.412188358174638
26101.09101.459160749500-0.369160749500095
27101.26101.624118407144-0.364118407143828
28101.28101.709133652475-0.429133652475308
29101.43101.880269325509-0.450269325509353
30101.53101.935240531665-0.405240531665484
31101.54102.046101814773-0.506101814773187
32101.54102.056946155730-0.516946155730339
33101.79102.116562516275-0.326562516275162
34102.18102.1033446454610.0766553545394522
35102.37102.0812906672370.288709332762593
36102.46102.1441328084060.315867191594185
37102.46102.2616192685740.198380731426487
38102.03102.035122824081-0.00512282408149841
39102.26102.0954835955390.164516404460545
40102.33102.0242827121520.305717287848075
41102.44102.0514278665410.388572133459372
42102.5102.0126693954650.487330604534655
43102.52101.9048280983660.61517190163356
44102.66101.9713668852150.688633114785283
45102.72101.9929480144190.727051985580744

\begin{tabular}{lllllllll}
\hline
Multiple Linear Regression - Actuals, Interpolation, and Residuals \tabularnewline
Time or Index & Actuals & InterpolationForecast & ResidualsPrediction Error \tabularnewline
1 & 100.35 & 100.115345500086 & 0.234654499913785 \tabularnewline
2 & 100.35 & 100.019255563047 & 0.330744436953394 \tabularnewline
3 & 100.36 & 100.120368368083 & 0.239631631916567 \tabularnewline
4 & 100.39 & 100.104861930587 & 0.285138069412977 \tabularnewline
5 & 100.34 & 100.33576725287 & 0.0042327471299166 \tabularnewline
6 & 100.34 & 100.371720843356 & -0.0317208433560704 \tabularnewline
7 & 100.35 & 100.369834833562 & -0.0198348335622384 \tabularnewline
8 & 100.43 & 100.561346523386 & -0.131346523385714 \tabularnewline
9 & 100.47 & 100.752727792502 & -0.282727792502233 \tabularnewline
10 & 100.67 & 100.640346639979 & 0.0296533600209756 \tabularnewline
11 & 100.75 & 100.790809603906 & -0.0408096039064457 \tabularnewline
12 & 100.78 & 100.738187649935 & 0.0418123500652971 \tabularnewline
13 & 100.79 & 100.810846873166 & -0.0208468731656339 \tabularnewline
14 & 100.67 & 100.626460863372 & 0.0435391366281996 \tabularnewline
15 & 100.64 & 100.680029629233 & -0.0400296292332835 \tabularnewline
16 & 100.64 & 100.801721704786 & -0.161721704785744 \tabularnewline
17 & 100.76 & 100.70253555508 & 0.0574644449200642 \tabularnewline
18 & 100.79 & 100.840369229513 & -0.0503692295131011 \tabularnewline
19 & 100.79 & 100.879235253298 & -0.0892352532981342 \tabularnewline
20 & 100.9 & 100.940340435669 & -0.0403404356692299 \tabularnewline
21 & 100.98 & 101.097761676803 & -0.117761676803349 \tabularnewline
22 & 101.11 & 101.216308714560 & -0.106308714560428 \tabularnewline
23 & 101.18 & 101.427899728856 & -0.247899728856147 \tabularnewline
24 & 101.22 & 101.577679541659 & -0.357679541659482 \tabularnewline
25 & 101.23 & 101.642188358175 & -0.412188358174638 \tabularnewline
26 & 101.09 & 101.459160749500 & -0.369160749500095 \tabularnewline
27 & 101.26 & 101.624118407144 & -0.364118407143828 \tabularnewline
28 & 101.28 & 101.709133652475 & -0.429133652475308 \tabularnewline
29 & 101.43 & 101.880269325509 & -0.450269325509353 \tabularnewline
30 & 101.53 & 101.935240531665 & -0.405240531665484 \tabularnewline
31 & 101.54 & 102.046101814773 & -0.506101814773187 \tabularnewline
32 & 101.54 & 102.056946155730 & -0.516946155730339 \tabularnewline
33 & 101.79 & 102.116562516275 & -0.326562516275162 \tabularnewline
34 & 102.18 & 102.103344645461 & 0.0766553545394522 \tabularnewline
35 & 102.37 & 102.081290667237 & 0.288709332762593 \tabularnewline
36 & 102.46 & 102.144132808406 & 0.315867191594185 \tabularnewline
37 & 102.46 & 102.261619268574 & 0.198380731426487 \tabularnewline
38 & 102.03 & 102.035122824081 & -0.00512282408149841 \tabularnewline
39 & 102.26 & 102.095483595539 & 0.164516404460545 \tabularnewline
40 & 102.33 & 102.024282712152 & 0.305717287848075 \tabularnewline
41 & 102.44 & 102.051427866541 & 0.388572133459372 \tabularnewline
42 & 102.5 & 102.012669395465 & 0.487330604534655 \tabularnewline
43 & 102.52 & 101.904828098366 & 0.61517190163356 \tabularnewline
44 & 102.66 & 101.971366885215 & 0.688633114785283 \tabularnewline
45 & 102.72 & 101.992948014419 & 0.727051985580744 \tabularnewline
\hline
\end{tabular}
%Source: https://freestatistics.org/blog/index.php?pk=58488&T=4

[TABLE]
[ROW][C]Multiple Linear Regression - Actuals, Interpolation, and Residuals[/C][/ROW]
[ROW][C]Time or Index[/C][C]Actuals[/C][C]InterpolationForecast[/C][C]ResidualsPrediction Error[/C][/ROW]
[ROW][C]1[/C][C]100.35[/C][C]100.115345500086[/C][C]0.234654499913785[/C][/ROW]
[ROW][C]2[/C][C]100.35[/C][C]100.019255563047[/C][C]0.330744436953394[/C][/ROW]
[ROW][C]3[/C][C]100.36[/C][C]100.120368368083[/C][C]0.239631631916567[/C][/ROW]
[ROW][C]4[/C][C]100.39[/C][C]100.104861930587[/C][C]0.285138069412977[/C][/ROW]
[ROW][C]5[/C][C]100.34[/C][C]100.33576725287[/C][C]0.0042327471299166[/C][/ROW]
[ROW][C]6[/C][C]100.34[/C][C]100.371720843356[/C][C]-0.0317208433560704[/C][/ROW]
[ROW][C]7[/C][C]100.35[/C][C]100.369834833562[/C][C]-0.0198348335622384[/C][/ROW]
[ROW][C]8[/C][C]100.43[/C][C]100.561346523386[/C][C]-0.131346523385714[/C][/ROW]
[ROW][C]9[/C][C]100.47[/C][C]100.752727792502[/C][C]-0.282727792502233[/C][/ROW]
[ROW][C]10[/C][C]100.67[/C][C]100.640346639979[/C][C]0.0296533600209756[/C][/ROW]
[ROW][C]11[/C][C]100.75[/C][C]100.790809603906[/C][C]-0.0408096039064457[/C][/ROW]
[ROW][C]12[/C][C]100.78[/C][C]100.738187649935[/C][C]0.0418123500652971[/C][/ROW]
[ROW][C]13[/C][C]100.79[/C][C]100.810846873166[/C][C]-0.0208468731656339[/C][/ROW]
[ROW][C]14[/C][C]100.67[/C][C]100.626460863372[/C][C]0.0435391366281996[/C][/ROW]
[ROW][C]15[/C][C]100.64[/C][C]100.680029629233[/C][C]-0.0400296292332835[/C][/ROW]
[ROW][C]16[/C][C]100.64[/C][C]100.801721704786[/C][C]-0.161721704785744[/C][/ROW]
[ROW][C]17[/C][C]100.76[/C][C]100.70253555508[/C][C]0.0574644449200642[/C][/ROW]
[ROW][C]18[/C][C]100.79[/C][C]100.840369229513[/C][C]-0.0503692295131011[/C][/ROW]
[ROW][C]19[/C][C]100.79[/C][C]100.879235253298[/C][C]-0.0892352532981342[/C][/ROW]
[ROW][C]20[/C][C]100.9[/C][C]100.940340435669[/C][C]-0.0403404356692299[/C][/ROW]
[ROW][C]21[/C][C]100.98[/C][C]101.097761676803[/C][C]-0.117761676803349[/C][/ROW]
[ROW][C]22[/C][C]101.11[/C][C]101.216308714560[/C][C]-0.106308714560428[/C][/ROW]
[ROW][C]23[/C][C]101.18[/C][C]101.427899728856[/C][C]-0.247899728856147[/C][/ROW]
[ROW][C]24[/C][C]101.22[/C][C]101.577679541659[/C][C]-0.357679541659482[/C][/ROW]
[ROW][C]25[/C][C]101.23[/C][C]101.642188358175[/C][C]-0.412188358174638[/C][/ROW]
[ROW][C]26[/C][C]101.09[/C][C]101.459160749500[/C][C]-0.369160749500095[/C][/ROW]
[ROW][C]27[/C][C]101.26[/C][C]101.624118407144[/C][C]-0.364118407143828[/C][/ROW]
[ROW][C]28[/C][C]101.28[/C][C]101.709133652475[/C][C]-0.429133652475308[/C][/ROW]
[ROW][C]29[/C][C]101.43[/C][C]101.880269325509[/C][C]-0.450269325509353[/C][/ROW]
[ROW][C]30[/C][C]101.53[/C][C]101.935240531665[/C][C]-0.405240531665484[/C][/ROW]
[ROW][C]31[/C][C]101.54[/C][C]102.046101814773[/C][C]-0.506101814773187[/C][/ROW]
[ROW][C]32[/C][C]101.54[/C][C]102.056946155730[/C][C]-0.516946155730339[/C][/ROW]
[ROW][C]33[/C][C]101.79[/C][C]102.116562516275[/C][C]-0.326562516275162[/C][/ROW]
[ROW][C]34[/C][C]102.18[/C][C]102.103344645461[/C][C]0.0766553545394522[/C][/ROW]
[ROW][C]35[/C][C]102.37[/C][C]102.081290667237[/C][C]0.288709332762593[/C][/ROW]
[ROW][C]36[/C][C]102.46[/C][C]102.144132808406[/C][C]0.315867191594185[/C][/ROW]
[ROW][C]37[/C][C]102.46[/C][C]102.261619268574[/C][C]0.198380731426487[/C][/ROW]
[ROW][C]38[/C][C]102.03[/C][C]102.035122824081[/C][C]-0.00512282408149841[/C][/ROW]
[ROW][C]39[/C][C]102.26[/C][C]102.095483595539[/C][C]0.164516404460545[/C][/ROW]
[ROW][C]40[/C][C]102.33[/C][C]102.024282712152[/C][C]0.305717287848075[/C][/ROW]
[ROW][C]41[/C][C]102.44[/C][C]102.051427866541[/C][C]0.388572133459372[/C][/ROW]
[ROW][C]42[/C][C]102.5[/C][C]102.012669395465[/C][C]0.487330604534655[/C][/ROW]
[ROW][C]43[/C][C]102.52[/C][C]101.904828098366[/C][C]0.61517190163356[/C][/ROW]
[ROW][C]44[/C][C]102.66[/C][C]101.971366885215[/C][C]0.688633114785283[/C][/ROW]
[ROW][C]45[/C][C]102.72[/C][C]101.992948014419[/C][C]0.727051985580744[/C][/ROW]
[/TABLE]
Source: https://freestatistics.org/blog/index.php?pk=58488&T=4

Globally Unique Identifier (entire table): ba.freestatistics.org/blog/index.php?pk=58488&T=4

As an alternative you can also use a QR Code:  

The GUIDs for individual cells are displayed in the table below:

Multiple Linear Regression - Actuals, Interpolation, and Residuals
Time or IndexActualsInterpolationForecastResidualsPrediction Error
1100.35100.1153455000860.234654499913785
2100.35100.0192555630470.330744436953394
3100.36100.1203683680830.239631631916567
4100.39100.1048619305870.285138069412977
5100.34100.335767252870.0042327471299166
6100.34100.371720843356-0.0317208433560704
7100.35100.369834833562-0.0198348335622384
8100.43100.561346523386-0.131346523385714
9100.47100.752727792502-0.282727792502233
10100.67100.6403466399790.0296533600209756
11100.75100.790809603906-0.0408096039064457
12100.78100.7381876499350.0418123500652971
13100.79100.810846873166-0.0208468731656339
14100.67100.6264608633720.0435391366281996
15100.64100.680029629233-0.0400296292332835
16100.64100.801721704786-0.161721704785744
17100.76100.702535555080.0574644449200642
18100.79100.840369229513-0.0503692295131011
19100.79100.879235253298-0.0892352532981342
20100.9100.940340435669-0.0403404356692299
21100.98101.097761676803-0.117761676803349
22101.11101.216308714560-0.106308714560428
23101.18101.427899728856-0.247899728856147
24101.22101.577679541659-0.357679541659482
25101.23101.642188358175-0.412188358174638
26101.09101.459160749500-0.369160749500095
27101.26101.624118407144-0.364118407143828
28101.28101.709133652475-0.429133652475308
29101.43101.880269325509-0.450269325509353
30101.53101.935240531665-0.405240531665484
31101.54102.046101814773-0.506101814773187
32101.54102.056946155730-0.516946155730339
33101.79102.116562516275-0.326562516275162
34102.18102.1033446454610.0766553545394522
35102.37102.0812906672370.288709332762593
36102.46102.1441328084060.315867191594185
37102.46102.2616192685740.198380731426487
38102.03102.035122824081-0.00512282408149841
39102.26102.0954835955390.164516404460545
40102.33102.0242827121520.305717287848075
41102.44102.0514278665410.388572133459372
42102.5102.0126693954650.487330604534655
43102.52101.9048280983660.61517190163356
44102.66101.9713668852150.688633114785283
45102.72101.9929480144190.727051985580744


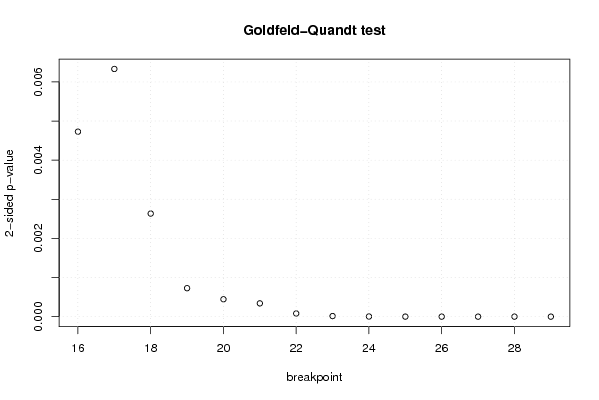
Goldfeld-Quandt test for Heteroskedasticity
p-valuesAlternative Hypothesis
breakpoint indexgreater2-sidedless
160.002364328037538760.004728656075077510.997635671962461
170.003165982642739630.006331965285479250.99683401735726
180.001317604545792630.002635209091585250.998682395454207
190.0003638280852641640.0007276561705283280.999636171914736
200.0002224135224859960.0004448270449719930.999777586477514
210.0001698905670297650.0003397811340595290.99983010943297
224.0370384181367e-058.0740768362734e-050.999959629615819
237.39208768021937e-061.47841753604387e-050.99999260791232
241.82987597126666e-063.65975194253331e-060.999998170124029
253.95702080261132e-077.91404160522265e-070.99999960429792
268.59616489586631e-081.71923297917326e-070.999999914038351
271.17329899633525e-082.34659799267050e-080.99999998826701
284.35262142090784e-098.70524284181568e-090.999999995647379
296.784875984883e-081.3569751969766e-070.99999993215124

\begin{tabular}{lllllllll}
\hline
Goldfeld-Quandt test for Heteroskedasticity \tabularnewline
p-values & Alternative Hypothesis \tabularnewline
breakpoint index & greater & 2-sided & less \tabularnewline
16 & 0.00236432803753876 & 0.00472865607507751 & 0.997635671962461 \tabularnewline
17 & 0.00316598264273963 & 0.00633196528547925 & 0.99683401735726 \tabularnewline
18 & 0.00131760454579263 & 0.00263520909158525 & 0.998682395454207 \tabularnewline
19 & 0.000363828085264164 & 0.000727656170528328 & 0.999636171914736 \tabularnewline
20 & 0.000222413522485996 & 0.000444827044971993 & 0.999777586477514 \tabularnewline
21 & 0.000169890567029765 & 0.000339781134059529 & 0.99983010943297 \tabularnewline
22 & 4.0370384181367e-05 & 8.0740768362734e-05 & 0.999959629615819 \tabularnewline
23 & 7.39208768021937e-06 & 1.47841753604387e-05 & 0.99999260791232 \tabularnewline
24 & 1.82987597126666e-06 & 3.65975194253331e-06 & 0.999998170124029 \tabularnewline
25 & 3.95702080261132e-07 & 7.91404160522265e-07 & 0.99999960429792 \tabularnewline
26 & 8.59616489586631e-08 & 1.71923297917326e-07 & 0.999999914038351 \tabularnewline
27 & 1.17329899633525e-08 & 2.34659799267050e-08 & 0.99999998826701 \tabularnewline
28 & 4.35262142090784e-09 & 8.70524284181568e-09 & 0.999999995647379 \tabularnewline
29 & 6.784875984883e-08 & 1.3569751969766e-07 & 0.99999993215124 \tabularnewline
\hline
\end{tabular}
%Source: https://freestatistics.org/blog/index.php?pk=58488&T=5

[TABLE]
[ROW][C]Goldfeld-Quandt test for Heteroskedasticity[/C][/ROW]
[ROW][C]p-values[/C][C]Alternative Hypothesis[/C][/ROW]
[ROW][C]breakpoint index[/C][C]greater[/C][C]2-sided[/C][C]less[/C][/ROW]
[ROW][C]16[/C][C]0.00236432803753876[/C][C]0.00472865607507751[/C][C]0.997635671962461[/C][/ROW]
[ROW][C]17[/C][C]0.00316598264273963[/C][C]0.00633196528547925[/C][C]0.99683401735726[/C][/ROW]
[ROW][C]18[/C][C]0.00131760454579263[/C][C]0.00263520909158525[/C][C]0.998682395454207[/C][/ROW]
[ROW][C]19[/C][C]0.000363828085264164[/C][C]0.000727656170528328[/C][C]0.999636171914736[/C][/ROW]
[ROW][C]20[/C][C]0.000222413522485996[/C][C]0.000444827044971993[/C][C]0.999777586477514[/C][/ROW]
[ROW][C]21[/C][C]0.000169890567029765[/C][C]0.000339781134059529[/C][C]0.99983010943297[/C][/ROW]
[ROW][C]22[/C][C]4.0370384181367e-05[/C][C]8.0740768362734e-05[/C][C]0.999959629615819[/C][/ROW]
[ROW][C]23[/C][C]7.39208768021937e-06[/C][C]1.47841753604387e-05[/C][C]0.99999260791232[/C][/ROW]
[ROW][C]24[/C][C]1.82987597126666e-06[/C][C]3.65975194253331e-06[/C][C]0.999998170124029[/C][/ROW]
[ROW][C]25[/C][C]3.95702080261132e-07[/C][C]7.91404160522265e-07[/C][C]0.99999960429792[/C][/ROW]
[ROW][C]26[/C][C]8.59616489586631e-08[/C][C]1.71923297917326e-07[/C][C]0.999999914038351[/C][/ROW]
[ROW][C]27[/C][C]1.17329899633525e-08[/C][C]2.34659799267050e-08[/C][C]0.99999998826701[/C][/ROW]
[ROW][C]28[/C][C]4.35262142090784e-09[/C][C]8.70524284181568e-09[/C][C]0.999999995647379[/C][/ROW]
[ROW][C]29[/C][C]6.784875984883e-08[/C][C]1.3569751969766e-07[/C][C]0.99999993215124[/C][/ROW]
[/TABLE]
Source: https://freestatistics.org/blog/index.php?pk=58488&T=5

Globally Unique Identifier (entire table): ba.freestatistics.org/blog/index.php?pk=58488&T=5

As an alternative you can also use a QR Code:  

The GUIDs for individual cells are displayed in the table below:

Goldfeld-Quandt test for Heteroskedasticity
p-valuesAlternative Hypothesis
breakpoint indexgreater2-sidedless
160.002364328037538760.004728656075077510.997635671962461
170.003165982642739630.006331965285479250.99683401735726
180.001317604545792630.002635209091585250.998682395454207
190.0003638280852641640.0007276561705283280.999636171914736
200.0002224135224859960.0004448270449719930.999777586477514
210.0001698905670297650.0003397811340595290.99983010943297
224.0370384181367e-058.0740768362734e-050.999959629615819
237.39208768021937e-061.47841753604387e-050.99999260791232
241.82987597126666e-063.65975194253331e-060.999998170124029
253.95702080261132e-077.91404160522265e-070.99999960429792
268.59616489586631e-081.71923297917326e-070.999999914038351
271.17329899633525e-082.34659799267050e-080.99999998826701
284.35262142090784e-098.70524284181568e-090.999999995647379
296.784875984883e-081.3569751969766e-070.99999993215124


Meta Analysis of Goldfeld-Quandt test for Heteroskedasticity
Description# significant tests% significant testsOK/NOK
1% type I error level141NOK
5% type I error level141NOK
10% type I error level141NOK

\begin{tabular}{lllllllll}
\hline
Meta Analysis of Goldfeld-Quandt test for Heteroskedasticity \tabularnewline
Description & # significant tests & % significant tests & OK/NOK \tabularnewline
1% type I error level & 14 & 1 & NOK \tabularnewline
5% type I error level & 14 & 1 & NOK \tabularnewline
10% type I error level & 14 & 1 & NOK \tabularnewline
\hline
\end{tabular}
%Source: https://freestatistics.org/blog/index.php?pk=58488&T=6

[TABLE]
[ROW][C]Meta Analysis of Goldfeld-Quandt test for Heteroskedasticity[/C][/ROW]
[ROW][C]Description[/C][C]# significant tests[/C][C]% significant tests[/C][C]OK/NOK[/C][/ROW]
[ROW][C]1% type I error level[/C][C]14[/C][C]1[/C][C]NOK[/C][/ROW]
[ROW][C]5% type I error level[/C][C]14[/C][C]1[/C][C]NOK[/C][/ROW]
[ROW][C]10% type I error level[/C][C]14[/C][C]1[/C][C]NOK[/C][/ROW]
[/TABLE]
Source: https://freestatistics.org/blog/index.php?pk=58488&T=6

Globally Unique Identifier (entire table): ba.freestatistics.org/blog/index.php?pk=58488&T=6

As an alternative you can also use a QR Code:  

The GUIDs for individual cells are displayed in the table below:

Meta Analysis of Goldfeld-Quandt test for Heteroskedasticity
Description# significant tests% significant testsOK/NOK
1% type I error level141NOK
5% type I error level141NOK
10% type I error level141NOK


Parameters (Session):
par1 = 1 ; par2 = Include Monthly Dummies ; par3 = No Linear Trend ;
Parameters (R input):
par1 = 1 ; par2 = Include Monthly Dummies ; par3 = No Linear Trend ;
R code (references can be found in the software module):
library(lattice)
library(lmtest)
n25 <- 25 #minimum number of obs. for Goldfeld-Quandt test
par1 <- as.numeric(par1)
x <- t(y)
k <- length(x[1,])
n <- length(x[,1])
x1 <- cbind(x[,par1], x[,1:k!=par1])
mycolnames <- c(colnames(x)[par1], colnames(x)[1:k!=par1])
colnames(x1) <- mycolnames #colnames(x)[par1]
x <- x1
if (par3 == 'First Differences'){
x2 <- array(0, dim=c(n-1,k), dimnames=list(1:(n-1), paste('(1-B)',colnames(x),sep='')))
for (i in 1:n-1) {
for (j in 1:k) {
x2[i,j] <- x[i+1,j] - x[i,j]
}
}
x <- x2
}
if (par2 == 'Include Monthly Dummies'){
x2 <- array(0, dim=c(n,11), dimnames=list(1:n, paste('M', seq(1:11), sep ='')))
for (i in 1:11){
x2[seq(i,n,12),i] <- 1
}
x <- cbind(x, x2)
}
if (par2 == 'Include Quarterly Dummies'){
x2 <- array(0, dim=c(n,3), dimnames=list(1:n, paste('Q', seq(1:3), sep ='')))
for (i in 1:3){
x2[seq(i,n,4),i] <- 1
}
x <- cbind(x, x2)
}
k <- length(x[1,])
if (par3 == 'Linear Trend'){
x <- cbind(x, c(1:n))
colnames(x)[k+1] <- 't'
}
x
k <- length(x[1,])
df <- as.data.frame(x)
(mylm <- lm(df))
(mysum <- summary(mylm))
if (n > n25) {
kp3 <- k + 3
nmkm3 <- n - k - 3
gqarr <- array(NA, dim=c(nmkm3-kp3+1,3))
numgqtests <- 0
numsignificant1 <- 0
numsignificant5 <- 0
numsignificant10 <- 0
for (mypoint in kp3:nmkm3) {
j <- 0
numgqtests <- numgqtests + 1
for (myalt in c('greater', 'two.sided', 'less')) {
j <- j + 1
gqarr[mypoint-kp3+1,j] <- gqtest(mylm, point=mypoint, alternative=myalt)$p.value
}
if (gqarr[mypoint-kp3+1,2] < 0.01) numsignificant1 <- numsignificant1 + 1
if (gqarr[mypoint-kp3+1,2] < 0.05) numsignificant5 <- numsignificant5 + 1
if (gqarr[mypoint-kp3+1,2] < 0.10) numsignificant10 <- numsignificant10 + 1
}
gqarr
}
bitmap(file='test0.png')
plot(x[,1], type='l', main='Actuals and Interpolation', ylab='value of Actuals and Interpolation (dots)', xlab='time or index')
points(x[,1]-mysum$resid)
grid()
dev.off()
bitmap(file='test1.png')
plot(mysum$resid, type='b', pch=19, main='Residuals', ylab='value of Residuals', xlab='time or index')
grid()
dev.off()
bitmap(file='test2.png')
hist(mysum$resid, main='Residual Histogram', xlab='values of Residuals')
grid()
dev.off()
bitmap(file='test3.png')
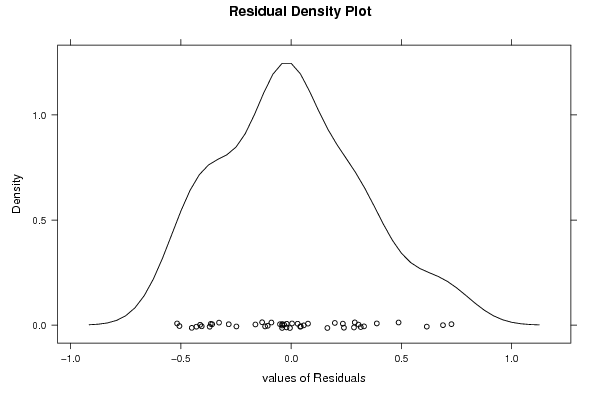
densityplot(~mysum$resid,col='black',main='Residual Density Plot', xlab='values of Residuals')
dev.off()
bitmap(file='test4.png')
qqnorm(mysum$resid, main='Residual Normal Q-Q Plot')
qqline(mysum$resid)
grid()
dev.off()
(myerror <- as.ts(mysum$resid))
bitmap(file='test5.png')
dum <- cbind(lag(myerror,k=1),myerror)
dum
dum1 <- dum[2:length(myerror),]
dum1
z <- as.data.frame(dum1)
z
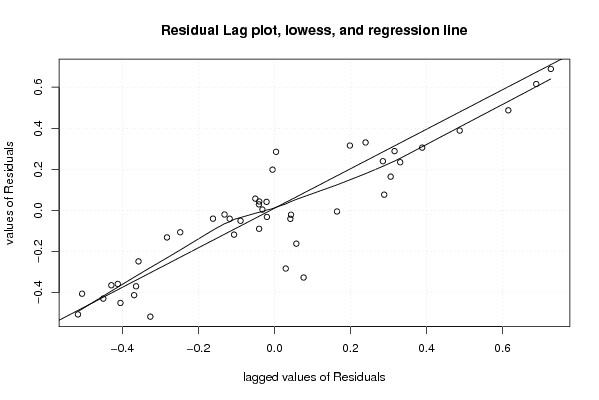
plot(z,main=paste('Residual Lag plot, lowess, and regression line'), ylab='values of Residuals', xlab='lagged values of Residuals')
lines(lowess(z))
abline(lm(z))
grid()
dev.off()
bitmap(file='test6.png')
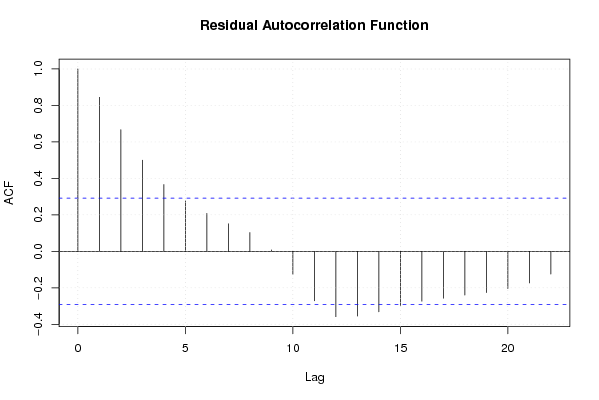
acf(mysum$resid, lag.max=length(mysum$resid)/2, main='Residual Autocorrelation Function')
grid()
dev.off()
bitmap(file='test7.png')
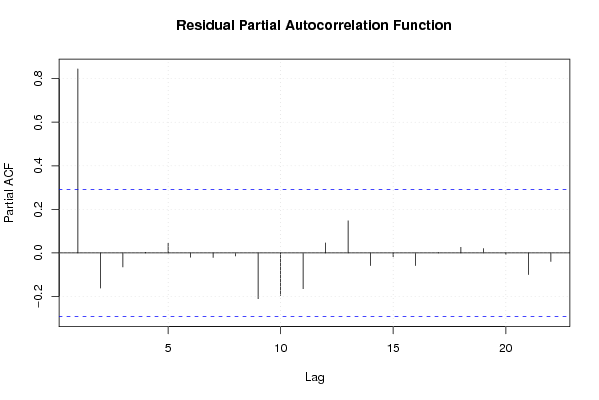
pacf(mysum$resid, lag.max=length(mysum$resid)/2, main='Residual Partial Autocorrelation Function')
grid()
dev.off()
bitmap(file='test8.png')
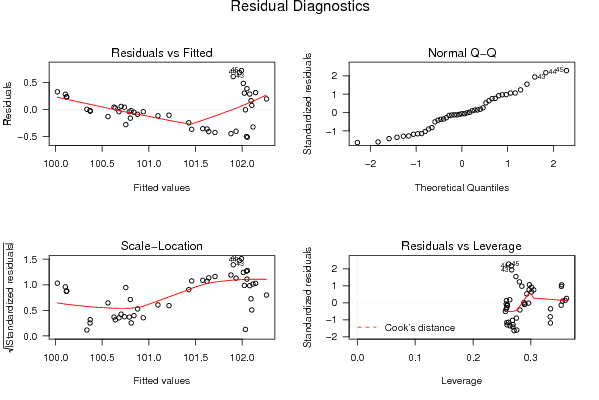
opar <- par(mfrow = c(2,2), oma = c(0, 0, 1.1, 0))
plot(mylm, las = 1, sub='Residual Diagnostics')
par(opar)
dev.off()
if (n > n25) {
bitmap(file='test9.png')
plot(kp3:nmkm3,gqarr[,2], main='Goldfeld-Quandt test',ylab='2-sided p-value',xlab='breakpoint')
grid()
dev.off()
}
load(file='createtable')
a<-table.start()
a<-table.row.start(a)
a<-table.element(a, 'Multiple Linear Regression - Estimated Regression Equation', 1, TRUE)
a<-table.row.end(a)
myeq <- colnames(x)[1]
myeq <- paste(myeq, '[t] = ', sep='')
for (i in 1:k){
if (mysum$coefficients[i,1] > 0) myeq <- paste(myeq, '+', '')
myeq <- paste(myeq, mysum$coefficients[i,1], sep=' ')
if (rownames(mysum$coefficients)[i] != '(Intercept)') {
myeq <- paste(myeq, rownames(mysum$coefficients)[i], sep='')
if (rownames(mysum$coefficients)[i] != 't') myeq <- paste(myeq, '[t]', sep='')
}
}
myeq <- paste(myeq, ' + e[t]')
a<-table.row.start(a)
a<-table.element(a, myeq)
a<-table.row.end(a)
a<-table.end(a)
table.save(a,file='mytable1.tab')
a<-table.start()
a<-table.row.start(a)
a<-table.element(a,hyperlink('ols1.htm','Multiple Linear Regression - Ordinary Least Squares',''), 6, TRUE)
a<-table.row.end(a)
a<-table.row.start(a)
a<-table.element(a,'Variable',header=TRUE)
a<-table.element(a,'Parameter',header=TRUE)
a<-table.element(a,'S.D.',header=TRUE)
a<-table.element(a,'T-STAT
H0: parameter = 0',header=TRUE)
a<-table.element(a,'2-tail p-value',header=TRUE)
a<-table.element(a,'1-tail p-value',header=TRUE)
a<-table.row.end(a)
for (i in 1:k){
a<-table.row.start(a)
a<-table.element(a,rownames(mysum$coefficients)[i],header=TRUE)
a<-table.element(a,mysum$coefficients[i,1])
a<-table.element(a, round(mysum$coefficients[i,2],6))
a<-table.element(a, round(mysum$coefficients[i,3],4))
a<-table.element(a, round(mysum$coefficients[i,4],6))
a<-table.element(a, round(mysum$coefficients[i,4]/2,6))
a<-table.row.end(a)
}
a<-table.end(a)
table.save(a,file='mytable2.tab')
a<-table.start()
a<-table.row.start(a)
a<-table.element(a, 'Multiple Linear Regression - Regression Statistics', 2, TRUE)
a<-table.row.end(a)
a<-table.row.start(a)
a<-table.element(a, 'Multiple R',1,TRUE)
a<-table.element(a, sqrt(mysum$r.squared))
a<-table.row.end(a)
a<-table.row.start(a)
a<-table.element(a, 'R-squared',1,TRUE)
a<-table.element(a, mysum$r.squared)
a<-table.row.end(a)
a<-table.row.start(a)
a<-table.element(a, 'Adjusted R-squared',1,TRUE)
a<-table.element(a, mysum$adj.r.squared)
a<-table.row.end(a)
a<-table.row.start(a)
a<-table.element(a, 'F-TEST (value)',1,TRUE)
a<-table.element(a, mysum$fstatistic[1])
a<-table.row.end(a)
a<-table.row.start(a)
a<-table.element(a, 'F-TEST (DF numerator)',1,TRUE)
a<-table.element(a, mysum$fstatistic[2])
a<-table.row.end(a)
a<-table.row.start(a)
a<-table.element(a, 'F-TEST (DF denominator)',1,TRUE)
a<-table.element(a, mysum$fstatistic[3])
a<-table.row.end(a)
a<-table.row.start(a)
a<-table.element(a, 'p-value',1,TRUE)
a<-table.element(a, 1-pf(mysum$fstatistic[1],mysum$fstatistic[2],mysum$fstatistic[3]))
a<-table.row.end(a)
a<-table.row.start(a)
a<-table.element(a, 'Multiple Linear Regression - Residual Statistics', 2, TRUE)
a<-table.row.end(a)
a<-table.row.start(a)
a<-table.element(a, 'Residual Standard Deviation',1,TRUE)
a<-table.element(a, mysum$sigma)
a<-table.row.end(a)
a<-table.row.start(a)
a<-table.element(a, 'Sum Squared Residuals',1,TRUE)
a<-table.element(a, sum(myerror*myerror))
a<-table.row.end(a)
a<-table.end(a)
table.save(a,file='mytable3.tab')
a<-table.start()
a<-table.row.start(a)
a<-table.element(a, 'Multiple Linear Regression - Actuals, Interpolation, and Residuals', 4, TRUE)
a<-table.row.end(a)
a<-table.row.start(a)
a<-table.element(a, 'Time or Index', 1, TRUE)
a<-table.element(a, 'Actuals', 1, TRUE)
a<-table.element(a, 'Interpolation
Forecast', 1, TRUE)
a<-table.element(a, 'Residuals
Prediction Error', 1, TRUE)
a<-table.row.end(a)
for (i in 1:n) {
a<-table.row.start(a)
a<-table.element(a,i, 1, TRUE)
a<-table.element(a,x[i])
a<-table.element(a,x[i]-mysum$resid[i])
a<-table.element(a,mysum$resid[i])
a<-table.row.end(a)
}
a<-table.end(a)
table.save(a,file='mytable4.tab')
if (n > n25) {
a<-table.start()
a<-table.row.start(a)
a<-table.element(a,'Goldfeld-Quandt test for Heteroskedasticity',4,TRUE)
a<-table.row.end(a)
a<-table.row.start(a)
a<-table.element(a,'p-values',header=TRUE)
a<-table.element(a,'Alternative Hypothesis',3,header=TRUE)
a<-table.row.end(a)
a<-table.row.start(a)
a<-table.element(a,'breakpoint index',header=TRUE)
a<-table.element(a,'greater',header=TRUE)
a<-table.element(a,'2-sided',header=TRUE)
a<-table.element(a,'less',header=TRUE)
a<-table.row.end(a)
for (mypoint in kp3:nmkm3) {
a<-table.row.start(a)
a<-table.element(a,mypoint,header=TRUE)
a<-table.element(a,gqarr[mypoint-kp3+1,1])
a<-table.element(a,gqarr[mypoint-kp3+1,2])
a<-table.element(a,gqarr[mypoint-kp3+1,3])
a<-table.row.end(a)
}
a<-table.end(a)
table.save(a,file='mytable5.tab')
a<-table.start()
a<-table.row.start(a)
a<-table.element(a,'Meta Analysis of Goldfeld-Quandt test for Heteroskedasticity',4,TRUE)
a<-table.row.end(a)
a<-table.row.start(a)
a<-table.element(a,'Description',header=TRUE)
a<-table.element(a,'# significant tests',header=TRUE)
a<-table.element(a,'% significant tests',header=TRUE)
a<-table.element(a,'OK/NOK',header=TRUE)
a<-table.row.end(a)
a<-table.row.start(a)
a<-table.element(a,'1% type I error level',header=TRUE)
a<-table.element(a,numsignificant1)
a<-table.element(a,numsignificant1/numgqtests)
if (numsignificant1/numgqtests < 0.01) dum <- 'OK' else dum <- 'NOK'
a<-table.element(a,dum)
a<-table.row.end(a)
a<-table.row.start(a)
a<-table.element(a,'5% type I error level',header=TRUE)
a<-table.element(a,numsignificant5)
a<-table.element(a,numsignificant5/numgqtests)
if (numsignificant5/numgqtests < 0.05) dum <- 'OK' else dum <- 'NOK'
a<-table.element(a,dum)
a<-table.row.end(a)
a<-table.row.start(a)
a<-table.element(a,'10% type I error level',header=TRUE)
a<-table.element(a,numsignificant10)
a<-table.element(a,numsignificant10/numgqtests)
if (numsignificant10/numgqtests < 0.1) dum <- 'OK' else dum <- 'NOK'
a<-table.element(a,dum)
a<-table.row.end(a)
a<-table.end(a)
table.save(a,file='mytable6.tab')
}