Free Statistics

of Irreproducible Research!

Author's title

Author*The author of this computation has been verified*
R Software Modulerwasp_multipleregression.wasp
Title produced by softwareMultiple Regression
Date of computationFri, 20 Nov 2009 16:56:11 -0700
Cite this page as followsStatistical Computations at FreeStatistics.org, Office for Research Development and Education, URL https://freestatistics.org/blog/index.php?v=date/2009/Nov/21/t1258761449fj0riepwocjff52.htm/, Retrieved Sat, 27 Apr 2024 22:03:21 +0000
Statistical Computations at FreeStatistics.org, Office for Research Development and Education, URL https://freestatistics.org/blog/index.php?pk=58493, Retrieved Sat, 27 Apr 2024 22:03:21 +0000
QR Codes:

Original text written by user:
IsPrivate?No (this computation is public)
User-defined keywords
Estimated Impact174
Family? (F = Feedback message, R = changed R code, M = changed R Module, P = changed Parameters, D = changed Data)
-     [Multiple Regression] [Q1 The Seatbeltlaw] [2007-11-14 19:27:43] [8cd6641b921d30ebe00b648d1481bba0]
- RMPD  [Multiple Regression] [Seatbelt] [2009-11-12 13:54:52] [b98453cac15ba1066b407e146608df68]
-    D    [Multiple Regression] [shwws7vr_1] [2009-11-20 20:49:17] [2b2cfeea2f5ac2a1bcb842baaf1415ef]
-   PD        [Multiple Regression] [shwws7vr1] [2009-11-20 23:56:11] [d447d4b3e35da686436a520338c962fc] [Current]
Feedback Forum

Post a new message
Dataseries X:
100.35	102.1
100.35	102.86
100.36	102.99
100.39	103.73
100.34	105.02
100.34	104.43
100.35	104.63
100.43	104.93
100.47	105.87
100.67	105.66
100.75	106.76
100.78	106
100.79	107.22
100.67	107.33
100.64	107.11
100.64	108.86
100.76	107.72
100.79	107.88
100.79	108.38
100.9	107.72
100.98	108.41
101.11	109.9
101.18	111.45
101.22	112.18
101.23	113.34
101.09	113.46
101.26	114.06
101.28	115.54
101.43	116.39
101.53	115.94
101.54	116.97
101.54	115.94
101.79	115.91
102.18	116.43
102.37	116.26
102.46	116.35
102.46	117.9
102.03	117.7
102.26	117.53
102.33	117.86
102.44	117.65
102.5	116.51
102.52	115.93
102.66	115.31
102.72	115


Summary of computational transaction
Raw Inputview raw input (R code)
Raw Outputview raw output of R engine
Computing time5 seconds
R Server'Gwilym Jenkins' @ 72.249.127.135

\begin{tabular}{lllllllll}
\hline
Summary of computational transaction \tabularnewline
Raw Input & view raw input (R code)  \tabularnewline
Raw Output & view raw output of R engine  \tabularnewline
Computing time & 5 seconds \tabularnewline
R Server & 'Gwilym Jenkins' @ 72.249.127.135 \tabularnewline
\hline
\end{tabular}
%Source: https://freestatistics.org/blog/index.php?pk=58493&T=0

[TABLE]
[ROW][C]Summary of computational transaction[/C][/ROW]
[ROW][C]Raw Input[/C][C]view raw input (R code) [/C][/ROW]
[ROW][C]Raw Output[/C][C]view raw output of R engine [/C][/ROW]
[ROW][C]Computing time[/C][C]5 seconds[/C][/ROW]
[ROW][C]R Server[/C][C]'Gwilym Jenkins' @ 72.249.127.135[/C][/ROW]
[/TABLE]
Source: https://freestatistics.org/blog/index.php?pk=58493&T=0

Globally Unique Identifier (entire table): ba.freestatistics.org/blog/index.php?pk=58493&T=0

As an alternative you can also use a QR Code:  

The GUIDs for individual cells are displayed in the table below:

Summary of computational transaction
Raw Inputview raw input (R code)
Raw Outputview raw output of R engine
Computing time5 seconds
R Server'Gwilym Jenkins' @ 72.249.127.135


Multiple Linear Regression - Estimated Regression Equation
Ktot[t] = + 105.065867086302 -0.0486175142110252Vmtot[t] + 0.0380062117884138M1[t] -0.201647603739741M2[t] -0.179270889616640M3[t] -0.173762836424627M4[t] -0.158416651952784M5[t] -0.21222427121419M6[t] -0.26500251046336M7[t] -0.283688585939234M8[t] -0.237265212191018M9[t] -0.0543179461956548M10[t] + 0.0224500909672896M11[t] + 0.0767557745848375t + e[t]

\begin{tabular}{lllllllll}
\hline
Multiple Linear Regression - Estimated Regression Equation \tabularnewline
Ktot[t] =  +  105.065867086302 -0.0486175142110252Vmtot[t] +  0.0380062117884138M1[t] -0.201647603739741M2[t] -0.179270889616640M3[t] -0.173762836424627M4[t] -0.158416651952784M5[t] -0.21222427121419M6[t] -0.26500251046336M7[t] -0.283688585939234M8[t] -0.237265212191018M9[t] -0.0543179461956548M10[t] +  0.0224500909672896M11[t] +  0.0767557745848375t  + e[t] \tabularnewline
\hline
\end{tabular}
%Source: https://freestatistics.org/blog/index.php?pk=58493&T=1

[TABLE]
[ROW][C]Multiple Linear Regression - Estimated Regression Equation[/C][/ROW]
[ROW][C]Ktot[t] =  +  105.065867086302 -0.0486175142110252Vmtot[t] +  0.0380062117884138M1[t] -0.201647603739741M2[t] -0.179270889616640M3[t] -0.173762836424627M4[t] -0.158416651952784M5[t] -0.21222427121419M6[t] -0.26500251046336M7[t] -0.283688585939234M8[t] -0.237265212191018M9[t] -0.0543179461956548M10[t] +  0.0224500909672896M11[t] +  0.0767557745848375t  + e[t][/C][/ROW]
[/TABLE]
Source: https://freestatistics.org/blog/index.php?pk=58493&T=1

Globally Unique Identifier (entire table): ba.freestatistics.org/blog/index.php?pk=58493&T=1

As an alternative you can also use a QR Code:  

The GUIDs for individual cells are displayed in the table below:

Multiple Linear Regression - Estimated Regression Equation
Ktot[t] = + 105.065867086302 -0.0486175142110252Vmtot[t] + 0.0380062117884138M1[t] -0.201647603739741M2[t] -0.179270889616640M3[t] -0.173762836424627M4[t] -0.158416651952784M5[t] -0.21222427121419M6[t] -0.26500251046336M7[t] -0.283688585939234M8[t] -0.237265212191018M9[t] -0.0543179461956548M10[t] + 0.0224500909672896M11[t] + 0.0767557745848375t + e[t]


Multiple Linear Regression - Ordinary Least Squares
VariableParameterS.D.T-STATH0: parameter = 02-tail p-value1-tail p-value
(Intercept)105.0658670863022.26554746.375500
Vmtot-0.04861751421102520.022122-2.19770.0355650.017782
M10.03800621178841380.1566930.24260.809950.404975
M2-0.2016476037397410.156255-1.29050.2064180.103209
M3-0.1792708896166400.155919-1.14980.2590310.129516
M4-0.1737628364246270.156724-1.10870.2760790.13804
M5-0.1584166519527840.156277-1.01370.3185770.159289
M6-0.212224271214190.155908-1.36120.183260.09163
M7-0.265002510463360.156041-1.69830.099470.049735
M8-0.2836885859392340.158481-1.790.0832190.04161
M9-0.2372652121910180.158833-1.49380.1453370.072669
M10-0.05431794619565480.166577-0.32610.7465530.373276
M110.02245009096728960.1667150.13470.893750.446875
t0.07675577458483750.0088688.655800

\begin{tabular}{lllllllll}
\hline
Multiple Linear Regression - Ordinary Least Squares \tabularnewline
Variable & Parameter & S.D. & T-STATH0: parameter = 0 & 2-tail p-value & 1-tail p-value \tabularnewline
(Intercept) & 105.065867086302 & 2.265547 & 46.3755 & 0 & 0 \tabularnewline
Vmtot & -0.0486175142110252 & 0.022122 & -2.1977 & 0.035565 & 0.017782 \tabularnewline
M1 & 0.0380062117884138 & 0.156693 & 0.2426 & 0.80995 & 0.404975 \tabularnewline
M2 & -0.201647603739741 & 0.156255 & -1.2905 & 0.206418 & 0.103209 \tabularnewline
M3 & -0.179270889616640 & 0.155919 & -1.1498 & 0.259031 & 0.129516 \tabularnewline
M4 & -0.173762836424627 & 0.156724 & -1.1087 & 0.276079 & 0.13804 \tabularnewline
M5 & -0.158416651952784 & 0.156277 & -1.0137 & 0.318577 & 0.159289 \tabularnewline
M6 & -0.21222427121419 & 0.155908 & -1.3612 & 0.18326 & 0.09163 \tabularnewline
M7 & -0.26500251046336 & 0.156041 & -1.6983 & 0.09947 & 0.049735 \tabularnewline
M8 & -0.283688585939234 & 0.158481 & -1.79 & 0.083219 & 0.04161 \tabularnewline
M9 & -0.237265212191018 & 0.158833 & -1.4938 & 0.145337 & 0.072669 \tabularnewline
M10 & -0.0543179461956548 & 0.166577 & -0.3261 & 0.746553 & 0.373276 \tabularnewline
M11 & 0.0224500909672896 & 0.166715 & 0.1347 & 0.89375 & 0.446875 \tabularnewline
t & 0.0767557745848375 & 0.008868 & 8.6558 & 0 & 0 \tabularnewline
\hline
\end{tabular}
%Source: https://freestatistics.org/blog/index.php?pk=58493&T=2

[TABLE]
[ROW][C]Multiple Linear Regression - Ordinary Least Squares[/C][/ROW]
[ROW][C]Variable[/C][C]Parameter[/C][C]S.D.[/C][C]T-STATH0: parameter = 0[/C][C]2-tail p-value[/C][C]1-tail p-value[/C][/ROW]
[ROW][C](Intercept)[/C][C]105.065867086302[/C][C]2.265547[/C][C]46.3755[/C][C]0[/C][C]0[/C][/ROW]
[ROW][C]Vmtot[/C][C]-0.0486175142110252[/C][C]0.022122[/C][C]-2.1977[/C][C]0.035565[/C][C]0.017782[/C][/ROW]
[ROW][C]M1[/C][C]0.0380062117884138[/C][C]0.156693[/C][C]0.2426[/C][C]0.80995[/C][C]0.404975[/C][/ROW]
[ROW][C]M2[/C][C]-0.201647603739741[/C][C]0.156255[/C][C]-1.2905[/C][C]0.206418[/C][C]0.103209[/C][/ROW]
[ROW][C]M3[/C][C]-0.179270889616640[/C][C]0.155919[/C][C]-1.1498[/C][C]0.259031[/C][C]0.129516[/C][/ROW]
[ROW][C]M4[/C][C]-0.173762836424627[/C][C]0.156724[/C][C]-1.1087[/C][C]0.276079[/C][C]0.13804[/C][/ROW]
[ROW][C]M5[/C][C]-0.158416651952784[/C][C]0.156277[/C][C]-1.0137[/C][C]0.318577[/C][C]0.159289[/C][/ROW]
[ROW][C]M6[/C][C]-0.21222427121419[/C][C]0.155908[/C][C]-1.3612[/C][C]0.18326[/C][C]0.09163[/C][/ROW]
[ROW][C]M7[/C][C]-0.26500251046336[/C][C]0.156041[/C][C]-1.6983[/C][C]0.09947[/C][C]0.049735[/C][/ROW]
[ROW][C]M8[/C][C]-0.283688585939234[/C][C]0.158481[/C][C]-1.79[/C][C]0.083219[/C][C]0.04161[/C][/ROW]
[ROW][C]M9[/C][C]-0.237265212191018[/C][C]0.158833[/C][C]-1.4938[/C][C]0.145337[/C][C]0.072669[/C][/ROW]
[ROW][C]M10[/C][C]-0.0543179461956548[/C][C]0.166577[/C][C]-0.3261[/C][C]0.746553[/C][C]0.373276[/C][/ROW]
[ROW][C]M11[/C][C]0.0224500909672896[/C][C]0.166715[/C][C]0.1347[/C][C]0.89375[/C][C]0.446875[/C][/ROW]
[ROW][C]t[/C][C]0.0767557745848375[/C][C]0.008868[/C][C]8.6558[/C][C]0[/C][C]0[/C][/ROW]
[/TABLE]
Source: https://freestatistics.org/blog/index.php?pk=58493&T=2

Globally Unique Identifier (entire table): ba.freestatistics.org/blog/index.php?pk=58493&T=2

As an alternative you can also use a QR Code:  

The GUIDs for individual cells are displayed in the table below:

Multiple Linear Regression - Ordinary Least Squares
VariableParameterS.D.T-STATH0: parameter = 02-tail p-value1-tail p-value
(Intercept)105.0658670863022.26554746.375500
Vmtot-0.04861751421102520.022122-2.19770.0355650.017782
M10.03800621178841380.1566930.24260.809950.404975
M2-0.2016476037397410.156255-1.29050.2064180.103209
M3-0.1792708896166400.155919-1.14980.2590310.129516
M4-0.1737628364246270.156724-1.10870.2760790.13804
M5-0.1584166519527840.156277-1.01370.3185770.159289
M6-0.212224271214190.155908-1.36120.183260.09163
M7-0.265002510463360.156041-1.69830.099470.049735
M8-0.2836885859392340.158481-1.790.0832190.04161
M9-0.2372652121910180.158833-1.49380.1453370.072669
M10-0.05431794619565480.166577-0.32610.7465530.373276
M110.02245009096728960.1667150.13470.893750.446875
t0.07675577458483750.0088688.655800


Multiple Linear Regression - Regression Statistics
Multiple R0.975852123483842
R-squared0.952287366907923
Adjusted R-squared0.932278843353181
F-TEST (value)47.5940848060344
F-TEST (DF numerator)13
F-TEST (DF denominator)31
p-value1.11022302462516e-16
Multiple Linear Regression - Residual Statistics
Residual Standard Deviation0.20392119736432
Sum Squared Residuals1.28909949676944

\begin{tabular}{lllllllll}
\hline
Multiple Linear Regression - Regression Statistics \tabularnewline
Multiple R & 0.975852123483842 \tabularnewline
R-squared & 0.952287366907923 \tabularnewline
Adjusted R-squared & 0.932278843353181 \tabularnewline
F-TEST (value) & 47.5940848060344 \tabularnewline
F-TEST (DF numerator) & 13 \tabularnewline
F-TEST (DF denominator) & 31 \tabularnewline
p-value & 1.11022302462516e-16 \tabularnewline
Multiple Linear Regression - Residual Statistics \tabularnewline
Residual Standard Deviation & 0.20392119736432 \tabularnewline
Sum Squared Residuals & 1.28909949676944 \tabularnewline
\hline
\end{tabular}
%Source: https://freestatistics.org/blog/index.php?pk=58493&T=3

[TABLE]
[ROW][C]Multiple Linear Regression - Regression Statistics[/C][/ROW]
[ROW][C]Multiple R[/C][C]0.975852123483842[/C][/ROW]
[ROW][C]R-squared[/C][C]0.952287366907923[/C][/ROW]
[ROW][C]Adjusted R-squared[/C][C]0.932278843353181[/C][/ROW]
[ROW][C]F-TEST (value)[/C][C]47.5940848060344[/C][/ROW]
[ROW][C]F-TEST (DF numerator)[/C][C]13[/C][/ROW]
[ROW][C]F-TEST (DF denominator)[/C][C]31[/C][/ROW]
[ROW][C]p-value[/C][C]1.11022302462516e-16[/C][/ROW]
[ROW][C]Multiple Linear Regression - Residual Statistics[/C][/ROW]
[ROW][C]Residual Standard Deviation[/C][C]0.20392119736432[/C][/ROW]
[ROW][C]Sum Squared Residuals[/C][C]1.28909949676944[/C][/ROW]
[/TABLE]
Source: https://freestatistics.org/blog/index.php?pk=58493&T=3

Globally Unique Identifier (entire table): ba.freestatistics.org/blog/index.php?pk=58493&T=3

As an alternative you can also use a QR Code:  

The GUIDs for individual cells are displayed in the table below:

Multiple Linear Regression - Regression Statistics
Multiple R0.975852123483842
R-squared0.952287366907923
Adjusted R-squared0.932278843353181
F-TEST (value)47.5940848060344
F-TEST (DF numerator)13
F-TEST (DF denominator)31
p-value1.11022302462516e-16
Multiple Linear Regression - Residual Statistics
Residual Standard Deviation0.20392119736432
Sum Squared Residuals1.28909949676944


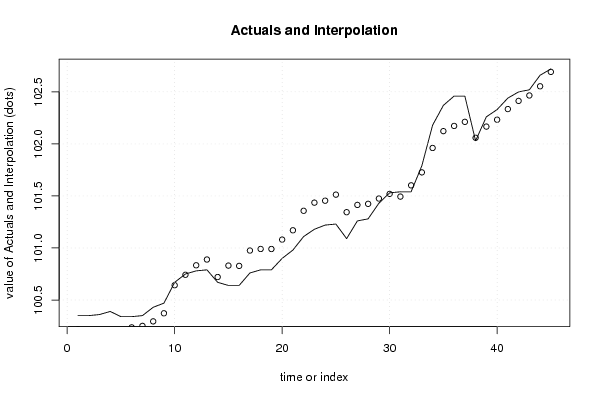
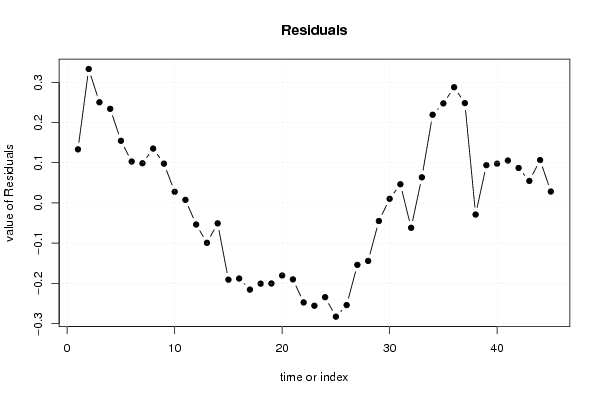
Multiple Linear Regression - Actuals, Interpolation, and Residuals
Time or IndexActualsInterpolationForecastResidualsPrediction Error
1100.35100.2167808717300.133219128270414
2100.35100.0169335199860.333066480014129
3100.36100.1097457318460.250254268153627
4100.39100.1560325991070.233967400892937
5100.34100.1854179648320.154582035168482
6100.34100.2370504535390.102949546460546
7100.35100.2513044860330.0986955139670732
8100.43100.2947889308790.135211069121431
9100.47100.3722676158530.0977323841467326
10100.67100.6421803344180.0278196655822193
11100.75100.7422248805330.00777511946656353
12100.78100.833479874951-0.0534798749513622
13100.79100.888928493987-0.0989284939871578
14100.67100.720682526481-0.0506825264806321
15100.64100.830510868315-0.190510868314998
16100.64100.827694046223-0.187694046222554
17100.76100.975219971480-0.215219971479798
18100.79100.990389324529-0.200389324529465
19100.79100.990058102760-0.20005810275962
20100.9101.080215361248-0.18021536124786
21100.98101.169848424775-0.189848424775308
22101.11101.357111369181-0.247111369181086
23101.18101.435278033902-0.255278033901771
24101.22101.454092932145-0.234092932145278
25101.23101.512458602034-0.282458602033736
26101.09101.343726459385-0.253726459385096
27101.26101.413688439566-0.153688439566418
28101.28101.423998346311-0.143998346310954
29101.43101.474775418288-0.0447754182882581
30101.53101.5196014550070.0103985449933431
31101.54101.4935029507050.0464970492950365
32101.54101.601648689451-0.0616486894512825
33101.79101.7262863632110.0637136367893329
34102.18101.9607082964010.219291703598866
35102.37102.1224970855650.247502914435208
36102.46102.1724271929030.287572807096641
37102.46102.2118320322500.248167967750479
38102.03102.058657494148-0.0286574941484009
39102.26102.1660549602720.0939450397277893
40102.33102.2322750083590.0977249916405709
41102.44102.3345866454000.105413354599575
42102.5102.4129587669240.0870412330755766
43102.52102.4651344605020.0548655394975103
44102.66102.5533470184220.106652981577712
45102.72102.6915975961610.0284024038392427

\begin{tabular}{lllllllll}
\hline
Multiple Linear Regression - Actuals, Interpolation, and Residuals \tabularnewline
Time or Index & Actuals & InterpolationForecast & ResidualsPrediction Error \tabularnewline
1 & 100.35 & 100.216780871730 & 0.133219128270414 \tabularnewline
2 & 100.35 & 100.016933519986 & 0.333066480014129 \tabularnewline
3 & 100.36 & 100.109745731846 & 0.250254268153627 \tabularnewline
4 & 100.39 & 100.156032599107 & 0.233967400892937 \tabularnewline
5 & 100.34 & 100.185417964832 & 0.154582035168482 \tabularnewline
6 & 100.34 & 100.237050453539 & 0.102949546460546 \tabularnewline
7 & 100.35 & 100.251304486033 & 0.0986955139670732 \tabularnewline
8 & 100.43 & 100.294788930879 & 0.135211069121431 \tabularnewline
9 & 100.47 & 100.372267615853 & 0.0977323841467326 \tabularnewline
10 & 100.67 & 100.642180334418 & 0.0278196655822193 \tabularnewline
11 & 100.75 & 100.742224880533 & 0.00777511946656353 \tabularnewline
12 & 100.78 & 100.833479874951 & -0.0534798749513622 \tabularnewline
13 & 100.79 & 100.888928493987 & -0.0989284939871578 \tabularnewline
14 & 100.67 & 100.720682526481 & -0.0506825264806321 \tabularnewline
15 & 100.64 & 100.830510868315 & -0.190510868314998 \tabularnewline
16 & 100.64 & 100.827694046223 & -0.187694046222554 \tabularnewline
17 & 100.76 & 100.975219971480 & -0.215219971479798 \tabularnewline
18 & 100.79 & 100.990389324529 & -0.200389324529465 \tabularnewline
19 & 100.79 & 100.990058102760 & -0.20005810275962 \tabularnewline
20 & 100.9 & 101.080215361248 & -0.18021536124786 \tabularnewline
21 & 100.98 & 101.169848424775 & -0.189848424775308 \tabularnewline
22 & 101.11 & 101.357111369181 & -0.247111369181086 \tabularnewline
23 & 101.18 & 101.435278033902 & -0.255278033901771 \tabularnewline
24 & 101.22 & 101.454092932145 & -0.234092932145278 \tabularnewline
25 & 101.23 & 101.512458602034 & -0.282458602033736 \tabularnewline
26 & 101.09 & 101.343726459385 & -0.253726459385096 \tabularnewline
27 & 101.26 & 101.413688439566 & -0.153688439566418 \tabularnewline
28 & 101.28 & 101.423998346311 & -0.143998346310954 \tabularnewline
29 & 101.43 & 101.474775418288 & -0.0447754182882581 \tabularnewline
30 & 101.53 & 101.519601455007 & 0.0103985449933431 \tabularnewline
31 & 101.54 & 101.493502950705 & 0.0464970492950365 \tabularnewline
32 & 101.54 & 101.601648689451 & -0.0616486894512825 \tabularnewline
33 & 101.79 & 101.726286363211 & 0.0637136367893329 \tabularnewline
34 & 102.18 & 101.960708296401 & 0.219291703598866 \tabularnewline
35 & 102.37 & 102.122497085565 & 0.247502914435208 \tabularnewline
36 & 102.46 & 102.172427192903 & 0.287572807096641 \tabularnewline
37 & 102.46 & 102.211832032250 & 0.248167967750479 \tabularnewline
38 & 102.03 & 102.058657494148 & -0.0286574941484009 \tabularnewline
39 & 102.26 & 102.166054960272 & 0.0939450397277893 \tabularnewline
40 & 102.33 & 102.232275008359 & 0.0977249916405709 \tabularnewline
41 & 102.44 & 102.334586645400 & 0.105413354599575 \tabularnewline
42 & 102.5 & 102.412958766924 & 0.0870412330755766 \tabularnewline
43 & 102.52 & 102.465134460502 & 0.0548655394975103 \tabularnewline
44 & 102.66 & 102.553347018422 & 0.106652981577712 \tabularnewline
45 & 102.72 & 102.691597596161 & 0.0284024038392427 \tabularnewline
\hline
\end{tabular}
%Source: https://freestatistics.org/blog/index.php?pk=58493&T=4

[TABLE]
[ROW][C]Multiple Linear Regression - Actuals, Interpolation, and Residuals[/C][/ROW]
[ROW][C]Time or Index[/C][C]Actuals[/C][C]InterpolationForecast[/C][C]ResidualsPrediction Error[/C][/ROW]
[ROW][C]1[/C][C]100.35[/C][C]100.216780871730[/C][C]0.133219128270414[/C][/ROW]
[ROW][C]2[/C][C]100.35[/C][C]100.016933519986[/C][C]0.333066480014129[/C][/ROW]
[ROW][C]3[/C][C]100.36[/C][C]100.109745731846[/C][C]0.250254268153627[/C][/ROW]
[ROW][C]4[/C][C]100.39[/C][C]100.156032599107[/C][C]0.233967400892937[/C][/ROW]
[ROW][C]5[/C][C]100.34[/C][C]100.185417964832[/C][C]0.154582035168482[/C][/ROW]
[ROW][C]6[/C][C]100.34[/C][C]100.237050453539[/C][C]0.102949546460546[/C][/ROW]
[ROW][C]7[/C][C]100.35[/C][C]100.251304486033[/C][C]0.0986955139670732[/C][/ROW]
[ROW][C]8[/C][C]100.43[/C][C]100.294788930879[/C][C]0.135211069121431[/C][/ROW]
[ROW][C]9[/C][C]100.47[/C][C]100.372267615853[/C][C]0.0977323841467326[/C][/ROW]
[ROW][C]10[/C][C]100.67[/C][C]100.642180334418[/C][C]0.0278196655822193[/C][/ROW]
[ROW][C]11[/C][C]100.75[/C][C]100.742224880533[/C][C]0.00777511946656353[/C][/ROW]
[ROW][C]12[/C][C]100.78[/C][C]100.833479874951[/C][C]-0.0534798749513622[/C][/ROW]
[ROW][C]13[/C][C]100.79[/C][C]100.888928493987[/C][C]-0.0989284939871578[/C][/ROW]
[ROW][C]14[/C][C]100.67[/C][C]100.720682526481[/C][C]-0.0506825264806321[/C][/ROW]
[ROW][C]15[/C][C]100.64[/C][C]100.830510868315[/C][C]-0.190510868314998[/C][/ROW]
[ROW][C]16[/C][C]100.64[/C][C]100.827694046223[/C][C]-0.187694046222554[/C][/ROW]
[ROW][C]17[/C][C]100.76[/C][C]100.975219971480[/C][C]-0.215219971479798[/C][/ROW]
[ROW][C]18[/C][C]100.79[/C][C]100.990389324529[/C][C]-0.200389324529465[/C][/ROW]
[ROW][C]19[/C][C]100.79[/C][C]100.990058102760[/C][C]-0.20005810275962[/C][/ROW]
[ROW][C]20[/C][C]100.9[/C][C]101.080215361248[/C][C]-0.18021536124786[/C][/ROW]
[ROW][C]21[/C][C]100.98[/C][C]101.169848424775[/C][C]-0.189848424775308[/C][/ROW]
[ROW][C]22[/C][C]101.11[/C][C]101.357111369181[/C][C]-0.247111369181086[/C][/ROW]
[ROW][C]23[/C][C]101.18[/C][C]101.435278033902[/C][C]-0.255278033901771[/C][/ROW]
[ROW][C]24[/C][C]101.22[/C][C]101.454092932145[/C][C]-0.234092932145278[/C][/ROW]
[ROW][C]25[/C][C]101.23[/C][C]101.512458602034[/C][C]-0.282458602033736[/C][/ROW]
[ROW][C]26[/C][C]101.09[/C][C]101.343726459385[/C][C]-0.253726459385096[/C][/ROW]
[ROW][C]27[/C][C]101.26[/C][C]101.413688439566[/C][C]-0.153688439566418[/C][/ROW]
[ROW][C]28[/C][C]101.28[/C][C]101.423998346311[/C][C]-0.143998346310954[/C][/ROW]
[ROW][C]29[/C][C]101.43[/C][C]101.474775418288[/C][C]-0.0447754182882581[/C][/ROW]
[ROW][C]30[/C][C]101.53[/C][C]101.519601455007[/C][C]0.0103985449933431[/C][/ROW]
[ROW][C]31[/C][C]101.54[/C][C]101.493502950705[/C][C]0.0464970492950365[/C][/ROW]
[ROW][C]32[/C][C]101.54[/C][C]101.601648689451[/C][C]-0.0616486894512825[/C][/ROW]
[ROW][C]33[/C][C]101.79[/C][C]101.726286363211[/C][C]0.0637136367893329[/C][/ROW]
[ROW][C]34[/C][C]102.18[/C][C]101.960708296401[/C][C]0.219291703598866[/C][/ROW]
[ROW][C]35[/C][C]102.37[/C][C]102.122497085565[/C][C]0.247502914435208[/C][/ROW]
[ROW][C]36[/C][C]102.46[/C][C]102.172427192903[/C][C]0.287572807096641[/C][/ROW]
[ROW][C]37[/C][C]102.46[/C][C]102.211832032250[/C][C]0.248167967750479[/C][/ROW]
[ROW][C]38[/C][C]102.03[/C][C]102.058657494148[/C][C]-0.0286574941484009[/C][/ROW]
[ROW][C]39[/C][C]102.26[/C][C]102.166054960272[/C][C]0.0939450397277893[/C][/ROW]
[ROW][C]40[/C][C]102.33[/C][C]102.232275008359[/C][C]0.0977249916405709[/C][/ROW]
[ROW][C]41[/C][C]102.44[/C][C]102.334586645400[/C][C]0.105413354599575[/C][/ROW]
[ROW][C]42[/C][C]102.5[/C][C]102.412958766924[/C][C]0.0870412330755766[/C][/ROW]
[ROW][C]43[/C][C]102.52[/C][C]102.465134460502[/C][C]0.0548655394975103[/C][/ROW]
[ROW][C]44[/C][C]102.66[/C][C]102.553347018422[/C][C]0.106652981577712[/C][/ROW]
[ROW][C]45[/C][C]102.72[/C][C]102.691597596161[/C][C]0.0284024038392427[/C][/ROW]
[/TABLE]
Source: https://freestatistics.org/blog/index.php?pk=58493&T=4

Globally Unique Identifier (entire table): ba.freestatistics.org/blog/index.php?pk=58493&T=4

As an alternative you can also use a QR Code:  

The GUIDs for individual cells are displayed in the table below:

Multiple Linear Regression - Actuals, Interpolation, and Residuals
Time or IndexActualsInterpolationForecastResidualsPrediction Error
1100.35100.2167808717300.133219128270414
2100.35100.0169335199860.333066480014129
3100.36100.1097457318460.250254268153627
4100.39100.1560325991070.233967400892937
5100.34100.1854179648320.154582035168482
6100.34100.2370504535390.102949546460546
7100.35100.2513044860330.0986955139670732
8100.43100.2947889308790.135211069121431
9100.47100.3722676158530.0977323841467326
10100.67100.6421803344180.0278196655822193
11100.75100.7422248805330.00777511946656353
12100.78100.833479874951-0.0534798749513622
13100.79100.888928493987-0.0989284939871578
14100.67100.720682526481-0.0506825264806321
15100.64100.830510868315-0.190510868314998
16100.64100.827694046223-0.187694046222554
17100.76100.975219971480-0.215219971479798
18100.79100.990389324529-0.200389324529465
19100.79100.990058102760-0.20005810275962
20100.9101.080215361248-0.18021536124786
21100.98101.169848424775-0.189848424775308
22101.11101.357111369181-0.247111369181086
23101.18101.435278033902-0.255278033901771
24101.22101.454092932145-0.234092932145278
25101.23101.512458602034-0.282458602033736
26101.09101.343726459385-0.253726459385096
27101.26101.413688439566-0.153688439566418
28101.28101.423998346311-0.143998346310954
29101.43101.474775418288-0.0447754182882581
30101.53101.5196014550070.0103985449933431
31101.54101.4935029507050.0464970492950365
32101.54101.601648689451-0.0616486894512825
33101.79101.7262863632110.0637136367893329
34102.18101.9607082964010.219291703598866
35102.37102.1224970855650.247502914435208
36102.46102.1724271929030.287572807096641
37102.46102.2118320322500.248167967750479
38102.03102.058657494148-0.0286574941484009
39102.26102.1660549602720.0939450397277893
40102.33102.2322750083590.0977249916405709
41102.44102.3345866454000.105413354599575
42102.5102.4129587669240.0870412330755766
43102.52102.4651344605020.0548655394975103
44102.66102.5533470184220.106652981577712
45102.72102.6915975961610.0284024038392427


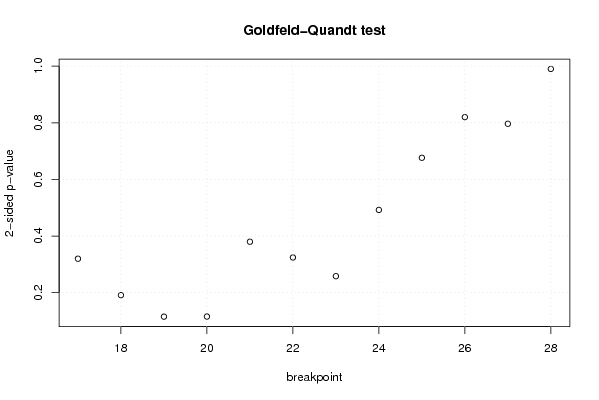
Goldfeld-Quandt test for Heteroskedasticity
p-valuesAlternative Hypothesis
breakpoint indexgreater2-sidedless
170.1598896893206570.3197793786413150.840110310679343
180.09554629556253860.1910925911250770.904453704437461
190.05758855123661760.1151771024732350.942411448763382
200.05774494738783580.1154898947756720.942255052612164
210.1898696908173050.379739381634610.810130309182695
220.1620599182144180.3241198364288360.837940081785582
230.1290441528371920.2580883056743850.870955847162808
240.2460594846573330.4921189693146660.753940515342667
250.661836170018870.6763276599622590.338163829981129
260.5900645637777030.8198708724445950.409935436222297
270.6017793574105660.7964412851788670.398220642589434
280.4950089361036830.9900178722073660.504991063896317

\begin{tabular}{lllllllll}
\hline
Goldfeld-Quandt test for Heteroskedasticity \tabularnewline
p-values & Alternative Hypothesis \tabularnewline
breakpoint index & greater & 2-sided & less \tabularnewline
17 & 0.159889689320657 & 0.319779378641315 & 0.840110310679343 \tabularnewline
18 & 0.0955462955625386 & 0.191092591125077 & 0.904453704437461 \tabularnewline
19 & 0.0575885512366176 & 0.115177102473235 & 0.942411448763382 \tabularnewline
20 & 0.0577449473878358 & 0.115489894775672 & 0.942255052612164 \tabularnewline
21 & 0.189869690817305 & 0.37973938163461 & 0.810130309182695 \tabularnewline
22 & 0.162059918214418 & 0.324119836428836 & 0.837940081785582 \tabularnewline
23 & 0.129044152837192 & 0.258088305674385 & 0.870955847162808 \tabularnewline
24 & 0.246059484657333 & 0.492118969314666 & 0.753940515342667 \tabularnewline
25 & 0.66183617001887 & 0.676327659962259 & 0.338163829981129 \tabularnewline
26 & 0.590064563777703 & 0.819870872444595 & 0.409935436222297 \tabularnewline
27 & 0.601779357410566 & 0.796441285178867 & 0.398220642589434 \tabularnewline
28 & 0.495008936103683 & 0.990017872207366 & 0.504991063896317 \tabularnewline
\hline
\end{tabular}
%Source: https://freestatistics.org/blog/index.php?pk=58493&T=5

[TABLE]
[ROW][C]Goldfeld-Quandt test for Heteroskedasticity[/C][/ROW]
[ROW][C]p-values[/C][C]Alternative Hypothesis[/C][/ROW]
[ROW][C]breakpoint index[/C][C]greater[/C][C]2-sided[/C][C]less[/C][/ROW]
[ROW][C]17[/C][C]0.159889689320657[/C][C]0.319779378641315[/C][C]0.840110310679343[/C][/ROW]
[ROW][C]18[/C][C]0.0955462955625386[/C][C]0.191092591125077[/C][C]0.904453704437461[/C][/ROW]
[ROW][C]19[/C][C]0.0575885512366176[/C][C]0.115177102473235[/C][C]0.942411448763382[/C][/ROW]
[ROW][C]20[/C][C]0.0577449473878358[/C][C]0.115489894775672[/C][C]0.942255052612164[/C][/ROW]
[ROW][C]21[/C][C]0.189869690817305[/C][C]0.37973938163461[/C][C]0.810130309182695[/C][/ROW]
[ROW][C]22[/C][C]0.162059918214418[/C][C]0.324119836428836[/C][C]0.837940081785582[/C][/ROW]
[ROW][C]23[/C][C]0.129044152837192[/C][C]0.258088305674385[/C][C]0.870955847162808[/C][/ROW]
[ROW][C]24[/C][C]0.246059484657333[/C][C]0.492118969314666[/C][C]0.753940515342667[/C][/ROW]
[ROW][C]25[/C][C]0.66183617001887[/C][C]0.676327659962259[/C][C]0.338163829981129[/C][/ROW]
[ROW][C]26[/C][C]0.590064563777703[/C][C]0.819870872444595[/C][C]0.409935436222297[/C][/ROW]
[ROW][C]27[/C][C]0.601779357410566[/C][C]0.796441285178867[/C][C]0.398220642589434[/C][/ROW]
[ROW][C]28[/C][C]0.495008936103683[/C][C]0.990017872207366[/C][C]0.504991063896317[/C][/ROW]
[/TABLE]
Source: https://freestatistics.org/blog/index.php?pk=58493&T=5

Globally Unique Identifier (entire table): ba.freestatistics.org/blog/index.php?pk=58493&T=5

As an alternative you can also use a QR Code:  

The GUIDs for individual cells are displayed in the table below:

Goldfeld-Quandt test for Heteroskedasticity
p-valuesAlternative Hypothesis
breakpoint indexgreater2-sidedless
170.1598896893206570.3197793786413150.840110310679343
180.09554629556253860.1910925911250770.904453704437461
190.05758855123661760.1151771024732350.942411448763382
200.05774494738783580.1154898947756720.942255052612164
210.1898696908173050.379739381634610.810130309182695
220.1620599182144180.3241198364288360.837940081785582
230.1290441528371920.2580883056743850.870955847162808
240.2460594846573330.4921189693146660.753940515342667
250.661836170018870.6763276599622590.338163829981129
260.5900645637777030.8198708724445950.409935436222297
270.6017793574105660.7964412851788670.398220642589434
280.4950089361036830.9900178722073660.504991063896317


Meta Analysis of Goldfeld-Quandt test for Heteroskedasticity
Description# significant tests% significant testsOK/NOK
1% type I error level00OK
5% type I error level00OK
10% type I error level00OK

\begin{tabular}{lllllllll}
\hline
Meta Analysis of Goldfeld-Quandt test for Heteroskedasticity \tabularnewline
Description & # significant tests & % significant tests & OK/NOK \tabularnewline
1% type I error level & 0 & 0 & OK \tabularnewline
5% type I error level & 0 & 0 & OK \tabularnewline
10% type I error level & 0 & 0 & OK \tabularnewline
\hline
\end{tabular}
%Source: https://freestatistics.org/blog/index.php?pk=58493&T=6

[TABLE]
[ROW][C]Meta Analysis of Goldfeld-Quandt test for Heteroskedasticity[/C][/ROW]
[ROW][C]Description[/C][C]# significant tests[/C][C]% significant tests[/C][C]OK/NOK[/C][/ROW]
[ROW][C]1% type I error level[/C][C]0[/C][C]0[/C][C]OK[/C][/ROW]
[ROW][C]5% type I error level[/C][C]0[/C][C]0[/C][C]OK[/C][/ROW]
[ROW][C]10% type I error level[/C][C]0[/C][C]0[/C][C]OK[/C][/ROW]
[/TABLE]
Source: https://freestatistics.org/blog/index.php?pk=58493&T=6

Globally Unique Identifier (entire table): ba.freestatistics.org/blog/index.php?pk=58493&T=6

As an alternative you can also use a QR Code:  

The GUIDs for individual cells are displayed in the table below:

Meta Analysis of Goldfeld-Quandt test for Heteroskedasticity
Description# significant tests% significant testsOK/NOK
1% type I error level00OK
5% type I error level00OK
10% type I error level00OK


Parameters (Session):
par1 = 1 ; par2 = Include Monthly Dummies ; par3 = Linear Trend ;
Parameters (R input):
par1 = 1 ; par2 = Include Monthly Dummies ; par3 = Linear Trend ;
R code (references can be found in the software module):
library(lattice)
library(lmtest)
n25 <- 25 #minimum number of obs. for Goldfeld-Quandt test
par1 <- as.numeric(par1)
x <- t(y)
k <- length(x[1,])
n <- length(x[,1])
x1 <- cbind(x[,par1], x[,1:k!=par1])
mycolnames <- c(colnames(x)[par1], colnames(x)[1:k!=par1])
colnames(x1) <- mycolnames #colnames(x)[par1]
x <- x1
if (par3 == 'First Differences'){
x2 <- array(0, dim=c(n-1,k), dimnames=list(1:(n-1), paste('(1-B)',colnames(x),sep='')))
for (i in 1:n-1) {
for (j in 1:k) {
x2[i,j] <- x[i+1,j] - x[i,j]
}
}
x <- x2
}
if (par2 == 'Include Monthly Dummies'){
x2 <- array(0, dim=c(n,11), dimnames=list(1:n, paste('M', seq(1:11), sep ='')))
for (i in 1:11){
x2[seq(i,n,12),i] <- 1
}
x <- cbind(x, x2)
}
if (par2 == 'Include Quarterly Dummies'){
x2 <- array(0, dim=c(n,3), dimnames=list(1:n, paste('Q', seq(1:3), sep ='')))
for (i in 1:3){
x2[seq(i,n,4),i] <- 1
}
x <- cbind(x, x2)
}
k <- length(x[1,])
if (par3 == 'Linear Trend'){
x <- cbind(x, c(1:n))
colnames(x)[k+1] <- 't'
}
x
k <- length(x[1,])
df <- as.data.frame(x)
(mylm <- lm(df))
(mysum <- summary(mylm))
if (n > n25) {
kp3 <- k + 3
nmkm3 <- n - k - 3
gqarr <- array(NA, dim=c(nmkm3-kp3+1,3))
numgqtests <- 0
numsignificant1 <- 0
numsignificant5 <- 0
numsignificant10 <- 0
for (mypoint in kp3:nmkm3) {
j <- 0
numgqtests <- numgqtests + 1
for (myalt in c('greater', 'two.sided', 'less')) {
j <- j + 1
gqarr[mypoint-kp3+1,j] <- gqtest(mylm, point=mypoint, alternative=myalt)$p.value
}
if (gqarr[mypoint-kp3+1,2] < 0.01) numsignificant1 <- numsignificant1 + 1
if (gqarr[mypoint-kp3+1,2] < 0.05) numsignificant5 <- numsignificant5 + 1
if (gqarr[mypoint-kp3+1,2] < 0.10) numsignificant10 <- numsignificant10 + 1
}
gqarr
}
bitmap(file='test0.png')
plot(x[,1], type='l', main='Actuals and Interpolation', ylab='value of Actuals and Interpolation (dots)', xlab='time or index')
points(x[,1]-mysum$resid)
grid()
dev.off()
bitmap(file='test1.png')
plot(mysum$resid, type='b', pch=19, main='Residuals', ylab='value of Residuals', xlab='time or index')
grid()
dev.off()
bitmap(file='test2.png')
hist(mysum$resid, main='Residual Histogram', xlab='values of Residuals')
grid()
dev.off()
bitmap(file='test3.png')
densityplot(~mysum$resid,col='black',main='Residual Density Plot', xlab='values of Residuals')
dev.off()
bitmap(file='test4.png')
qqnorm(mysum$resid, main='Residual Normal Q-Q Plot')
qqline(mysum$resid)
grid()
dev.off()
(myerror <- as.ts(mysum$resid))
bitmap(file='test5.png')
dum <- cbind(lag(myerror,k=1),myerror)
dum
dum1 <- dum[2:length(myerror),]
dum1
z <- as.data.frame(dum1)
z
plot(z,main=paste('Residual Lag plot, lowess, and regression line'), ylab='values of Residuals', xlab='lagged values of Residuals')
lines(lowess(z))
abline(lm(z))
grid()
dev.off()
bitmap(file='test6.png')
acf(mysum$resid, lag.max=length(mysum$resid)/2, main='Residual Autocorrelation Function')
grid()
dev.off()
bitmap(file='test7.png')
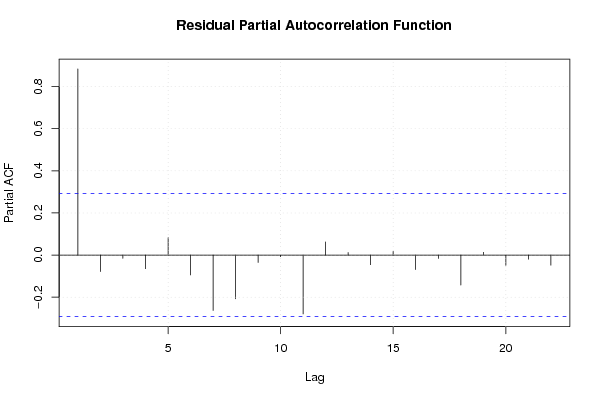
pacf(mysum$resid, lag.max=length(mysum$resid)/2, main='Residual Partial Autocorrelation Function')
grid()
dev.off()
bitmap(file='test8.png')
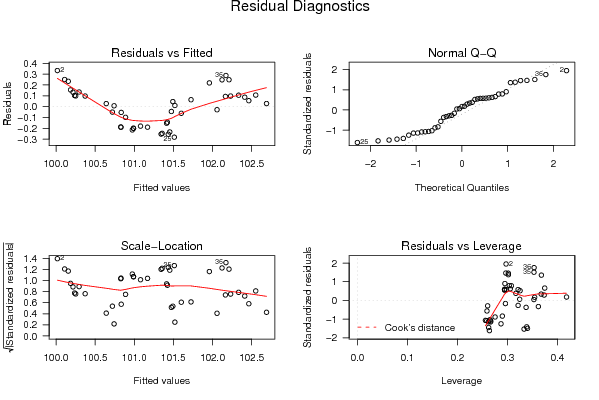
opar <- par(mfrow = c(2,2), oma = c(0, 0, 1.1, 0))
plot(mylm, las = 1, sub='Residual Diagnostics')
par(opar)
dev.off()
if (n > n25) {
bitmap(file='test9.png')
plot(kp3:nmkm3,gqarr[,2], main='Goldfeld-Quandt test',ylab='2-sided p-value',xlab='breakpoint')
grid()
dev.off()
}
load(file='createtable')
a<-table.start()
a<-table.row.start(a)
a<-table.element(a, 'Multiple Linear Regression - Estimated Regression Equation', 1, TRUE)
a<-table.row.end(a)
myeq <- colnames(x)[1]
myeq <- paste(myeq, '[t] = ', sep='')
for (i in 1:k){
if (mysum$coefficients[i,1] > 0) myeq <- paste(myeq, '+', '')
myeq <- paste(myeq, mysum$coefficients[i,1], sep=' ')
if (rownames(mysum$coefficients)[i] != '(Intercept)') {
myeq <- paste(myeq, rownames(mysum$coefficients)[i], sep='')
if (rownames(mysum$coefficients)[i] != 't') myeq <- paste(myeq, '[t]', sep='')
}
}
myeq <- paste(myeq, ' + e[t]')
a<-table.row.start(a)
a<-table.element(a, myeq)
a<-table.row.end(a)
a<-table.end(a)
table.save(a,file='mytable1.tab')
a<-table.start()
a<-table.row.start(a)
a<-table.element(a,hyperlink('ols1.htm','Multiple Linear Regression - Ordinary Least Squares',''), 6, TRUE)
a<-table.row.end(a)
a<-table.row.start(a)
a<-table.element(a,'Variable',header=TRUE)
a<-table.element(a,'Parameter',header=TRUE)
a<-table.element(a,'S.D.',header=TRUE)
a<-table.element(a,'T-STAT
H0: parameter = 0',header=TRUE)
a<-table.element(a,'2-tail p-value',header=TRUE)
a<-table.element(a,'1-tail p-value',header=TRUE)
a<-table.row.end(a)
for (i in 1:k){
a<-table.row.start(a)
a<-table.element(a,rownames(mysum$coefficients)[i],header=TRUE)
a<-table.element(a,mysum$coefficients[i,1])
a<-table.element(a, round(mysum$coefficients[i,2],6))
a<-table.element(a, round(mysum$coefficients[i,3],4))
a<-table.element(a, round(mysum$coefficients[i,4],6))
a<-table.element(a, round(mysum$coefficients[i,4]/2,6))
a<-table.row.end(a)
}
a<-table.end(a)
table.save(a,file='mytable2.tab')
a<-table.start()
a<-table.row.start(a)
a<-table.element(a, 'Multiple Linear Regression - Regression Statistics', 2, TRUE)
a<-table.row.end(a)
a<-table.row.start(a)
a<-table.element(a, 'Multiple R',1,TRUE)
a<-table.element(a, sqrt(mysum$r.squared))
a<-table.row.end(a)
a<-table.row.start(a)
a<-table.element(a, 'R-squared',1,TRUE)
a<-table.element(a, mysum$r.squared)
a<-table.row.end(a)
a<-table.row.start(a)
a<-table.element(a, 'Adjusted R-squared',1,TRUE)
a<-table.element(a, mysum$adj.r.squared)
a<-table.row.end(a)
a<-table.row.start(a)
a<-table.element(a, 'F-TEST (value)',1,TRUE)
a<-table.element(a, mysum$fstatistic[1])
a<-table.row.end(a)
a<-table.row.start(a)
a<-table.element(a, 'F-TEST (DF numerator)',1,TRUE)
a<-table.element(a, mysum$fstatistic[2])
a<-table.row.end(a)
a<-table.row.start(a)
a<-table.element(a, 'F-TEST (DF denominator)',1,TRUE)
a<-table.element(a, mysum$fstatistic[3])
a<-table.row.end(a)
a<-table.row.start(a)
a<-table.element(a, 'p-value',1,TRUE)
a<-table.element(a, 1-pf(mysum$fstatistic[1],mysum$fstatistic[2],mysum$fstatistic[3]))
a<-table.row.end(a)
a<-table.row.start(a)
a<-table.element(a, 'Multiple Linear Regression - Residual Statistics', 2, TRUE)
a<-table.row.end(a)
a<-table.row.start(a)
a<-table.element(a, 'Residual Standard Deviation',1,TRUE)
a<-table.element(a, mysum$sigma)
a<-table.row.end(a)
a<-table.row.start(a)
a<-table.element(a, 'Sum Squared Residuals',1,TRUE)
a<-table.element(a, sum(myerror*myerror))
a<-table.row.end(a)
a<-table.end(a)
table.save(a,file='mytable3.tab')
a<-table.start()
a<-table.row.start(a)
a<-table.element(a, 'Multiple Linear Regression - Actuals, Interpolation, and Residuals', 4, TRUE)
a<-table.row.end(a)
a<-table.row.start(a)
a<-table.element(a, 'Time or Index', 1, TRUE)
a<-table.element(a, 'Actuals', 1, TRUE)
a<-table.element(a, 'Interpolation
Forecast', 1, TRUE)
a<-table.element(a, 'Residuals
Prediction Error', 1, TRUE)
a<-table.row.end(a)
for (i in 1:n) {
a<-table.row.start(a)
a<-table.element(a,i, 1, TRUE)
a<-table.element(a,x[i])
a<-table.element(a,x[i]-mysum$resid[i])
a<-table.element(a,mysum$resid[i])
a<-table.row.end(a)
}
a<-table.end(a)
table.save(a,file='mytable4.tab')
if (n > n25) {
a<-table.start()
a<-table.row.start(a)
a<-table.element(a,'Goldfeld-Quandt test for Heteroskedasticity',4,TRUE)
a<-table.row.end(a)
a<-table.row.start(a)
a<-table.element(a,'p-values',header=TRUE)
a<-table.element(a,'Alternative Hypothesis',3,header=TRUE)
a<-table.row.end(a)
a<-table.row.start(a)
a<-table.element(a,'breakpoint index',header=TRUE)
a<-table.element(a,'greater',header=TRUE)
a<-table.element(a,'2-sided',header=TRUE)
a<-table.element(a,'less',header=TRUE)
a<-table.row.end(a)
for (mypoint in kp3:nmkm3) {
a<-table.row.start(a)
a<-table.element(a,mypoint,header=TRUE)
a<-table.element(a,gqarr[mypoint-kp3+1,1])
a<-table.element(a,gqarr[mypoint-kp3+1,2])
a<-table.element(a,gqarr[mypoint-kp3+1,3])
a<-table.row.end(a)
}
a<-table.end(a)
table.save(a,file='mytable5.tab')
a<-table.start()
a<-table.row.start(a)
a<-table.element(a,'Meta Analysis of Goldfeld-Quandt test for Heteroskedasticity',4,TRUE)
a<-table.row.end(a)
a<-table.row.start(a)
a<-table.element(a,'Description',header=TRUE)
a<-table.element(a,'# significant tests',header=TRUE)
a<-table.element(a,'% significant tests',header=TRUE)
a<-table.element(a,'OK/NOK',header=TRUE)
a<-table.row.end(a)
a<-table.row.start(a)
a<-table.element(a,'1% type I error level',header=TRUE)
a<-table.element(a,numsignificant1)
a<-table.element(a,numsignificant1/numgqtests)
if (numsignificant1/numgqtests < 0.01) dum <- 'OK' else dum <- 'NOK'
a<-table.element(a,dum)
a<-table.row.end(a)
a<-table.row.start(a)
a<-table.element(a,'5% type I error level',header=TRUE)
a<-table.element(a,numsignificant5)
a<-table.element(a,numsignificant5/numgqtests)
if (numsignificant5/numgqtests < 0.05) dum <- 'OK' else dum <- 'NOK'
a<-table.element(a,dum)
a<-table.row.end(a)
a<-table.row.start(a)
a<-table.element(a,'10% type I error level',header=TRUE)
a<-table.element(a,numsignificant10)
a<-table.element(a,numsignificant10/numgqtests)
if (numsignificant10/numgqtests < 0.1) dum <- 'OK' else dum <- 'NOK'
a<-table.element(a,dum)
a<-table.row.end(a)
a<-table.end(a)
table.save(a,file='mytable6.tab')
}