Free Statistics

of Irreproducible Research!

Author's title

Author*The author of this computation has been verified*
R Software Modulerwasp_multipleregression.wasp
Title produced by softwareMultiple Regression
Date of computationFri, 20 Nov 2009 17:01:36 -0700
Cite this page as followsStatistical Computations at FreeStatistics.org, Office for Research Development and Education, URL https://freestatistics.org/blog/index.php?v=date/2009/Nov/21/t1258761751via3oko5a9iooy3.htm/, Retrieved Sun, 28 Apr 2024 01:33:03 +0000
Statistical Computations at FreeStatistics.org, Office for Research Development and Education, URL https://freestatistics.org/blog/index.php?pk=58494, Retrieved Sun, 28 Apr 2024 01:33:03 +0000
QR Codes:

Original text written by user:
IsPrivate?No (this computation is public)
User-defined keywords
Estimated Impact192
Family? (F = Feedback message, R = changed R code, M = changed R Module, P = changed Parameters, D = changed Data)
-     [Multiple Regression] [Q1 The Seatbeltlaw] [2007-11-14 19:27:43] [8cd6641b921d30ebe00b648d1481bba0]
- RMPD  [Multiple Regression] [Seatbelt] [2009-11-12 13:54:52] [b98453cac15ba1066b407e146608df68]
-   PD      [Multiple Regression] [Model 5] [2009-11-21 00:01:36] [7d2d29a9bcbcfc0ea3924e19a42d8563] [Current]
Feedback Forum

Post a new message
Dataseries X:
103.86	93.6	104.08
107.47	104.2	103.86
111.1	95.3	107.47
117.33	102.7	111.1
119.04	103.1	117.33
123.68	100	119.04
125.9	107.2	123.68
124.54	107	125.9
119.39	119	124.54
118.8	110.4	119.39
114.81	101.7	118.8
117.9	102.4	114.81
120.53	98.8	117.9
125.15	105.6	120.53
126.49	104.4	125.15
131.85	106.3	126.49
127.4	107.2	131.85
131.08	108.5	127.4
122.37	106.9	131.08
124.34	114.2	122.37
119.61	125.9	124.34
119.97	110.6	119.61
116.46	110.5	119.97
117.03	106.7	116.46
120.96	104.7	117.03
124.71	107.4	120.96
127.08	109.8	124.71
131.91	103.4	127.08
137.69	114.8	131.91
142.46	114.3	137.69
144.32	109.6	142.46
138.06	118.3	144.32
124.45	127.3	138.06
126.71	112.3	124.45
121.83	114.9	126.71
122.51	108.2	121.83
125.48	105.4	122.51
127.77	122.1	125.48
128.03	113.5	127.77
132.84	110	128.03
133.41	125.3	132.84
139.99	114.3	133.41
138.53	115.6	139.99
136.12	127.1	138.53
124.75	123	136.12
122.88	122.2	124.75
121.46	126.4	122.88
118.4	112.7	121.46
122.45	105.8	118.4
128.94	120.9	122.45
133.25	116.3	128.94
137.94	115.7	133.25
140.04	127.9	137.94
130.74	108.3	140.04
131.55	121.1	130.74
129.47	128.6	131.55
125.45	123.1	129.47
127.87	127.7	125.45
124.68	126.6	127.87


Summary of computational transaction
Raw Inputview raw input (R code)
Raw Outputview raw output of R engine
Computing time3 seconds
R Server'Gwilym Jenkins' @ 72.249.127.135

\begin{tabular}{lllllllll}
\hline
Summary of computational transaction \tabularnewline
Raw Input & view raw input (R code)  \tabularnewline
Raw Output & view raw output of R engine  \tabularnewline
Computing time & 3 seconds \tabularnewline
R Server & 'Gwilym Jenkins' @ 72.249.127.135 \tabularnewline
\hline
\end{tabular}
%Source: https://freestatistics.org/blog/index.php?pk=58494&T=0

[TABLE]
[ROW][C]Summary of computational transaction[/C][/ROW]
[ROW][C]Raw Input[/C][C]view raw input (R code) [/C][/ROW]
[ROW][C]Raw Output[/C][C]view raw output of R engine [/C][/ROW]
[ROW][C]Computing time[/C][C]3 seconds[/C][/ROW]
[ROW][C]R Server[/C][C]'Gwilym Jenkins' @ 72.249.127.135[/C][/ROW]
[/TABLE]
Source: https://freestatistics.org/blog/index.php?pk=58494&T=0

Globally Unique Identifier (entire table): ba.freestatistics.org/blog/index.php?pk=58494&T=0

As an alternative you can also use a QR Code:  

The GUIDs for individual cells are displayed in the table below:

Summary of computational transaction
Raw Inputview raw input (R code)
Raw Outputview raw output of R engine
Computing time3 seconds
R Server'Gwilym Jenkins' @ 72.249.127.135


Multiple Linear Regression - Estimated Regression Equation
Y[t] = + 4.10695106045493 + 0.218386375569317X[t] + 0.777029829453182Y1[t] + 2.90011676027211M1[t] + 2.73605265757977M2[t] + 2.83169003558597M3[t] + 6.24422789198119M4[t] + 1.62928897653466M5[t] + 4.27991344256131M6[t] + 0.984204629583514M7[t] -1.71621086446030M8[t] -8.89832924544343M9[t] -0.780062755102813M10[t] -4.41660041423161M11[t] -0.0270101800160684t + e[t]

\begin{tabular}{lllllllll}
\hline
Multiple Linear Regression - Estimated Regression Equation \tabularnewline
Y[t] =  +  4.10695106045493 +  0.218386375569317X[t] +  0.777029829453182Y1[t] +  2.90011676027211M1[t] +  2.73605265757977M2[t] +  2.83169003558597M3[t] +  6.24422789198119M4[t] +  1.62928897653466M5[t] +  4.27991344256131M6[t] +  0.984204629583514M7[t] -1.71621086446030M8[t] -8.89832924544343M9[t] -0.780062755102813M10[t] -4.41660041423161M11[t] -0.0270101800160684t  + e[t] \tabularnewline
\hline
\end{tabular}
%Source: https://freestatistics.org/blog/index.php?pk=58494&T=1

[TABLE]
[ROW][C]Multiple Linear Regression - Estimated Regression Equation[/C][/ROW]
[ROW][C]Y[t] =  +  4.10695106045493 +  0.218386375569317X[t] +  0.777029829453182Y1[t] +  2.90011676027211M1[t] +  2.73605265757977M2[t] +  2.83169003558597M3[t] +  6.24422789198119M4[t] +  1.62928897653466M5[t] +  4.27991344256131M6[t] +  0.984204629583514M7[t] -1.71621086446030M8[t] -8.89832924544343M9[t] -0.780062755102813M10[t] -4.41660041423161M11[t] -0.0270101800160684t  + e[t][/C][/ROW]
[/TABLE]
Source: https://freestatistics.org/blog/index.php?pk=58494&T=1

Globally Unique Identifier (entire table): ba.freestatistics.org/blog/index.php?pk=58494&T=1

As an alternative you can also use a QR Code:  

The GUIDs for individual cells are displayed in the table below:

Multiple Linear Regression - Estimated Regression Equation
Y[t] = + 4.10695106045493 + 0.218386375569317X[t] + 0.777029829453182Y1[t] + 2.90011676027211M1[t] + 2.73605265757977M2[t] + 2.83169003558597M3[t] + 6.24422789198119M4[t] + 1.62928897653466M5[t] + 4.27991344256131M6[t] + 0.984204629583514M7[t] -1.71621086446030M8[t] -8.89832924544343M9[t] -0.780062755102813M10[t] -4.41660041423161M11[t] -0.0270101800160684t + e[t]


Multiple Linear Regression - Ordinary Least Squares
VariableParameterS.D.T-STATH0: parameter = 02-tail p-value1-tail p-value
(Intercept)4.1069510604549314.3854180.28550.7766050.388303
X0.2183863755693170.1124621.94190.0585720.029286
Y10.7770298294531820.0867738.954700
M12.900116760272112.0659181.40380.16740.0837
M22.736052657579772.1189241.29120.2033610.101681
M32.831690035585972.0603351.37440.1762830.088141
M46.244227891981192.1020232.97060.0048010.0024
M51.629288976534662.4431180.66690.5083250.254163
M64.279913442561312.3019561.85930.0696870.034843
M70.9842046295835142.4168720.40720.6858190.34291
M8-1.716210864460302.602141-0.65950.5129880.256494
M9-8.898329245443432.782186-3.19830.0025630.001281
M10-0.7800627551028132.203139-0.35410.7249790.362489
M11-4.416600414231612.166337-2.03870.0475120.023756
t-0.02701018001606840.050675-0.5330.596710.298355

\begin{tabular}{lllllllll}
\hline
Multiple Linear Regression - Ordinary Least Squares \tabularnewline
Variable & Parameter & S.D. & T-STATH0: parameter = 0 & 2-tail p-value & 1-tail p-value \tabularnewline
(Intercept) & 4.10695106045493 & 14.385418 & 0.2855 & 0.776605 & 0.388303 \tabularnewline
X & 0.218386375569317 & 0.112462 & 1.9419 & 0.058572 & 0.029286 \tabularnewline
Y1 & 0.777029829453182 & 0.086773 & 8.9547 & 0 & 0 \tabularnewline
M1 & 2.90011676027211 & 2.065918 & 1.4038 & 0.1674 & 0.0837 \tabularnewline
M2 & 2.73605265757977 & 2.118924 & 1.2912 & 0.203361 & 0.101681 \tabularnewline
M3 & 2.83169003558597 & 2.060335 & 1.3744 & 0.176283 & 0.088141 \tabularnewline
M4 & 6.24422789198119 & 2.102023 & 2.9706 & 0.004801 & 0.0024 \tabularnewline
M5 & 1.62928897653466 & 2.443118 & 0.6669 & 0.508325 & 0.254163 \tabularnewline
M6 & 4.27991344256131 & 2.301956 & 1.8593 & 0.069687 & 0.034843 \tabularnewline
M7 & 0.984204629583514 & 2.416872 & 0.4072 & 0.685819 & 0.34291 \tabularnewline
M8 & -1.71621086446030 & 2.602141 & -0.6595 & 0.512988 & 0.256494 \tabularnewline
M9 & -8.89832924544343 & 2.782186 & -3.1983 & 0.002563 & 0.001281 \tabularnewline
M10 & -0.780062755102813 & 2.203139 & -0.3541 & 0.724979 & 0.362489 \tabularnewline
M11 & -4.41660041423161 & 2.166337 & -2.0387 & 0.047512 & 0.023756 \tabularnewline
t & -0.0270101800160684 & 0.050675 & -0.533 & 0.59671 & 0.298355 \tabularnewline
\hline
\end{tabular}
%Source: https://freestatistics.org/blog/index.php?pk=58494&T=2

[TABLE]
[ROW][C]Multiple Linear Regression - Ordinary Least Squares[/C][/ROW]
[ROW][C]Variable[/C][C]Parameter[/C][C]S.D.[/C][C]T-STATH0: parameter = 0[/C][C]2-tail p-value[/C][C]1-tail p-value[/C][/ROW]
[ROW][C](Intercept)[/C][C]4.10695106045493[/C][C]14.385418[/C][C]0.2855[/C][C]0.776605[/C][C]0.388303[/C][/ROW]
[ROW][C]X[/C][C]0.218386375569317[/C][C]0.112462[/C][C]1.9419[/C][C]0.058572[/C][C]0.029286[/C][/ROW]
[ROW][C]Y1[/C][C]0.777029829453182[/C][C]0.086773[/C][C]8.9547[/C][C]0[/C][C]0[/C][/ROW]
[ROW][C]M1[/C][C]2.90011676027211[/C][C]2.065918[/C][C]1.4038[/C][C]0.1674[/C][C]0.0837[/C][/ROW]
[ROW][C]M2[/C][C]2.73605265757977[/C][C]2.118924[/C][C]1.2912[/C][C]0.203361[/C][C]0.101681[/C][/ROW]
[ROW][C]M3[/C][C]2.83169003558597[/C][C]2.060335[/C][C]1.3744[/C][C]0.176283[/C][C]0.088141[/C][/ROW]
[ROW][C]M4[/C][C]6.24422789198119[/C][C]2.102023[/C][C]2.9706[/C][C]0.004801[/C][C]0.0024[/C][/ROW]
[ROW][C]M5[/C][C]1.62928897653466[/C][C]2.443118[/C][C]0.6669[/C][C]0.508325[/C][C]0.254163[/C][/ROW]
[ROW][C]M6[/C][C]4.27991344256131[/C][C]2.301956[/C][C]1.8593[/C][C]0.069687[/C][C]0.034843[/C][/ROW]
[ROW][C]M7[/C][C]0.984204629583514[/C][C]2.416872[/C][C]0.4072[/C][C]0.685819[/C][C]0.34291[/C][/ROW]
[ROW][C]M8[/C][C]-1.71621086446030[/C][C]2.602141[/C][C]-0.6595[/C][C]0.512988[/C][C]0.256494[/C][/ROW]
[ROW][C]M9[/C][C]-8.89832924544343[/C][C]2.782186[/C][C]-3.1983[/C][C]0.002563[/C][C]0.001281[/C][/ROW]
[ROW][C]M10[/C][C]-0.780062755102813[/C][C]2.203139[/C][C]-0.3541[/C][C]0.724979[/C][C]0.362489[/C][/ROW]
[ROW][C]M11[/C][C]-4.41660041423161[/C][C]2.166337[/C][C]-2.0387[/C][C]0.047512[/C][C]0.023756[/C][/ROW]
[ROW][C]t[/C][C]-0.0270101800160684[/C][C]0.050675[/C][C]-0.533[/C][C]0.59671[/C][C]0.298355[/C][/ROW]
[/TABLE]
Source: https://freestatistics.org/blog/index.php?pk=58494&T=2

Globally Unique Identifier (entire table): ba.freestatistics.org/blog/index.php?pk=58494&T=2

As an alternative you can also use a QR Code:  

The GUIDs for individual cells are displayed in the table below:

Multiple Linear Regression - Ordinary Least Squares
VariableParameterS.D.T-STATH0: parameter = 02-tail p-value1-tail p-value
(Intercept)4.1069510604549314.3854180.28550.7766050.388303
X0.2183863755693170.1124621.94190.0585720.029286
Y10.7770298294531820.0867738.954700
M12.900116760272112.0659181.40380.16740.0837
M22.736052657579772.1189241.29120.2033610.101681
M32.831690035585972.0603351.37440.1762830.088141
M46.244227891981192.1020232.97060.0048010.0024
M51.629288976534662.4431180.66690.5083250.254163
M64.279913442561312.3019561.85930.0696870.034843
M70.9842046295835142.4168720.40720.6858190.34291
M8-1.716210864460302.602141-0.65950.5129880.256494
M9-8.898329245443432.782186-3.19830.0025630.001281
M10-0.7800627551028132.203139-0.35410.7249790.362489
M11-4.416600414231612.166337-2.03870.0475120.023756
t-0.02701018001606840.050675-0.5330.596710.298355


Multiple Linear Regression - Regression Statistics
Multiple R0.948824809745246
R-squared0.900268519588102
Adjusted R-squared0.86853577582068
F-TEST (value)28.370333375091
F-TEST (DF numerator)14
F-TEST (DF denominator)44
p-value0
Multiple Linear Regression - Residual Statistics
Residual Standard Deviation2.99332082126786
Sum Squared Residuals394.238659717571

\begin{tabular}{lllllllll}
\hline
Multiple Linear Regression - Regression Statistics \tabularnewline
Multiple R & 0.948824809745246 \tabularnewline
R-squared & 0.900268519588102 \tabularnewline
Adjusted R-squared & 0.86853577582068 \tabularnewline
F-TEST (value) & 28.370333375091 \tabularnewline
F-TEST (DF numerator) & 14 \tabularnewline
F-TEST (DF denominator) & 44 \tabularnewline
p-value & 0 \tabularnewline
Multiple Linear Regression - Residual Statistics \tabularnewline
Residual Standard Deviation & 2.99332082126786 \tabularnewline
Sum Squared Residuals & 394.238659717571 \tabularnewline
\hline
\end{tabular}
%Source: https://freestatistics.org/blog/index.php?pk=58494&T=3

[TABLE]
[ROW][C]Multiple Linear Regression - Regression Statistics[/C][/ROW]
[ROW][C]Multiple R[/C][C]0.948824809745246[/C][/ROW]
[ROW][C]R-squared[/C][C]0.900268519588102[/C][/ROW]
[ROW][C]Adjusted R-squared[/C][C]0.86853577582068[/C][/ROW]
[ROW][C]F-TEST (value)[/C][C]28.370333375091[/C][/ROW]
[ROW][C]F-TEST (DF numerator)[/C][C]14[/C][/ROW]
[ROW][C]F-TEST (DF denominator)[/C][C]44[/C][/ROW]
[ROW][C]p-value[/C][C]0[/C][/ROW]
[ROW][C]Multiple Linear Regression - Residual Statistics[/C][/ROW]
[ROW][C]Residual Standard Deviation[/C][C]2.99332082126786[/C][/ROW]
[ROW][C]Sum Squared Residuals[/C][C]394.238659717571[/C][/ROW]
[/TABLE]
Source: https://freestatistics.org/blog/index.php?pk=58494&T=3

Globally Unique Identifier (entire table): ba.freestatistics.org/blog/index.php?pk=58494&T=3

As an alternative you can also use a QR Code:  

The GUIDs for individual cells are displayed in the table below:

Multiple Linear Regression - Regression Statistics
Multiple R0.948824809745246
R-squared0.900268519588102
Adjusted R-squared0.86853577582068
F-TEST (value)28.370333375091
F-TEST (DF numerator)14
F-TEST (DF denominator)44
p-value0
Multiple Linear Regression - Residual Statistics
Residual Standard Deviation2.99332082126786
Sum Squared Residuals394.238659717571


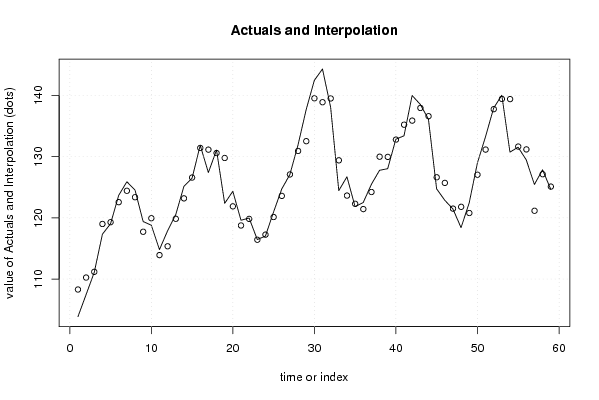
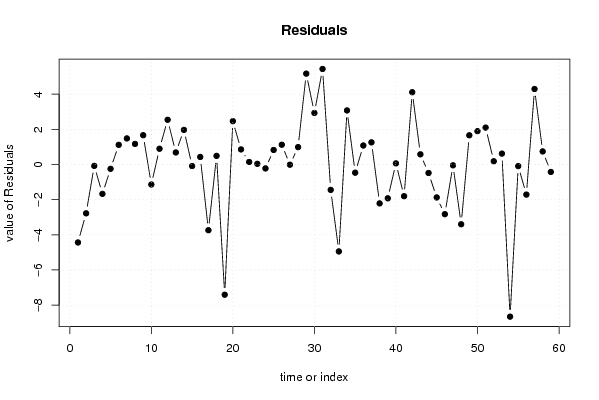
Multiple Linear Regression - Actuals, Interpolation, and Residuals
Time or IndexActualsInterpolationForecastResidualsPrediction Error
1103.86108.294287043486-4.43428704348628
2107.47110.247161779333-2.77716177933291
3111.1111.177227919082-0.0772279190820975
4117.33118.999433055589-1.66943305558926
5119.04119.285734347848-0.245734347847702
6123.68122.5610718779581.11892812204165
7125.9124.4161531977261.48384680227368
8124.54123.3700564699391.16994353006135
9119.39117.7248038477151.66519615228506
10118.8119.936233706459-1.13623370645947
11114.81113.9142768004840.895723199515833
12117.9115.356388478082.54361152191997
13120.53119.8443262792970.685673720703138
14125.15123.1818678019221.96813219807833
15126.49126.578309161302-0.0883091613023478
16131.85131.4199909227300.430009077269542
17127.4131.139469451149-3.73946945114928
18131.08130.5892032843330.490796715666681
19122.37129.776535862816-7.40653586281628
20124.34121.8754009158752.46459908412482
21119.61118.7521417130600.85785828694023
22119.97119.8267353838600.143264616139788
23116.46116.4210796457620.0389203542384318
24117.03117.253426951433-0.223426951433023
25120.96120.1326677833390.827332216661246
26124.71123.5849639444181.1250360555815
27127.08127.091580304224-0.0115803042244265
28131.91130.9209958727640.989004127236
29137.69132.5217055350505.16829446494953
30142.46139.5273590475162.93264095248422
31144.32138.8846563758385.43534362416217
32138.06139.502467652014-1.44246765201390
33124.45129.394609738762-4.94460973876165
34126.71123.6346944366893.07530556331136
35121.83122.295038588588-0.465038588588186
36122.51121.4295345387581.08046546124223
37125.48124.2195395514481.26046044855211
38127.77129.983296334223-2.21329633422303
39128.03129.953199011765-1.92319901176482
40132.84132.7764021293090.0635978706908114
41133.41135.213278059727-1.80327805972695
42139.99135.8775492172634.11245078273666
43138.53137.9515887903120.578411209688453
44136.12136.601142884297-0.481142884297153
45124.75126.623988294482-1.8739882944816
46122.88125.705706343468-2.82570634346801
47121.46121.506335500637-0.0463355006368328
48118.4121.800650031729-3.40065003172919
49122.45120.7891793424301.66082065756978
50128.94127.0427101401041.89728985989611
51133.25131.1496836036262.10031639637369
52137.94137.7531780196070.186821980392906
53140.04139.4198126062260.620187393774412
54130.74139.394816572929-8.65481657292921
55131.55131.641065773308-0.0910657733080271
56129.47131.180932077875-1.71093207787511
57125.45121.1544564059824.29554359401796
58127.87127.1266301295240.743369870476339
59124.68125.103269464529-0.423269464529245

\begin{tabular}{lllllllll}
\hline
Multiple Linear Regression - Actuals, Interpolation, and Residuals \tabularnewline
Time or Index & Actuals & InterpolationForecast & ResidualsPrediction Error \tabularnewline
1 & 103.86 & 108.294287043486 & -4.43428704348628 \tabularnewline
2 & 107.47 & 110.247161779333 & -2.77716177933291 \tabularnewline
3 & 111.1 & 111.177227919082 & -0.0772279190820975 \tabularnewline
4 & 117.33 & 118.999433055589 & -1.66943305558926 \tabularnewline
5 & 119.04 & 119.285734347848 & -0.245734347847702 \tabularnewline
6 & 123.68 & 122.561071877958 & 1.11892812204165 \tabularnewline
7 & 125.9 & 124.416153197726 & 1.48384680227368 \tabularnewline
8 & 124.54 & 123.370056469939 & 1.16994353006135 \tabularnewline
9 & 119.39 & 117.724803847715 & 1.66519615228506 \tabularnewline
10 & 118.8 & 119.936233706459 & -1.13623370645947 \tabularnewline
11 & 114.81 & 113.914276800484 & 0.895723199515833 \tabularnewline
12 & 117.9 & 115.35638847808 & 2.54361152191997 \tabularnewline
13 & 120.53 & 119.844326279297 & 0.685673720703138 \tabularnewline
14 & 125.15 & 123.181867801922 & 1.96813219807833 \tabularnewline
15 & 126.49 & 126.578309161302 & -0.0883091613023478 \tabularnewline
16 & 131.85 & 131.419990922730 & 0.430009077269542 \tabularnewline
17 & 127.4 & 131.139469451149 & -3.73946945114928 \tabularnewline
18 & 131.08 & 130.589203284333 & 0.490796715666681 \tabularnewline
19 & 122.37 & 129.776535862816 & -7.40653586281628 \tabularnewline
20 & 124.34 & 121.875400915875 & 2.46459908412482 \tabularnewline
21 & 119.61 & 118.752141713060 & 0.85785828694023 \tabularnewline
22 & 119.97 & 119.826735383860 & 0.143264616139788 \tabularnewline
23 & 116.46 & 116.421079645762 & 0.0389203542384318 \tabularnewline
24 & 117.03 & 117.253426951433 & -0.223426951433023 \tabularnewline
25 & 120.96 & 120.132667783339 & 0.827332216661246 \tabularnewline
26 & 124.71 & 123.584963944418 & 1.1250360555815 \tabularnewline
27 & 127.08 & 127.091580304224 & -0.0115803042244265 \tabularnewline
28 & 131.91 & 130.920995872764 & 0.989004127236 \tabularnewline
29 & 137.69 & 132.521705535050 & 5.16829446494953 \tabularnewline
30 & 142.46 & 139.527359047516 & 2.93264095248422 \tabularnewline
31 & 144.32 & 138.884656375838 & 5.43534362416217 \tabularnewline
32 & 138.06 & 139.502467652014 & -1.44246765201390 \tabularnewline
33 & 124.45 & 129.394609738762 & -4.94460973876165 \tabularnewline
34 & 126.71 & 123.634694436689 & 3.07530556331136 \tabularnewline
35 & 121.83 & 122.295038588588 & -0.465038588588186 \tabularnewline
36 & 122.51 & 121.429534538758 & 1.08046546124223 \tabularnewline
37 & 125.48 & 124.219539551448 & 1.26046044855211 \tabularnewline
38 & 127.77 & 129.983296334223 & -2.21329633422303 \tabularnewline
39 & 128.03 & 129.953199011765 & -1.92319901176482 \tabularnewline
40 & 132.84 & 132.776402129309 & 0.0635978706908114 \tabularnewline
41 & 133.41 & 135.213278059727 & -1.80327805972695 \tabularnewline
42 & 139.99 & 135.877549217263 & 4.11245078273666 \tabularnewline
43 & 138.53 & 137.951588790312 & 0.578411209688453 \tabularnewline
44 & 136.12 & 136.601142884297 & -0.481142884297153 \tabularnewline
45 & 124.75 & 126.623988294482 & -1.8739882944816 \tabularnewline
46 & 122.88 & 125.705706343468 & -2.82570634346801 \tabularnewline
47 & 121.46 & 121.506335500637 & -0.0463355006368328 \tabularnewline
48 & 118.4 & 121.800650031729 & -3.40065003172919 \tabularnewline
49 & 122.45 & 120.789179342430 & 1.66082065756978 \tabularnewline
50 & 128.94 & 127.042710140104 & 1.89728985989611 \tabularnewline
51 & 133.25 & 131.149683603626 & 2.10031639637369 \tabularnewline
52 & 137.94 & 137.753178019607 & 0.186821980392906 \tabularnewline
53 & 140.04 & 139.419812606226 & 0.620187393774412 \tabularnewline
54 & 130.74 & 139.394816572929 & -8.65481657292921 \tabularnewline
55 & 131.55 & 131.641065773308 & -0.0910657733080271 \tabularnewline
56 & 129.47 & 131.180932077875 & -1.71093207787511 \tabularnewline
57 & 125.45 & 121.154456405982 & 4.29554359401796 \tabularnewline
58 & 127.87 & 127.126630129524 & 0.743369870476339 \tabularnewline
59 & 124.68 & 125.103269464529 & -0.423269464529245 \tabularnewline
\hline
\end{tabular}
%Source: https://freestatistics.org/blog/index.php?pk=58494&T=4

[TABLE]
[ROW][C]Multiple Linear Regression - Actuals, Interpolation, and Residuals[/C][/ROW]
[ROW][C]Time or Index[/C][C]Actuals[/C][C]InterpolationForecast[/C][C]ResidualsPrediction Error[/C][/ROW]
[ROW][C]1[/C][C]103.86[/C][C]108.294287043486[/C][C]-4.43428704348628[/C][/ROW]
[ROW][C]2[/C][C]107.47[/C][C]110.247161779333[/C][C]-2.77716177933291[/C][/ROW]
[ROW][C]3[/C][C]111.1[/C][C]111.177227919082[/C][C]-0.0772279190820975[/C][/ROW]
[ROW][C]4[/C][C]117.33[/C][C]118.999433055589[/C][C]-1.66943305558926[/C][/ROW]
[ROW][C]5[/C][C]119.04[/C][C]119.285734347848[/C][C]-0.245734347847702[/C][/ROW]
[ROW][C]6[/C][C]123.68[/C][C]122.561071877958[/C][C]1.11892812204165[/C][/ROW]
[ROW][C]7[/C][C]125.9[/C][C]124.416153197726[/C][C]1.48384680227368[/C][/ROW]
[ROW][C]8[/C][C]124.54[/C][C]123.370056469939[/C][C]1.16994353006135[/C][/ROW]
[ROW][C]9[/C][C]119.39[/C][C]117.724803847715[/C][C]1.66519615228506[/C][/ROW]
[ROW][C]10[/C][C]118.8[/C][C]119.936233706459[/C][C]-1.13623370645947[/C][/ROW]
[ROW][C]11[/C][C]114.81[/C][C]113.914276800484[/C][C]0.895723199515833[/C][/ROW]
[ROW][C]12[/C][C]117.9[/C][C]115.35638847808[/C][C]2.54361152191997[/C][/ROW]
[ROW][C]13[/C][C]120.53[/C][C]119.844326279297[/C][C]0.685673720703138[/C][/ROW]
[ROW][C]14[/C][C]125.15[/C][C]123.181867801922[/C][C]1.96813219807833[/C][/ROW]
[ROW][C]15[/C][C]126.49[/C][C]126.578309161302[/C][C]-0.0883091613023478[/C][/ROW]
[ROW][C]16[/C][C]131.85[/C][C]131.419990922730[/C][C]0.430009077269542[/C][/ROW]
[ROW][C]17[/C][C]127.4[/C][C]131.139469451149[/C][C]-3.73946945114928[/C][/ROW]
[ROW][C]18[/C][C]131.08[/C][C]130.589203284333[/C][C]0.490796715666681[/C][/ROW]
[ROW][C]19[/C][C]122.37[/C][C]129.776535862816[/C][C]-7.40653586281628[/C][/ROW]
[ROW][C]20[/C][C]124.34[/C][C]121.875400915875[/C][C]2.46459908412482[/C][/ROW]
[ROW][C]21[/C][C]119.61[/C][C]118.752141713060[/C][C]0.85785828694023[/C][/ROW]
[ROW][C]22[/C][C]119.97[/C][C]119.826735383860[/C][C]0.143264616139788[/C][/ROW]
[ROW][C]23[/C][C]116.46[/C][C]116.421079645762[/C][C]0.0389203542384318[/C][/ROW]
[ROW][C]24[/C][C]117.03[/C][C]117.253426951433[/C][C]-0.223426951433023[/C][/ROW]
[ROW][C]25[/C][C]120.96[/C][C]120.132667783339[/C][C]0.827332216661246[/C][/ROW]
[ROW][C]26[/C][C]124.71[/C][C]123.584963944418[/C][C]1.1250360555815[/C][/ROW]
[ROW][C]27[/C][C]127.08[/C][C]127.091580304224[/C][C]-0.0115803042244265[/C][/ROW]
[ROW][C]28[/C][C]131.91[/C][C]130.920995872764[/C][C]0.989004127236[/C][/ROW]
[ROW][C]29[/C][C]137.69[/C][C]132.521705535050[/C][C]5.16829446494953[/C][/ROW]
[ROW][C]30[/C][C]142.46[/C][C]139.527359047516[/C][C]2.93264095248422[/C][/ROW]
[ROW][C]31[/C][C]144.32[/C][C]138.884656375838[/C][C]5.43534362416217[/C][/ROW]
[ROW][C]32[/C][C]138.06[/C][C]139.502467652014[/C][C]-1.44246765201390[/C][/ROW]
[ROW][C]33[/C][C]124.45[/C][C]129.394609738762[/C][C]-4.94460973876165[/C][/ROW]
[ROW][C]34[/C][C]126.71[/C][C]123.634694436689[/C][C]3.07530556331136[/C][/ROW]
[ROW][C]35[/C][C]121.83[/C][C]122.295038588588[/C][C]-0.465038588588186[/C][/ROW]
[ROW][C]36[/C][C]122.51[/C][C]121.429534538758[/C][C]1.08046546124223[/C][/ROW]
[ROW][C]37[/C][C]125.48[/C][C]124.219539551448[/C][C]1.26046044855211[/C][/ROW]
[ROW][C]38[/C][C]127.77[/C][C]129.983296334223[/C][C]-2.21329633422303[/C][/ROW]
[ROW][C]39[/C][C]128.03[/C][C]129.953199011765[/C][C]-1.92319901176482[/C][/ROW]
[ROW][C]40[/C][C]132.84[/C][C]132.776402129309[/C][C]0.0635978706908114[/C][/ROW]
[ROW][C]41[/C][C]133.41[/C][C]135.213278059727[/C][C]-1.80327805972695[/C][/ROW]
[ROW][C]42[/C][C]139.99[/C][C]135.877549217263[/C][C]4.11245078273666[/C][/ROW]
[ROW][C]43[/C][C]138.53[/C][C]137.951588790312[/C][C]0.578411209688453[/C][/ROW]
[ROW][C]44[/C][C]136.12[/C][C]136.601142884297[/C][C]-0.481142884297153[/C][/ROW]
[ROW][C]45[/C][C]124.75[/C][C]126.623988294482[/C][C]-1.8739882944816[/C][/ROW]
[ROW][C]46[/C][C]122.88[/C][C]125.705706343468[/C][C]-2.82570634346801[/C][/ROW]
[ROW][C]47[/C][C]121.46[/C][C]121.506335500637[/C][C]-0.0463355006368328[/C][/ROW]
[ROW][C]48[/C][C]118.4[/C][C]121.800650031729[/C][C]-3.40065003172919[/C][/ROW]
[ROW][C]49[/C][C]122.45[/C][C]120.789179342430[/C][C]1.66082065756978[/C][/ROW]
[ROW][C]50[/C][C]128.94[/C][C]127.042710140104[/C][C]1.89728985989611[/C][/ROW]
[ROW][C]51[/C][C]133.25[/C][C]131.149683603626[/C][C]2.10031639637369[/C][/ROW]
[ROW][C]52[/C][C]137.94[/C][C]137.753178019607[/C][C]0.186821980392906[/C][/ROW]
[ROW][C]53[/C][C]140.04[/C][C]139.419812606226[/C][C]0.620187393774412[/C][/ROW]
[ROW][C]54[/C][C]130.74[/C][C]139.394816572929[/C][C]-8.65481657292921[/C][/ROW]
[ROW][C]55[/C][C]131.55[/C][C]131.641065773308[/C][C]-0.0910657733080271[/C][/ROW]
[ROW][C]56[/C][C]129.47[/C][C]131.180932077875[/C][C]-1.71093207787511[/C][/ROW]
[ROW][C]57[/C][C]125.45[/C][C]121.154456405982[/C][C]4.29554359401796[/C][/ROW]
[ROW][C]58[/C][C]127.87[/C][C]127.126630129524[/C][C]0.743369870476339[/C][/ROW]
[ROW][C]59[/C][C]124.68[/C][C]125.103269464529[/C][C]-0.423269464529245[/C][/ROW]
[/TABLE]
Source: https://freestatistics.org/blog/index.php?pk=58494&T=4

Globally Unique Identifier (entire table): ba.freestatistics.org/blog/index.php?pk=58494&T=4

As an alternative you can also use a QR Code:  

The GUIDs for individual cells are displayed in the table below:

Multiple Linear Regression - Actuals, Interpolation, and Residuals
Time or IndexActualsInterpolationForecastResidualsPrediction Error
1103.86108.294287043486-4.43428704348628
2107.47110.247161779333-2.77716177933291
3111.1111.177227919082-0.0772279190820975
4117.33118.999433055589-1.66943305558926
5119.04119.285734347848-0.245734347847702
6123.68122.5610718779581.11892812204165
7125.9124.4161531977261.48384680227368
8124.54123.3700564699391.16994353006135
9119.39117.7248038477151.66519615228506
10118.8119.936233706459-1.13623370645947
11114.81113.9142768004840.895723199515833
12117.9115.356388478082.54361152191997
13120.53119.8443262792970.685673720703138
14125.15123.1818678019221.96813219807833
15126.49126.578309161302-0.0883091613023478
16131.85131.4199909227300.430009077269542
17127.4131.139469451149-3.73946945114928
18131.08130.5892032843330.490796715666681
19122.37129.776535862816-7.40653586281628
20124.34121.8754009158752.46459908412482
21119.61118.7521417130600.85785828694023
22119.97119.8267353838600.143264616139788
23116.46116.4210796457620.0389203542384318
24117.03117.253426951433-0.223426951433023
25120.96120.1326677833390.827332216661246
26124.71123.5849639444181.1250360555815
27127.08127.091580304224-0.0115803042244265
28131.91130.9209958727640.989004127236
29137.69132.5217055350505.16829446494953
30142.46139.5273590475162.93264095248422
31144.32138.8846563758385.43534362416217
32138.06139.502467652014-1.44246765201390
33124.45129.394609738762-4.94460973876165
34126.71123.6346944366893.07530556331136
35121.83122.295038588588-0.465038588588186
36122.51121.4295345387581.08046546124223
37125.48124.2195395514481.26046044855211
38127.77129.983296334223-2.21329633422303
39128.03129.953199011765-1.92319901176482
40132.84132.7764021293090.0635978706908114
41133.41135.213278059727-1.80327805972695
42139.99135.8775492172634.11245078273666
43138.53137.9515887903120.578411209688453
44136.12136.601142884297-0.481142884297153
45124.75126.623988294482-1.8739882944816
46122.88125.705706343468-2.82570634346801
47121.46121.506335500637-0.0463355006368328
48118.4121.800650031729-3.40065003172919
49122.45120.7891793424301.66082065756978
50128.94127.0427101401041.89728985989611
51133.25131.1496836036262.10031639637369
52137.94137.7531780196070.186821980392906
53140.04139.4198126062260.620187393774412
54130.74139.394816572929-8.65481657292921
55131.55131.641065773308-0.0910657733080271
56129.47131.180932077875-1.71093207787511
57125.45121.1544564059824.29554359401796
58127.87127.1266301295240.743369870476339
59124.68125.103269464529-0.423269464529245


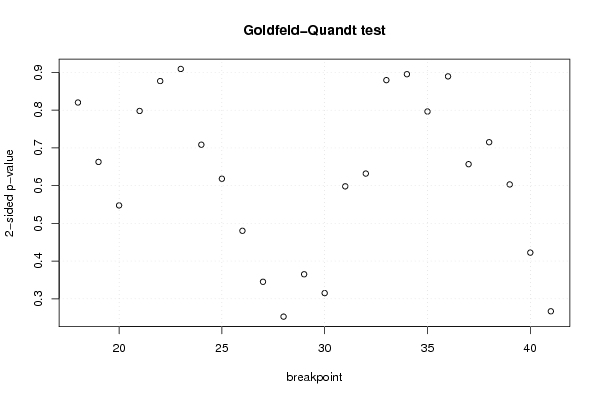
Goldfeld-Quandt test for Heteroskedasticity
p-valuesAlternative Hypothesis
breakpoint indexgreater2-sidedless
180.4101168940752160.8202337881504310.589883105924784
190.6686107062004720.6627785875990570.331389293799528
200.7262114008022030.5475771983955940.273788599197797
210.6010861512953070.7978276974093870.398913848704693
220.5614649203118560.8770701593762880.438535079688144
230.4545749569636240.9091499139272490.545425043036376
240.3542014319409870.7084028638819740.645798568059013
250.3091016196286020.6182032392572040.690898380371398
260.2401477445545660.4802954891091330.759852255445434
270.1725539070644050.3451078141288110.827446092935595
280.1263815227335500.2527630454670990.87361847726645
290.1825399455104940.3650798910209870.817460054489506
300.1575795497098800.3151590994197600.84242045029012
310.2990179230721810.5980358461443620.700982076927819
320.3159556217329420.6319112434658850.684044378267058
330.4397491281303680.8794982562607360.560250871869632
340.4475987576013010.8951975152026010.552401242398699
350.3981651108751640.7963302217503270.601834889124836
360.4447295388946410.8894590777892810.55527046110536
370.3283961365940370.6567922731880740.671603863405963
380.3574902423002420.7149804846004840.642509757699758
390.3015709139854120.6031418279708240.698429086014588
400.2111970901173420.4223941802346840.788802909882658
410.1334697807638240.2669395615276490.866530219236176

\begin{tabular}{lllllllll}
\hline
Goldfeld-Quandt test for Heteroskedasticity \tabularnewline
p-values & Alternative Hypothesis \tabularnewline
breakpoint index & greater & 2-sided & less \tabularnewline
18 & 0.410116894075216 & 0.820233788150431 & 0.589883105924784 \tabularnewline
19 & 0.668610706200472 & 0.662778587599057 & 0.331389293799528 \tabularnewline
20 & 0.726211400802203 & 0.547577198395594 & 0.273788599197797 \tabularnewline
21 & 0.601086151295307 & 0.797827697409387 & 0.398913848704693 \tabularnewline
22 & 0.561464920311856 & 0.877070159376288 & 0.438535079688144 \tabularnewline
23 & 0.454574956963624 & 0.909149913927249 & 0.545425043036376 \tabularnewline
24 & 0.354201431940987 & 0.708402863881974 & 0.645798568059013 \tabularnewline
25 & 0.309101619628602 & 0.618203239257204 & 0.690898380371398 \tabularnewline
26 & 0.240147744554566 & 0.480295489109133 & 0.759852255445434 \tabularnewline
27 & 0.172553907064405 & 0.345107814128811 & 0.827446092935595 \tabularnewline
28 & 0.126381522733550 & 0.252763045467099 & 0.87361847726645 \tabularnewline
29 & 0.182539945510494 & 0.365079891020987 & 0.817460054489506 \tabularnewline
30 & 0.157579549709880 & 0.315159099419760 & 0.84242045029012 \tabularnewline
31 & 0.299017923072181 & 0.598035846144362 & 0.700982076927819 \tabularnewline
32 & 0.315955621732942 & 0.631911243465885 & 0.684044378267058 \tabularnewline
33 & 0.439749128130368 & 0.879498256260736 & 0.560250871869632 \tabularnewline
34 & 0.447598757601301 & 0.895197515202601 & 0.552401242398699 \tabularnewline
35 & 0.398165110875164 & 0.796330221750327 & 0.601834889124836 \tabularnewline
36 & 0.444729538894641 & 0.889459077789281 & 0.55527046110536 \tabularnewline
37 & 0.328396136594037 & 0.656792273188074 & 0.671603863405963 \tabularnewline
38 & 0.357490242300242 & 0.714980484600484 & 0.642509757699758 \tabularnewline
39 & 0.301570913985412 & 0.603141827970824 & 0.698429086014588 \tabularnewline
40 & 0.211197090117342 & 0.422394180234684 & 0.788802909882658 \tabularnewline
41 & 0.133469780763824 & 0.266939561527649 & 0.866530219236176 \tabularnewline
\hline
\end{tabular}
%Source: https://freestatistics.org/blog/index.php?pk=58494&T=5

[TABLE]
[ROW][C]Goldfeld-Quandt test for Heteroskedasticity[/C][/ROW]
[ROW][C]p-values[/C][C]Alternative Hypothesis[/C][/ROW]
[ROW][C]breakpoint index[/C][C]greater[/C][C]2-sided[/C][C]less[/C][/ROW]
[ROW][C]18[/C][C]0.410116894075216[/C][C]0.820233788150431[/C][C]0.589883105924784[/C][/ROW]
[ROW][C]19[/C][C]0.668610706200472[/C][C]0.662778587599057[/C][C]0.331389293799528[/C][/ROW]
[ROW][C]20[/C][C]0.726211400802203[/C][C]0.547577198395594[/C][C]0.273788599197797[/C][/ROW]
[ROW][C]21[/C][C]0.601086151295307[/C][C]0.797827697409387[/C][C]0.398913848704693[/C][/ROW]
[ROW][C]22[/C][C]0.561464920311856[/C][C]0.877070159376288[/C][C]0.438535079688144[/C][/ROW]
[ROW][C]23[/C][C]0.454574956963624[/C][C]0.909149913927249[/C][C]0.545425043036376[/C][/ROW]
[ROW][C]24[/C][C]0.354201431940987[/C][C]0.708402863881974[/C][C]0.645798568059013[/C][/ROW]
[ROW][C]25[/C][C]0.309101619628602[/C][C]0.618203239257204[/C][C]0.690898380371398[/C][/ROW]
[ROW][C]26[/C][C]0.240147744554566[/C][C]0.480295489109133[/C][C]0.759852255445434[/C][/ROW]
[ROW][C]27[/C][C]0.172553907064405[/C][C]0.345107814128811[/C][C]0.827446092935595[/C][/ROW]
[ROW][C]28[/C][C]0.126381522733550[/C][C]0.252763045467099[/C][C]0.87361847726645[/C][/ROW]
[ROW][C]29[/C][C]0.182539945510494[/C][C]0.365079891020987[/C][C]0.817460054489506[/C][/ROW]
[ROW][C]30[/C][C]0.157579549709880[/C][C]0.315159099419760[/C][C]0.84242045029012[/C][/ROW]
[ROW][C]31[/C][C]0.299017923072181[/C][C]0.598035846144362[/C][C]0.700982076927819[/C][/ROW]
[ROW][C]32[/C][C]0.315955621732942[/C][C]0.631911243465885[/C][C]0.684044378267058[/C][/ROW]
[ROW][C]33[/C][C]0.439749128130368[/C][C]0.879498256260736[/C][C]0.560250871869632[/C][/ROW]
[ROW][C]34[/C][C]0.447598757601301[/C][C]0.895197515202601[/C][C]0.552401242398699[/C][/ROW]
[ROW][C]35[/C][C]0.398165110875164[/C][C]0.796330221750327[/C][C]0.601834889124836[/C][/ROW]
[ROW][C]36[/C][C]0.444729538894641[/C][C]0.889459077789281[/C][C]0.55527046110536[/C][/ROW]
[ROW][C]37[/C][C]0.328396136594037[/C][C]0.656792273188074[/C][C]0.671603863405963[/C][/ROW]
[ROW][C]38[/C][C]0.357490242300242[/C][C]0.714980484600484[/C][C]0.642509757699758[/C][/ROW]
[ROW][C]39[/C][C]0.301570913985412[/C][C]0.603141827970824[/C][C]0.698429086014588[/C][/ROW]
[ROW][C]40[/C][C]0.211197090117342[/C][C]0.422394180234684[/C][C]0.788802909882658[/C][/ROW]
[ROW][C]41[/C][C]0.133469780763824[/C][C]0.266939561527649[/C][C]0.866530219236176[/C][/ROW]
[/TABLE]
Source: https://freestatistics.org/blog/index.php?pk=58494&T=5

Globally Unique Identifier (entire table): ba.freestatistics.org/blog/index.php?pk=58494&T=5

As an alternative you can also use a QR Code:  

The GUIDs for individual cells are displayed in the table below:

Goldfeld-Quandt test for Heteroskedasticity
p-valuesAlternative Hypothesis
breakpoint indexgreater2-sidedless
180.4101168940752160.8202337881504310.589883105924784
190.6686107062004720.6627785875990570.331389293799528
200.7262114008022030.5475771983955940.273788599197797
210.6010861512953070.7978276974093870.398913848704693
220.5614649203118560.8770701593762880.438535079688144
230.4545749569636240.9091499139272490.545425043036376
240.3542014319409870.7084028638819740.645798568059013
250.3091016196286020.6182032392572040.690898380371398
260.2401477445545660.4802954891091330.759852255445434
270.1725539070644050.3451078141288110.827446092935595
280.1263815227335500.2527630454670990.87361847726645
290.1825399455104940.3650798910209870.817460054489506
300.1575795497098800.3151590994197600.84242045029012
310.2990179230721810.5980358461443620.700982076927819
320.3159556217329420.6319112434658850.684044378267058
330.4397491281303680.8794982562607360.560250871869632
340.4475987576013010.8951975152026010.552401242398699
350.3981651108751640.7963302217503270.601834889124836
360.4447295388946410.8894590777892810.55527046110536
370.3283961365940370.6567922731880740.671603863405963
380.3574902423002420.7149804846004840.642509757699758
390.3015709139854120.6031418279708240.698429086014588
400.2111970901173420.4223941802346840.788802909882658
410.1334697807638240.2669395615276490.866530219236176


Meta Analysis of Goldfeld-Quandt test for Heteroskedasticity
Description# significant tests% significant testsOK/NOK
1% type I error level00OK
5% type I error level00OK
10% type I error level00OK

\begin{tabular}{lllllllll}
\hline
Meta Analysis of Goldfeld-Quandt test for Heteroskedasticity \tabularnewline
Description & # significant tests & % significant tests & OK/NOK \tabularnewline
1% type I error level & 0 & 0 & OK \tabularnewline
5% type I error level & 0 & 0 & OK \tabularnewline
10% type I error level & 0 & 0 & OK \tabularnewline
\hline
\end{tabular}
%Source: https://freestatistics.org/blog/index.php?pk=58494&T=6

[TABLE]
[ROW][C]Meta Analysis of Goldfeld-Quandt test for Heteroskedasticity[/C][/ROW]
[ROW][C]Description[/C][C]# significant tests[/C][C]% significant tests[/C][C]OK/NOK[/C][/ROW]
[ROW][C]1% type I error level[/C][C]0[/C][C]0[/C][C]OK[/C][/ROW]
[ROW][C]5% type I error level[/C][C]0[/C][C]0[/C][C]OK[/C][/ROW]
[ROW][C]10% type I error level[/C][C]0[/C][C]0[/C][C]OK[/C][/ROW]
[/TABLE]
Source: https://freestatistics.org/blog/index.php?pk=58494&T=6

Globally Unique Identifier (entire table): ba.freestatistics.org/blog/index.php?pk=58494&T=6

As an alternative you can also use a QR Code:  

The GUIDs for individual cells are displayed in the table below:

Meta Analysis of Goldfeld-Quandt test for Heteroskedasticity
Description# significant tests% significant testsOK/NOK
1% type I error level00OK
5% type I error level00OK
10% type I error level00OK


Parameters (Session):
par1 = 1 ; par2 = Include Monthly Dummies ; par3 = Linear Trend ;
Parameters (R input):
par1 = 1 ; par2 = Include Monthly Dummies ; par3 = Linear Trend ;
R code (references can be found in the software module):
library(lattice)
library(lmtest)
n25 <- 25 #minimum number of obs. for Goldfeld-Quandt test
par1 <- as.numeric(par1)
x <- t(y)
k <- length(x[1,])
n <- length(x[,1])
x1 <- cbind(x[,par1], x[,1:k!=par1])
mycolnames <- c(colnames(x)[par1], colnames(x)[1:k!=par1])
colnames(x1) <- mycolnames #colnames(x)[par1]
x <- x1
if (par3 == 'First Differences'){
x2 <- array(0, dim=c(n-1,k), dimnames=list(1:(n-1), paste('(1-B)',colnames(x),sep='')))
for (i in 1:n-1) {
for (j in 1:k) {
x2[i,j] <- x[i+1,j] - x[i,j]
}
}
x <- x2
}
if (par2 == 'Include Monthly Dummies'){
x2 <- array(0, dim=c(n,11), dimnames=list(1:n, paste('M', seq(1:11), sep ='')))
for (i in 1:11){
x2[seq(i,n,12),i] <- 1
}
x <- cbind(x, x2)
}
if (par2 == 'Include Quarterly Dummies'){
x2 <- array(0, dim=c(n,3), dimnames=list(1:n, paste('Q', seq(1:3), sep ='')))
for (i in 1:3){
x2[seq(i,n,4),i] <- 1
}
x <- cbind(x, x2)
}
k <- length(x[1,])
if (par3 == 'Linear Trend'){
x <- cbind(x, c(1:n))
colnames(x)[k+1] <- 't'
}
x
k <- length(x[1,])
df <- as.data.frame(x)
(mylm <- lm(df))
(mysum <- summary(mylm))
if (n > n25) {
kp3 <- k + 3
nmkm3 <- n - k - 3
gqarr <- array(NA, dim=c(nmkm3-kp3+1,3))
numgqtests <- 0
numsignificant1 <- 0
numsignificant5 <- 0
numsignificant10 <- 0
for (mypoint in kp3:nmkm3) {
j <- 0
numgqtests <- numgqtests + 1
for (myalt in c('greater', 'two.sided', 'less')) {
j <- j + 1
gqarr[mypoint-kp3+1,j] <- gqtest(mylm, point=mypoint, alternative=myalt)$p.value
}
if (gqarr[mypoint-kp3+1,2] < 0.01) numsignificant1 <- numsignificant1 + 1
if (gqarr[mypoint-kp3+1,2] < 0.05) numsignificant5 <- numsignificant5 + 1
if (gqarr[mypoint-kp3+1,2] < 0.10) numsignificant10 <- numsignificant10 + 1
}
gqarr
}
bitmap(file='test0.png')
plot(x[,1], type='l', main='Actuals and Interpolation', ylab='value of Actuals and Interpolation (dots)', xlab='time or index')
points(x[,1]-mysum$resid)
grid()
dev.off()
bitmap(file='test1.png')
plot(mysum$resid, type='b', pch=19, main='Residuals', ylab='value of Residuals', xlab='time or index')
grid()
dev.off()
bitmap(file='test2.png')
hist(mysum$resid, main='Residual Histogram', xlab='values of Residuals')
grid()
dev.off()
bitmap(file='test3.png')
densityplot(~mysum$resid,col='black',main='Residual Density Plot', xlab='values of Residuals')
dev.off()
bitmap(file='test4.png')
qqnorm(mysum$resid, main='Residual Normal Q-Q Plot')
qqline(mysum$resid)
grid()
dev.off()
(myerror <- as.ts(mysum$resid))
bitmap(file='test5.png')
dum <- cbind(lag(myerror,k=1),myerror)
dum
dum1 <- dum[2:length(myerror),]
dum1
z <- as.data.frame(dum1)
z
plot(z,main=paste('Residual Lag plot, lowess, and regression line'), ylab='values of Residuals', xlab='lagged values of Residuals')
lines(lowess(z))
abline(lm(z))
grid()
dev.off()
bitmap(file='test6.png')
acf(mysum$resid, lag.max=length(mysum$resid)/2, main='Residual Autocorrelation Function')
grid()
dev.off()
bitmap(file='test7.png')
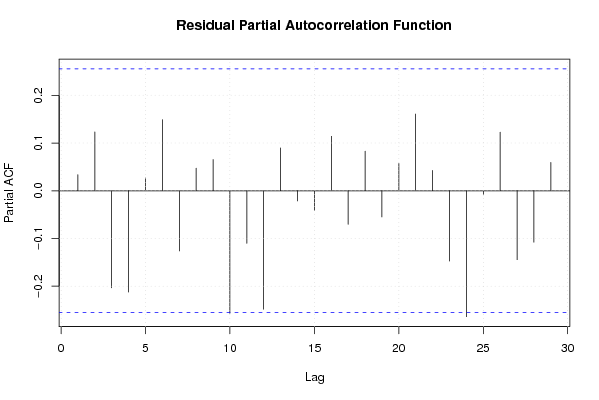
pacf(mysum$resid, lag.max=length(mysum$resid)/2, main='Residual Partial Autocorrelation Function')
grid()
dev.off()
bitmap(file='test8.png')
opar <- par(mfrow = c(2,2), oma = c(0, 0, 1.1, 0))
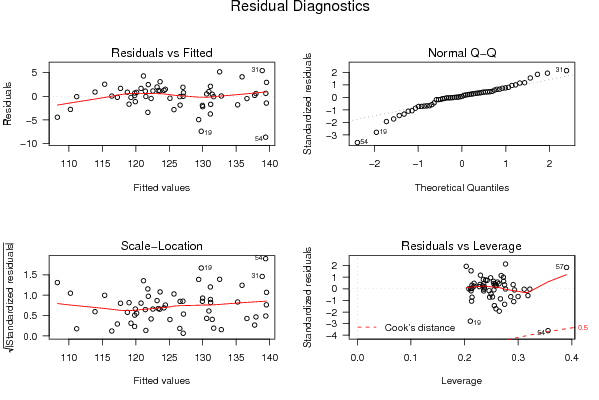
plot(mylm, las = 1, sub='Residual Diagnostics')
par(opar)
dev.off()
if (n > n25) {
bitmap(file='test9.png')
plot(kp3:nmkm3,gqarr[,2], main='Goldfeld-Quandt test',ylab='2-sided p-value',xlab='breakpoint')
grid()
dev.off()
}
load(file='createtable')
a<-table.start()
a<-table.row.start(a)
a<-table.element(a, 'Multiple Linear Regression - Estimated Regression Equation', 1, TRUE)
a<-table.row.end(a)
myeq <- colnames(x)[1]
myeq <- paste(myeq, '[t] = ', sep='')
for (i in 1:k){
if (mysum$coefficients[i,1] > 0) myeq <- paste(myeq, '+', '')
myeq <- paste(myeq, mysum$coefficients[i,1], sep=' ')
if (rownames(mysum$coefficients)[i] != '(Intercept)') {
myeq <- paste(myeq, rownames(mysum$coefficients)[i], sep='')
if (rownames(mysum$coefficients)[i] != 't') myeq <- paste(myeq, '[t]', sep='')
}
}
myeq <- paste(myeq, ' + e[t]')
a<-table.row.start(a)
a<-table.element(a, myeq)
a<-table.row.end(a)
a<-table.end(a)
table.save(a,file='mytable1.tab')
a<-table.start()
a<-table.row.start(a)
a<-table.element(a,hyperlink('ols1.htm','Multiple Linear Regression - Ordinary Least Squares',''), 6, TRUE)
a<-table.row.end(a)
a<-table.row.start(a)
a<-table.element(a,'Variable',header=TRUE)
a<-table.element(a,'Parameter',header=TRUE)
a<-table.element(a,'S.D.',header=TRUE)
a<-table.element(a,'T-STAT
H0: parameter = 0',header=TRUE)
a<-table.element(a,'2-tail p-value',header=TRUE)
a<-table.element(a,'1-tail p-value',header=TRUE)
a<-table.row.end(a)
for (i in 1:k){
a<-table.row.start(a)
a<-table.element(a,rownames(mysum$coefficients)[i],header=TRUE)
a<-table.element(a,mysum$coefficients[i,1])
a<-table.element(a, round(mysum$coefficients[i,2],6))
a<-table.element(a, round(mysum$coefficients[i,3],4))
a<-table.element(a, round(mysum$coefficients[i,4],6))
a<-table.element(a, round(mysum$coefficients[i,4]/2,6))
a<-table.row.end(a)
}
a<-table.end(a)
table.save(a,file='mytable2.tab')
a<-table.start()
a<-table.row.start(a)
a<-table.element(a, 'Multiple Linear Regression - Regression Statistics', 2, TRUE)
a<-table.row.end(a)
a<-table.row.start(a)
a<-table.element(a, 'Multiple R',1,TRUE)
a<-table.element(a, sqrt(mysum$r.squared))
a<-table.row.end(a)
a<-table.row.start(a)
a<-table.element(a, 'R-squared',1,TRUE)
a<-table.element(a, mysum$r.squared)
a<-table.row.end(a)
a<-table.row.start(a)
a<-table.element(a, 'Adjusted R-squared',1,TRUE)
a<-table.element(a, mysum$adj.r.squared)
a<-table.row.end(a)
a<-table.row.start(a)
a<-table.element(a, 'F-TEST (value)',1,TRUE)
a<-table.element(a, mysum$fstatistic[1])
a<-table.row.end(a)
a<-table.row.start(a)
a<-table.element(a, 'F-TEST (DF numerator)',1,TRUE)
a<-table.element(a, mysum$fstatistic[2])
a<-table.row.end(a)
a<-table.row.start(a)
a<-table.element(a, 'F-TEST (DF denominator)',1,TRUE)
a<-table.element(a, mysum$fstatistic[3])
a<-table.row.end(a)
a<-table.row.start(a)
a<-table.element(a, 'p-value',1,TRUE)
a<-table.element(a, 1-pf(mysum$fstatistic[1],mysum$fstatistic[2],mysum$fstatistic[3]))
a<-table.row.end(a)
a<-table.row.start(a)
a<-table.element(a, 'Multiple Linear Regression - Residual Statistics', 2, TRUE)
a<-table.row.end(a)
a<-table.row.start(a)
a<-table.element(a, 'Residual Standard Deviation',1,TRUE)
a<-table.element(a, mysum$sigma)
a<-table.row.end(a)
a<-table.row.start(a)
a<-table.element(a, 'Sum Squared Residuals',1,TRUE)
a<-table.element(a, sum(myerror*myerror))
a<-table.row.end(a)
a<-table.end(a)
table.save(a,file='mytable3.tab')
a<-table.start()
a<-table.row.start(a)
a<-table.element(a, 'Multiple Linear Regression - Actuals, Interpolation, and Residuals', 4, TRUE)
a<-table.row.end(a)
a<-table.row.start(a)
a<-table.element(a, 'Time or Index', 1, TRUE)
a<-table.element(a, 'Actuals', 1, TRUE)
a<-table.element(a, 'Interpolation
Forecast', 1, TRUE)
a<-table.element(a, 'Residuals
Prediction Error', 1, TRUE)
a<-table.row.end(a)
for (i in 1:n) {
a<-table.row.start(a)
a<-table.element(a,i, 1, TRUE)
a<-table.element(a,x[i])
a<-table.element(a,x[i]-mysum$resid[i])
a<-table.element(a,mysum$resid[i])
a<-table.row.end(a)
}
a<-table.end(a)
table.save(a,file='mytable4.tab')
if (n > n25) {
a<-table.start()
a<-table.row.start(a)
a<-table.element(a,'Goldfeld-Quandt test for Heteroskedasticity',4,TRUE)
a<-table.row.end(a)
a<-table.row.start(a)
a<-table.element(a,'p-values',header=TRUE)
a<-table.element(a,'Alternative Hypothesis',3,header=TRUE)
a<-table.row.end(a)
a<-table.row.start(a)
a<-table.element(a,'breakpoint index',header=TRUE)
a<-table.element(a,'greater',header=TRUE)
a<-table.element(a,'2-sided',header=TRUE)
a<-table.element(a,'less',header=TRUE)
a<-table.row.end(a)
for (mypoint in kp3:nmkm3) {
a<-table.row.start(a)
a<-table.element(a,mypoint,header=TRUE)
a<-table.element(a,gqarr[mypoint-kp3+1,1])
a<-table.element(a,gqarr[mypoint-kp3+1,2])
a<-table.element(a,gqarr[mypoint-kp3+1,3])
a<-table.row.end(a)
}
a<-table.end(a)
table.save(a,file='mytable5.tab')
a<-table.start()
a<-table.row.start(a)
a<-table.element(a,'Meta Analysis of Goldfeld-Quandt test for Heteroskedasticity',4,TRUE)
a<-table.row.end(a)
a<-table.row.start(a)
a<-table.element(a,'Description',header=TRUE)
a<-table.element(a,'# significant tests',header=TRUE)
a<-table.element(a,'% significant tests',header=TRUE)
a<-table.element(a,'OK/NOK',header=TRUE)
a<-table.row.end(a)
a<-table.row.start(a)
a<-table.element(a,'1% type I error level',header=TRUE)
a<-table.element(a,numsignificant1)
a<-table.element(a,numsignificant1/numgqtests)
if (numsignificant1/numgqtests < 0.01) dum <- 'OK' else dum <- 'NOK'
a<-table.element(a,dum)
a<-table.row.end(a)
a<-table.row.start(a)
a<-table.element(a,'5% type I error level',header=TRUE)
a<-table.element(a,numsignificant5)
a<-table.element(a,numsignificant5/numgqtests)
if (numsignificant5/numgqtests < 0.05) dum <- 'OK' else dum <- 'NOK'
a<-table.element(a,dum)
a<-table.row.end(a)
a<-table.row.start(a)
a<-table.element(a,'10% type I error level',header=TRUE)
a<-table.element(a,numsignificant10)
a<-table.element(a,numsignificant10/numgqtests)
if (numsignificant10/numgqtests < 0.1) dum <- 'OK' else dum <- 'NOK'
a<-table.element(a,dum)
a<-table.row.end(a)
a<-table.end(a)
table.save(a,file='mytable6.tab')
}