Free Statistics

of Irreproducible Research!

Author's title

Author*The author of this computation has been verified*
R Software Modulerwasp_multipleregression.wasp
Title produced by softwareMultiple Regression
Date of computationFri, 20 Nov 2009 17:23:22 -0700
Cite this page as followsStatistical Computations at FreeStatistics.org, Office for Research Development and Education, URL https://freestatistics.org/blog/index.php?v=date/2009/Nov/21/t1258763099hplu71jfq96ug8u.htm/, Retrieved Sun, 28 Apr 2024 05:04:37 +0000
Statistical Computations at FreeStatistics.org, Office for Research Development and Education, URL https://freestatistics.org/blog/index.php?pk=58502, Retrieved Sun, 28 Apr 2024 05:04:37 +0000
QR Codes:

Original text written by user:
IsPrivate?No (this computation is public)
User-defined keywords
Estimated Impact201
Family? (F = Feedback message, R = changed R code, M = changed R Module, P = changed Parameters, D = changed Data)
-       [Multiple Regression] [Shwws7_v1] [2009-11-21 00:23:22] [93b66894f6318f3da4fcda772f2ffa6f] [Current]
Feedback Forum

Post a new message
Dataseries X:
105.02	100.34	103.73	102.99	102.86	102.1
104.43	100.34	105.02	103.73	102.99	102.86
104.63	100.35	104.43	105.02	103.73	102.99
104.93	100.43	104.63	104.43	105.02	103.73
105.87	100.47	104.93	104.63	104.43	105.02
105.66	100.67	105.87	104.93	104.63	104.43
106.76	100.75	105.66	105.87	104.93	104.63
106	100.78	106.76	105.66	105.87	104.93
107.22	100.79	106	106.76	105.66	105.87
107.33	100.67	107.22	106	106.76	105.66
107.11	100.64	107.33	107.22	106	106.76
108.86	100.64	107.11	107.33	107.22	106
107.72	100.76	108.86	107.11	107.33	107.22
107.88	100.79	107.72	108.86	107.11	107.33
108.38	100.79	107.88	107.72	108.86	107.11
107.72	100.9	108.38	107.88	107.72	108.86
108.41	100.98	107.72	108.38	107.88	107.72
109.9	101.11	108.41	107.72	108.38	107.88
111.45	101.18	109.9	108.41	107.72	108.38
112.18	101.22	111.45	109.9	108.41	107.72
113.34	101.23	112.18	111.45	109.9	108.41
113.46	101.09	113.34	112.18	111.45	109.9
114.06	101.26	113.46	113.34	112.18	111.45
115.54	101.28	114.06	113.46	113.34	112.18
116.39	101.43	115.54	114.06	113.46	113.34
115.94	101.53	116.39	115.54	114.06	113.46
116.97	101.54	115.94	116.39	115.54	114.06
115.94	101.54	116.97	115.94	116.39	115.54
115.91	101.79	115.94	116.97	115.94	116.39
116.43	102.18	115.91	115.94	116.97	115.94
116.26	102.37	116.43	115.91	115.94	116.97
116.35	102.46	116.26	116.43	115.91	115.94
117.9	102.46	116.35	116.26	116.43	115.91
117.7	102.03	117.9	116.35	116.26	116.43
117.53	102.26	117.7	117.9	116.35	116.26
117.86	102.33	117.53	117.7	117.9	116.35
117.65	102.44	117.86	117.53	117.7	117.9
116.51	102.5	117.65	117.86	117.53	117.7
115.93	102.52	116.51	117.65	117.86	117.53
115.31	102.66	115.93	116.51	117.65	117.86
115	102.72	115.31	115.93	116.51	117.65


Summary of computational transaction
Raw Inputview raw input (R code)
Raw Outputview raw output of R engine
Computing time3 seconds
R Server'Gwilym Jenkins' @ 72.249.127.135

\begin{tabular}{lllllllll}
\hline
Summary of computational transaction \tabularnewline
Raw Input & view raw input (R code)  \tabularnewline
Raw Output & view raw output of R engine  \tabularnewline
Computing time & 3 seconds \tabularnewline
R Server & 'Gwilym Jenkins' @ 72.249.127.135 \tabularnewline
\hline
\end{tabular}
%Source: https://freestatistics.org/blog/index.php?pk=58502&T=0

[TABLE]
[ROW][C]Summary of computational transaction[/C][/ROW]
[ROW][C]Raw Input[/C][C]view raw input (R code) [/C][/ROW]
[ROW][C]Raw Output[/C][C]view raw output of R engine [/C][/ROW]
[ROW][C]Computing time[/C][C]3 seconds[/C][/ROW]
[ROW][C]R Server[/C][C]'Gwilym Jenkins' @ 72.249.127.135[/C][/ROW]
[/TABLE]
Source: https://freestatistics.org/blog/index.php?pk=58502&T=0

Globally Unique Identifier (entire table): ba.freestatistics.org/blog/index.php?pk=58502&T=0

As an alternative you can also use a QR Code:  

The GUIDs for individual cells are displayed in the table below:

Summary of computational transaction
Raw Inputview raw input (R code)
Raw Outputview raw output of R engine
Computing time3 seconds
R Server'Gwilym Jenkins' @ 72.249.127.135


Multiple Linear Regression - Estimated Regression Equation
y(t)[t] = -36.5108269184238 + 0.472806269550534`x(t)`[t] + 0.878494577498195`y(t-1)`[t] + 0.267957282415803`y(t-2)`[t] + 0.164874664652139`y(t-3)`[t] -0.413165669629023`y(t-4)`[t] + e[t]

\begin{tabular}{lllllllll}
\hline
Multiple Linear Regression - Estimated Regression Equation \tabularnewline
y(t)[t] =  -36.5108269184238 +  0.472806269550534`x(t)`[t] +  0.878494577498195`y(t-1)`[t] +  0.267957282415803`y(t-2)`[t] +  0.164874664652139`y(t-3)`[t] -0.413165669629023`y(t-4)`[t]  + e[t] \tabularnewline
\hline
\end{tabular}
%Source: https://freestatistics.org/blog/index.php?pk=58502&T=1

[TABLE]
[ROW][C]Multiple Linear Regression - Estimated Regression Equation[/C][/ROW]
[ROW][C]y(t)[t] =  -36.5108269184238 +  0.472806269550534`x(t)`[t] +  0.878494577498195`y(t-1)`[t] +  0.267957282415803`y(t-2)`[t] +  0.164874664652139`y(t-3)`[t] -0.413165669629023`y(t-4)`[t]  + e[t][/C][/ROW]
[/TABLE]
Source: https://freestatistics.org/blog/index.php?pk=58502&T=1

Globally Unique Identifier (entire table): ba.freestatistics.org/blog/index.php?pk=58502&T=1

As an alternative you can also use a QR Code:  

The GUIDs for individual cells are displayed in the table below:

Multiple Linear Regression - Estimated Regression Equation
y(t)[t] = -36.5108269184238 + 0.472806269550534`x(t)`[t] + 0.878494577498195`y(t-1)`[t] + 0.267957282415803`y(t-2)`[t] + 0.164874664652139`y(t-3)`[t] -0.413165669629023`y(t-4)`[t] + e[t]


Multiple Linear Regression - Ordinary Least Squares
VariableParameterS.D.T-STATH0: parameter = 02-tail p-value1-tail p-value
(Intercept)-36.510826918423851.098031-0.71450.4796410.239821
`x(t)`0.4728062695505340.5899680.80140.4283020.214151
`y(t-1)`0.8784945774981950.1613265.44554e-062e-06
`y(t-2)`0.2679572824158030.2115021.26690.2135470.106773
`y(t-3)`0.1648746646521390.210220.78430.4381430.219072
`y(t-4)`-0.4131656696290230.188817-2.18820.0354210.017711

\begin{tabular}{lllllllll}
\hline
Multiple Linear Regression - Ordinary Least Squares \tabularnewline
Variable & Parameter & S.D. & T-STATH0: parameter = 0 & 2-tail p-value & 1-tail p-value \tabularnewline
(Intercept) & -36.5108269184238 & 51.098031 & -0.7145 & 0.479641 & 0.239821 \tabularnewline
`x(t)` & 0.472806269550534 & 0.589968 & 0.8014 & 0.428302 & 0.214151 \tabularnewline
`y(t-1)` & 0.878494577498195 & 0.161326 & 5.4455 & 4e-06 & 2e-06 \tabularnewline
`y(t-2)` & 0.267957282415803 & 0.211502 & 1.2669 & 0.213547 & 0.106773 \tabularnewline
`y(t-3)` & 0.164874664652139 & 0.21022 & 0.7843 & 0.438143 & 0.219072 \tabularnewline
`y(t-4)` & -0.413165669629023 & 0.188817 & -2.1882 & 0.035421 & 0.017711 \tabularnewline
\hline
\end{tabular}
%Source: https://freestatistics.org/blog/index.php?pk=58502&T=2

[TABLE]
[ROW][C]Multiple Linear Regression - Ordinary Least Squares[/C][/ROW]
[ROW][C]Variable[/C][C]Parameter[/C][C]S.D.[/C][C]T-STATH0: parameter = 0[/C][C]2-tail p-value[/C][C]1-tail p-value[/C][/ROW]
[ROW][C](Intercept)[/C][C]-36.5108269184238[/C][C]51.098031[/C][C]-0.7145[/C][C]0.479641[/C][C]0.239821[/C][/ROW]
[ROW][C]`x(t)`[/C][C]0.472806269550534[/C][C]0.589968[/C][C]0.8014[/C][C]0.428302[/C][C]0.214151[/C][/ROW]
[ROW][C]`y(t-1)`[/C][C]0.878494577498195[/C][C]0.161326[/C][C]5.4455[/C][C]4e-06[/C][C]2e-06[/C][/ROW]
[ROW][C]`y(t-2)`[/C][C]0.267957282415803[/C][C]0.211502[/C][C]1.2669[/C][C]0.213547[/C][C]0.106773[/C][/ROW]
[ROW][C]`y(t-3)`[/C][C]0.164874664652139[/C][C]0.21022[/C][C]0.7843[/C][C]0.438143[/C][C]0.219072[/C][/ROW]
[ROW][C]`y(t-4)`[/C][C]-0.413165669629023[/C][C]0.188817[/C][C]-2.1882[/C][C]0.035421[/C][C]0.017711[/C][/ROW]
[/TABLE]
Source: https://freestatistics.org/blog/index.php?pk=58502&T=2

Globally Unique Identifier (entire table): ba.freestatistics.org/blog/index.php?pk=58502&T=2

As an alternative you can also use a QR Code:  

The GUIDs for individual cells are displayed in the table below:

Multiple Linear Regression - Ordinary Least Squares
VariableParameterS.D.T-STATH0: parameter = 02-tail p-value1-tail p-value
(Intercept)-36.510826918423851.098031-0.71450.4796410.239821
`x(t)`0.4728062695505340.5899680.80140.4283020.214151
`y(t-1)`0.8784945774981950.1613265.44554e-062e-06
`y(t-2)`0.2679572824158030.2115021.26690.2135470.106773
`y(t-3)`0.1648746646521390.210220.78430.4381430.219072
`y(t-4)`-0.4131656696290230.188817-2.18820.0354210.017711


Multiple Linear Regression - Regression Statistics
Multiple R0.988327860167978
R-squared0.976791959184214
Adjusted R-squared0.97347652478196
F-TEST (value)294.619600532529
F-TEST (DF numerator)5
F-TEST (DF denominator)35
p-value0
Multiple Linear Regression - Residual Statistics
Residual Standard Deviation0.772889638581292
Sum Squared Residuals20.9075437699212

\begin{tabular}{lllllllll}
\hline
Multiple Linear Regression - Regression Statistics \tabularnewline
Multiple R & 0.988327860167978 \tabularnewline
R-squared & 0.976791959184214 \tabularnewline
Adjusted R-squared & 0.97347652478196 \tabularnewline
F-TEST (value) & 294.619600532529 \tabularnewline
F-TEST (DF numerator) & 5 \tabularnewline
F-TEST (DF denominator) & 35 \tabularnewline
p-value & 0 \tabularnewline
Multiple Linear Regression - Residual Statistics \tabularnewline
Residual Standard Deviation & 0.772889638581292 \tabularnewline
Sum Squared Residuals & 20.9075437699212 \tabularnewline
\hline
\end{tabular}
%Source: https://freestatistics.org/blog/index.php?pk=58502&T=3

[TABLE]
[ROW][C]Multiple Linear Regression - Regression Statistics[/C][/ROW]
[ROW][C]Multiple R[/C][C]0.988327860167978[/C][/ROW]
[ROW][C]R-squared[/C][C]0.976791959184214[/C][/ROW]
[ROW][C]Adjusted R-squared[/C][C]0.97347652478196[/C][/ROW]
[ROW][C]F-TEST (value)[/C][C]294.619600532529[/C][/ROW]
[ROW][C]F-TEST (DF numerator)[/C][C]5[/C][/ROW]
[ROW][C]F-TEST (DF denominator)[/C][C]35[/C][/ROW]
[ROW][C]p-value[/C][C]0[/C][/ROW]
[ROW][C]Multiple Linear Regression - Residual Statistics[/C][/ROW]
[ROW][C]Residual Standard Deviation[/C][C]0.772889638581292[/C][/ROW]
[ROW][C]Sum Squared Residuals[/C][C]20.9075437699212[/C][/ROW]
[/TABLE]
Source: https://freestatistics.org/blog/index.php?pk=58502&T=3

Globally Unique Identifier (entire table): ba.freestatistics.org/blog/index.php?pk=58502&T=3

As an alternative you can also use a QR Code:  

The GUIDs for individual cells are displayed in the table below:

Multiple Linear Regression - Regression Statistics
Multiple R0.988327860167978
R-squared0.976791959184214
Adjusted R-squared0.97347652478196
F-TEST (value)294.619600532529
F-TEST (DF numerator)5
F-TEST (DF denominator)35
p-value0
Multiple Linear Regression - Residual Statistics
Residual Standard Deviation0.772889638581292
Sum Squared Residuals20.9075437699212


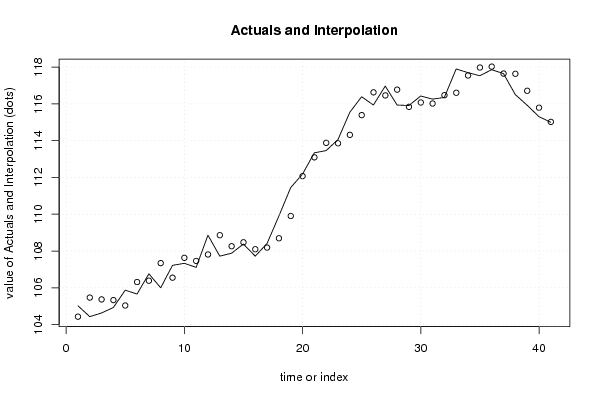
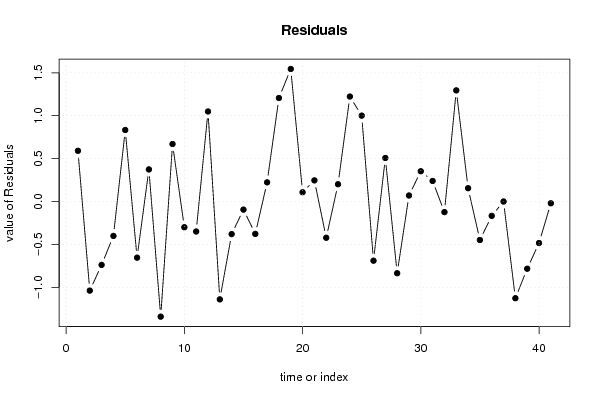
Multiple Linear Regression - Actuals, Interpolation, and Residuals
Time or IndexActualsInterpolationForecastResidualsPrediction Error
1105.02104.4285103451640.591489654835985
2104.43105.467484536611-1.03748453661099
3104.63105.367861407690-0.737861407689779
4104.93105.330235750004-0.400235750003897
5105.87105.0360280645520.833971935447653
6105.66106.313504084047-0.653504084047054
7106.76106.3855538352770.374446164722843
8106107.340843513189-1.34084351318868
9107.22106.5496692986150.67033070138529
10107.33107.629175317920-0.299175317919881
11107.11107.458746436178-0.348746436177889
12108.86107.8101059299881.04989407001231
13107.72108.859331686988-1.13933168698845
14107.88108.259236651072-0.379236651072023
15108.38108.473751591977-0.0937515919773426
16107.72108.096883696009-0.376883696009296
17108.41108.1862692273540.223730772646137
18109.9108.6933743196601.20662568033983
19111.45109.9049180903831.54508190961698
20112.18112.0712061476520.108793852348092
21113.34113.0931479779530.246852022046739
22113.46113.881556508741-0.421556508741203
23114.06113.8581350887380.201864911262031
24115.54114.3164865066851.22351349331492
25116.39115.3888665742531.00113342574692
26115.94116.628789288493-0.68878928849279
27116.97116.4620735832750.507926416724715
28115.94116.775000494915-0.835000494914678
29115.91115.8389642300890.0710357699106803
30116.43116.0767532929260.35324670707444
31116.26116.0199834016570.240016598342837
32116.35116.473144074377-0.123144074376571
33117.9116.6047856440491.29521435595131
34117.7117.5443868574840.155613142516366
35117.53117.977844055381-0.447844055380741
36117.86118.026375779536-0.166375779535631
37117.65117.6493532208940.000646779105519066
38116.51117.636268079925-1.12626807992506
39115.93116.712616160833-0.782616160832944
40115.31115.792842531113-0.482842531112532
41115115.019936718354-0.0199367183541721

\begin{tabular}{lllllllll}
\hline
Multiple Linear Regression - Actuals, Interpolation, and Residuals \tabularnewline
Time or Index & Actuals & InterpolationForecast & ResidualsPrediction Error \tabularnewline
1 & 105.02 & 104.428510345164 & 0.591489654835985 \tabularnewline
2 & 104.43 & 105.467484536611 & -1.03748453661099 \tabularnewline
3 & 104.63 & 105.367861407690 & -0.737861407689779 \tabularnewline
4 & 104.93 & 105.330235750004 & -0.400235750003897 \tabularnewline
5 & 105.87 & 105.036028064552 & 0.833971935447653 \tabularnewline
6 & 105.66 & 106.313504084047 & -0.653504084047054 \tabularnewline
7 & 106.76 & 106.385553835277 & 0.374446164722843 \tabularnewline
8 & 106 & 107.340843513189 & -1.34084351318868 \tabularnewline
9 & 107.22 & 106.549669298615 & 0.67033070138529 \tabularnewline
10 & 107.33 & 107.629175317920 & -0.299175317919881 \tabularnewline
11 & 107.11 & 107.458746436178 & -0.348746436177889 \tabularnewline
12 & 108.86 & 107.810105929988 & 1.04989407001231 \tabularnewline
13 & 107.72 & 108.859331686988 & -1.13933168698845 \tabularnewline
14 & 107.88 & 108.259236651072 & -0.379236651072023 \tabularnewline
15 & 108.38 & 108.473751591977 & -0.0937515919773426 \tabularnewline
16 & 107.72 & 108.096883696009 & -0.376883696009296 \tabularnewline
17 & 108.41 & 108.186269227354 & 0.223730772646137 \tabularnewline
18 & 109.9 & 108.693374319660 & 1.20662568033983 \tabularnewline
19 & 111.45 & 109.904918090383 & 1.54508190961698 \tabularnewline
20 & 112.18 & 112.071206147652 & 0.108793852348092 \tabularnewline
21 & 113.34 & 113.093147977953 & 0.246852022046739 \tabularnewline
22 & 113.46 & 113.881556508741 & -0.421556508741203 \tabularnewline
23 & 114.06 & 113.858135088738 & 0.201864911262031 \tabularnewline
24 & 115.54 & 114.316486506685 & 1.22351349331492 \tabularnewline
25 & 116.39 & 115.388866574253 & 1.00113342574692 \tabularnewline
26 & 115.94 & 116.628789288493 & -0.68878928849279 \tabularnewline
27 & 116.97 & 116.462073583275 & 0.507926416724715 \tabularnewline
28 & 115.94 & 116.775000494915 & -0.835000494914678 \tabularnewline
29 & 115.91 & 115.838964230089 & 0.0710357699106803 \tabularnewline
30 & 116.43 & 116.076753292926 & 0.35324670707444 \tabularnewline
31 & 116.26 & 116.019983401657 & 0.240016598342837 \tabularnewline
32 & 116.35 & 116.473144074377 & -0.123144074376571 \tabularnewline
33 & 117.9 & 116.604785644049 & 1.29521435595131 \tabularnewline
34 & 117.7 & 117.544386857484 & 0.155613142516366 \tabularnewline
35 & 117.53 & 117.977844055381 & -0.447844055380741 \tabularnewline
36 & 117.86 & 118.026375779536 & -0.166375779535631 \tabularnewline
37 & 117.65 & 117.649353220894 & 0.000646779105519066 \tabularnewline
38 & 116.51 & 117.636268079925 & -1.12626807992506 \tabularnewline
39 & 115.93 & 116.712616160833 & -0.782616160832944 \tabularnewline
40 & 115.31 & 115.792842531113 & -0.482842531112532 \tabularnewline
41 & 115 & 115.019936718354 & -0.0199367183541721 \tabularnewline
\hline
\end{tabular}
%Source: https://freestatistics.org/blog/index.php?pk=58502&T=4

[TABLE]
[ROW][C]Multiple Linear Regression - Actuals, Interpolation, and Residuals[/C][/ROW]
[ROW][C]Time or Index[/C][C]Actuals[/C][C]InterpolationForecast[/C][C]ResidualsPrediction Error[/C][/ROW]
[ROW][C]1[/C][C]105.02[/C][C]104.428510345164[/C][C]0.591489654835985[/C][/ROW]
[ROW][C]2[/C][C]104.43[/C][C]105.467484536611[/C][C]-1.03748453661099[/C][/ROW]
[ROW][C]3[/C][C]104.63[/C][C]105.367861407690[/C][C]-0.737861407689779[/C][/ROW]
[ROW][C]4[/C][C]104.93[/C][C]105.330235750004[/C][C]-0.400235750003897[/C][/ROW]
[ROW][C]5[/C][C]105.87[/C][C]105.036028064552[/C][C]0.833971935447653[/C][/ROW]
[ROW][C]6[/C][C]105.66[/C][C]106.313504084047[/C][C]-0.653504084047054[/C][/ROW]
[ROW][C]7[/C][C]106.76[/C][C]106.385553835277[/C][C]0.374446164722843[/C][/ROW]
[ROW][C]8[/C][C]106[/C][C]107.340843513189[/C][C]-1.34084351318868[/C][/ROW]
[ROW][C]9[/C][C]107.22[/C][C]106.549669298615[/C][C]0.67033070138529[/C][/ROW]
[ROW][C]10[/C][C]107.33[/C][C]107.629175317920[/C][C]-0.299175317919881[/C][/ROW]
[ROW][C]11[/C][C]107.11[/C][C]107.458746436178[/C][C]-0.348746436177889[/C][/ROW]
[ROW][C]12[/C][C]108.86[/C][C]107.810105929988[/C][C]1.04989407001231[/C][/ROW]
[ROW][C]13[/C][C]107.72[/C][C]108.859331686988[/C][C]-1.13933168698845[/C][/ROW]
[ROW][C]14[/C][C]107.88[/C][C]108.259236651072[/C][C]-0.379236651072023[/C][/ROW]
[ROW][C]15[/C][C]108.38[/C][C]108.473751591977[/C][C]-0.0937515919773426[/C][/ROW]
[ROW][C]16[/C][C]107.72[/C][C]108.096883696009[/C][C]-0.376883696009296[/C][/ROW]
[ROW][C]17[/C][C]108.41[/C][C]108.186269227354[/C][C]0.223730772646137[/C][/ROW]
[ROW][C]18[/C][C]109.9[/C][C]108.693374319660[/C][C]1.20662568033983[/C][/ROW]
[ROW][C]19[/C][C]111.45[/C][C]109.904918090383[/C][C]1.54508190961698[/C][/ROW]
[ROW][C]20[/C][C]112.18[/C][C]112.071206147652[/C][C]0.108793852348092[/C][/ROW]
[ROW][C]21[/C][C]113.34[/C][C]113.093147977953[/C][C]0.246852022046739[/C][/ROW]
[ROW][C]22[/C][C]113.46[/C][C]113.881556508741[/C][C]-0.421556508741203[/C][/ROW]
[ROW][C]23[/C][C]114.06[/C][C]113.858135088738[/C][C]0.201864911262031[/C][/ROW]
[ROW][C]24[/C][C]115.54[/C][C]114.316486506685[/C][C]1.22351349331492[/C][/ROW]
[ROW][C]25[/C][C]116.39[/C][C]115.388866574253[/C][C]1.00113342574692[/C][/ROW]
[ROW][C]26[/C][C]115.94[/C][C]116.628789288493[/C][C]-0.68878928849279[/C][/ROW]
[ROW][C]27[/C][C]116.97[/C][C]116.462073583275[/C][C]0.507926416724715[/C][/ROW]
[ROW][C]28[/C][C]115.94[/C][C]116.775000494915[/C][C]-0.835000494914678[/C][/ROW]
[ROW][C]29[/C][C]115.91[/C][C]115.838964230089[/C][C]0.0710357699106803[/C][/ROW]
[ROW][C]30[/C][C]116.43[/C][C]116.076753292926[/C][C]0.35324670707444[/C][/ROW]
[ROW][C]31[/C][C]116.26[/C][C]116.019983401657[/C][C]0.240016598342837[/C][/ROW]
[ROW][C]32[/C][C]116.35[/C][C]116.473144074377[/C][C]-0.123144074376571[/C][/ROW]
[ROW][C]33[/C][C]117.9[/C][C]116.604785644049[/C][C]1.29521435595131[/C][/ROW]
[ROW][C]34[/C][C]117.7[/C][C]117.544386857484[/C][C]0.155613142516366[/C][/ROW]
[ROW][C]35[/C][C]117.53[/C][C]117.977844055381[/C][C]-0.447844055380741[/C][/ROW]
[ROW][C]36[/C][C]117.86[/C][C]118.026375779536[/C][C]-0.166375779535631[/C][/ROW]
[ROW][C]37[/C][C]117.65[/C][C]117.649353220894[/C][C]0.000646779105519066[/C][/ROW]
[ROW][C]38[/C][C]116.51[/C][C]117.636268079925[/C][C]-1.12626807992506[/C][/ROW]
[ROW][C]39[/C][C]115.93[/C][C]116.712616160833[/C][C]-0.782616160832944[/C][/ROW]
[ROW][C]40[/C][C]115.31[/C][C]115.792842531113[/C][C]-0.482842531112532[/C][/ROW]
[ROW][C]41[/C][C]115[/C][C]115.019936718354[/C][C]-0.0199367183541721[/C][/ROW]
[/TABLE]
Source: https://freestatistics.org/blog/index.php?pk=58502&T=4

Globally Unique Identifier (entire table): ba.freestatistics.org/blog/index.php?pk=58502&T=4

As an alternative you can also use a QR Code:  

The GUIDs for individual cells are displayed in the table below:

Multiple Linear Regression - Actuals, Interpolation, and Residuals
Time or IndexActualsInterpolationForecastResidualsPrediction Error
1105.02104.4285103451640.591489654835985
2104.43105.467484536611-1.03748453661099
3104.63105.367861407690-0.737861407689779
4104.93105.330235750004-0.400235750003897
5105.87105.0360280645520.833971935447653
6105.66106.313504084047-0.653504084047054
7106.76106.3855538352770.374446164722843
8106107.340843513189-1.34084351318868
9107.22106.5496692986150.67033070138529
10107.33107.629175317920-0.299175317919881
11107.11107.458746436178-0.348746436177889
12108.86107.8101059299881.04989407001231
13107.72108.859331686988-1.13933168698845
14107.88108.259236651072-0.379236651072023
15108.38108.473751591977-0.0937515919773426
16107.72108.096883696009-0.376883696009296
17108.41108.1862692273540.223730772646137
18109.9108.6933743196601.20662568033983
19111.45109.9049180903831.54508190961698
20112.18112.0712061476520.108793852348092
21113.34113.0931479779530.246852022046739
22113.46113.881556508741-0.421556508741203
23114.06113.8581350887380.201864911262031
24115.54114.3164865066851.22351349331492
25116.39115.3888665742531.00113342574692
26115.94116.628789288493-0.68878928849279
27116.97116.4620735832750.507926416724715
28115.94116.775000494915-0.835000494914678
29115.91115.8389642300890.0710357699106803
30116.43116.0767532929260.35324670707444
31116.26116.0199834016570.240016598342837
32116.35116.473144074377-0.123144074376571
33117.9116.6047856440491.29521435595131
34117.7117.5443868574840.155613142516366
35117.53117.977844055381-0.447844055380741
36117.86118.026375779536-0.166375779535631
37117.65117.6493532208940.000646779105519066
38116.51117.636268079925-1.12626807992506
39115.93116.712616160833-0.782616160832944
40115.31115.792842531113-0.482842531112532
41115115.019936718354-0.0199367183541721


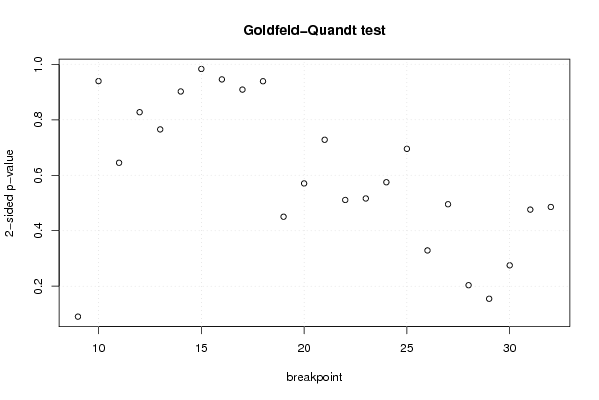
Goldfeld-Quandt test for Heteroskedasticity
p-valuesAlternative Hypothesis
breakpoint indexgreater2-sidedless
90.04513563856408130.09027127712816260.954864361435919
100.4696588005960470.9393176011920950.530341199403953
110.3224643646946230.6449287293892460.677535635305377
120.5863540813048610.8272918373902780.413645918695139
130.6173672534076760.7652654931846480.382632746592324
140.5490244185889710.9019511628220580.450975581411029
150.4915860150428080.9831720300856150.508413984957192
160.527269909143290.945460181713420.47273009085671
170.4543722534134060.9087445068268110.545627746586594
180.5305644606714350.938871078657130.469435539328565
190.7747693233781530.4504613532436940.225230676621847
200.7147515627522360.5704968744955290.285248437247764
210.6360526778013930.7278946443972140.363947322198607
220.7445643104493590.5108713791012830.255435689550641
230.7418568860824020.5162862278351960.258143113917598
240.7126308558836810.5747382882326380.287369144116319
250.6524471535983670.6951056928032660.347552846401633
260.8355292276571140.3289415446857730.164470772342886
270.7522595792207070.4954808415585850.247740420779293
280.8981934629866680.2036130740266640.101806537013332
290.922614734841010.1547705303179780.077385265158989
300.8623402620458680.2753194759082630.137659737954132
310.7619408997383160.4761182005233670.238059100261684
320.7572089819216630.4855820361566730.242791018078337

\begin{tabular}{lllllllll}
\hline
Goldfeld-Quandt test for Heteroskedasticity \tabularnewline
p-values & Alternative Hypothesis \tabularnewline
breakpoint index & greater & 2-sided & less \tabularnewline
9 & 0.0451356385640813 & 0.0902712771281626 & 0.954864361435919 \tabularnewline
10 & 0.469658800596047 & 0.939317601192095 & 0.530341199403953 \tabularnewline
11 & 0.322464364694623 & 0.644928729389246 & 0.677535635305377 \tabularnewline
12 & 0.586354081304861 & 0.827291837390278 & 0.413645918695139 \tabularnewline
13 & 0.617367253407676 & 0.765265493184648 & 0.382632746592324 \tabularnewline
14 & 0.549024418588971 & 0.901951162822058 & 0.450975581411029 \tabularnewline
15 & 0.491586015042808 & 0.983172030085615 & 0.508413984957192 \tabularnewline
16 & 0.52726990914329 & 0.94546018171342 & 0.47273009085671 \tabularnewline
17 & 0.454372253413406 & 0.908744506826811 & 0.545627746586594 \tabularnewline
18 & 0.530564460671435 & 0.93887107865713 & 0.469435539328565 \tabularnewline
19 & 0.774769323378153 & 0.450461353243694 & 0.225230676621847 \tabularnewline
20 & 0.714751562752236 & 0.570496874495529 & 0.285248437247764 \tabularnewline
21 & 0.636052677801393 & 0.727894644397214 & 0.363947322198607 \tabularnewline
22 & 0.744564310449359 & 0.510871379101283 & 0.255435689550641 \tabularnewline
23 & 0.741856886082402 & 0.516286227835196 & 0.258143113917598 \tabularnewline
24 & 0.712630855883681 & 0.574738288232638 & 0.287369144116319 \tabularnewline
25 & 0.652447153598367 & 0.695105692803266 & 0.347552846401633 \tabularnewline
26 & 0.835529227657114 & 0.328941544685773 & 0.164470772342886 \tabularnewline
27 & 0.752259579220707 & 0.495480841558585 & 0.247740420779293 \tabularnewline
28 & 0.898193462986668 & 0.203613074026664 & 0.101806537013332 \tabularnewline
29 & 0.92261473484101 & 0.154770530317978 & 0.077385265158989 \tabularnewline
30 & 0.862340262045868 & 0.275319475908263 & 0.137659737954132 \tabularnewline
31 & 0.761940899738316 & 0.476118200523367 & 0.238059100261684 \tabularnewline
32 & 0.757208981921663 & 0.485582036156673 & 0.242791018078337 \tabularnewline
\hline
\end{tabular}
%Source: https://freestatistics.org/blog/index.php?pk=58502&T=5

[TABLE]
[ROW][C]Goldfeld-Quandt test for Heteroskedasticity[/C][/ROW]
[ROW][C]p-values[/C][C]Alternative Hypothesis[/C][/ROW]
[ROW][C]breakpoint index[/C][C]greater[/C][C]2-sided[/C][C]less[/C][/ROW]
[ROW][C]9[/C][C]0.0451356385640813[/C][C]0.0902712771281626[/C][C]0.954864361435919[/C][/ROW]
[ROW][C]10[/C][C]0.469658800596047[/C][C]0.939317601192095[/C][C]0.530341199403953[/C][/ROW]
[ROW][C]11[/C][C]0.322464364694623[/C][C]0.644928729389246[/C][C]0.677535635305377[/C][/ROW]
[ROW][C]12[/C][C]0.586354081304861[/C][C]0.827291837390278[/C][C]0.413645918695139[/C][/ROW]
[ROW][C]13[/C][C]0.617367253407676[/C][C]0.765265493184648[/C][C]0.382632746592324[/C][/ROW]
[ROW][C]14[/C][C]0.549024418588971[/C][C]0.901951162822058[/C][C]0.450975581411029[/C][/ROW]
[ROW][C]15[/C][C]0.491586015042808[/C][C]0.983172030085615[/C][C]0.508413984957192[/C][/ROW]
[ROW][C]16[/C][C]0.52726990914329[/C][C]0.94546018171342[/C][C]0.47273009085671[/C][/ROW]
[ROW][C]17[/C][C]0.454372253413406[/C][C]0.908744506826811[/C][C]0.545627746586594[/C][/ROW]
[ROW][C]18[/C][C]0.530564460671435[/C][C]0.93887107865713[/C][C]0.469435539328565[/C][/ROW]
[ROW][C]19[/C][C]0.774769323378153[/C][C]0.450461353243694[/C][C]0.225230676621847[/C][/ROW]
[ROW][C]20[/C][C]0.714751562752236[/C][C]0.570496874495529[/C][C]0.285248437247764[/C][/ROW]
[ROW][C]21[/C][C]0.636052677801393[/C][C]0.727894644397214[/C][C]0.363947322198607[/C][/ROW]
[ROW][C]22[/C][C]0.744564310449359[/C][C]0.510871379101283[/C][C]0.255435689550641[/C][/ROW]
[ROW][C]23[/C][C]0.741856886082402[/C][C]0.516286227835196[/C][C]0.258143113917598[/C][/ROW]
[ROW][C]24[/C][C]0.712630855883681[/C][C]0.574738288232638[/C][C]0.287369144116319[/C][/ROW]
[ROW][C]25[/C][C]0.652447153598367[/C][C]0.695105692803266[/C][C]0.347552846401633[/C][/ROW]
[ROW][C]26[/C][C]0.835529227657114[/C][C]0.328941544685773[/C][C]0.164470772342886[/C][/ROW]
[ROW][C]27[/C][C]0.752259579220707[/C][C]0.495480841558585[/C][C]0.247740420779293[/C][/ROW]
[ROW][C]28[/C][C]0.898193462986668[/C][C]0.203613074026664[/C][C]0.101806537013332[/C][/ROW]
[ROW][C]29[/C][C]0.92261473484101[/C][C]0.154770530317978[/C][C]0.077385265158989[/C][/ROW]
[ROW][C]30[/C][C]0.862340262045868[/C][C]0.275319475908263[/C][C]0.137659737954132[/C][/ROW]
[ROW][C]31[/C][C]0.761940899738316[/C][C]0.476118200523367[/C][C]0.238059100261684[/C][/ROW]
[ROW][C]32[/C][C]0.757208981921663[/C][C]0.485582036156673[/C][C]0.242791018078337[/C][/ROW]
[/TABLE]
Source: https://freestatistics.org/blog/index.php?pk=58502&T=5

Globally Unique Identifier (entire table): ba.freestatistics.org/blog/index.php?pk=58502&T=5

As an alternative you can also use a QR Code:  

The GUIDs for individual cells are displayed in the table below:

Goldfeld-Quandt test for Heteroskedasticity
p-valuesAlternative Hypothesis
breakpoint indexgreater2-sidedless
90.04513563856408130.09027127712816260.954864361435919
100.4696588005960470.9393176011920950.530341199403953
110.3224643646946230.6449287293892460.677535635305377
120.5863540813048610.8272918373902780.413645918695139
130.6173672534076760.7652654931846480.382632746592324
140.5490244185889710.9019511628220580.450975581411029
150.4915860150428080.9831720300856150.508413984957192
160.527269909143290.945460181713420.47273009085671
170.4543722534134060.9087445068268110.545627746586594
180.5305644606714350.938871078657130.469435539328565
190.7747693233781530.4504613532436940.225230676621847
200.7147515627522360.5704968744955290.285248437247764
210.6360526778013930.7278946443972140.363947322198607
220.7445643104493590.5108713791012830.255435689550641
230.7418568860824020.5162862278351960.258143113917598
240.7126308558836810.5747382882326380.287369144116319
250.6524471535983670.6951056928032660.347552846401633
260.8355292276571140.3289415446857730.164470772342886
270.7522595792207070.4954808415585850.247740420779293
280.8981934629866680.2036130740266640.101806537013332
290.922614734841010.1547705303179780.077385265158989
300.8623402620458680.2753194759082630.137659737954132
310.7619408997383160.4761182005233670.238059100261684
320.7572089819216630.4855820361566730.242791018078337


Meta Analysis of Goldfeld-Quandt test for Heteroskedasticity
Description# significant tests% significant testsOK/NOK
1% type I error level00OK
5% type I error level00OK
10% type I error level10.0416666666666667OK

\begin{tabular}{lllllllll}
\hline
Meta Analysis of Goldfeld-Quandt test for Heteroskedasticity \tabularnewline
Description & # significant tests & % significant tests & OK/NOK \tabularnewline
1% type I error level & 0 & 0 & OK \tabularnewline
5% type I error level & 0 & 0 & OK \tabularnewline
10% type I error level & 1 & 0.0416666666666667 & OK \tabularnewline
\hline
\end{tabular}
%Source: https://freestatistics.org/blog/index.php?pk=58502&T=6

[TABLE]
[ROW][C]Meta Analysis of Goldfeld-Quandt test for Heteroskedasticity[/C][/ROW]
[ROW][C]Description[/C][C]# significant tests[/C][C]% significant tests[/C][C]OK/NOK[/C][/ROW]
[ROW][C]1% type I error level[/C][C]0[/C][C]0[/C][C]OK[/C][/ROW]
[ROW][C]5% type I error level[/C][C]0[/C][C]0[/C][C]OK[/C][/ROW]
[ROW][C]10% type I error level[/C][C]1[/C][C]0.0416666666666667[/C][C]OK[/C][/ROW]
[/TABLE]
Source: https://freestatistics.org/blog/index.php?pk=58502&T=6

Globally Unique Identifier (entire table): ba.freestatistics.org/blog/index.php?pk=58502&T=6

As an alternative you can also use a QR Code:  

The GUIDs for individual cells are displayed in the table below:

Meta Analysis of Goldfeld-Quandt test for Heteroskedasticity
Description# significant tests% significant testsOK/NOK
1% type I error level00OK
5% type I error level00OK
10% type I error level10.0416666666666667OK


Parameters (Session):
par1 = 1 ; par2 = Do not include Seasonal Dummies ; par3 = No Linear Trend ;
Parameters (R input):
par1 = 1 ; par2 = Do not include Seasonal Dummies ; par3 = No Linear Trend ;
R code (references can be found in the software module):
library(lattice)
library(lmtest)
n25 <- 25 #minimum number of obs. for Goldfeld-Quandt test
par1 <- as.numeric(par1)
x <- t(y)
k <- length(x[1,])
n <- length(x[,1])
x1 <- cbind(x[,par1], x[,1:k!=par1])
mycolnames <- c(colnames(x)[par1], colnames(x)[1:k!=par1])
colnames(x1) <- mycolnames #colnames(x)[par1]
x <- x1
if (par3 == 'First Differences'){
x2 <- array(0, dim=c(n-1,k), dimnames=list(1:(n-1), paste('(1-B)',colnames(x),sep='')))
for (i in 1:n-1) {
for (j in 1:k) {
x2[i,j] <- x[i+1,j] - x[i,j]
}
}
x <- x2
}
if (par2 == 'Include Monthly Dummies'){
x2 <- array(0, dim=c(n,11), dimnames=list(1:n, paste('M', seq(1:11), sep ='')))
for (i in 1:11){
x2[seq(i,n,12),i] <- 1
}
x <- cbind(x, x2)
}
if (par2 == 'Include Quarterly Dummies'){
x2 <- array(0, dim=c(n,3), dimnames=list(1:n, paste('Q', seq(1:3), sep ='')))
for (i in 1:3){
x2[seq(i,n,4),i] <- 1
}
x <- cbind(x, x2)
}
k <- length(x[1,])
if (par3 == 'Linear Trend'){
x <- cbind(x, c(1:n))
colnames(x)[k+1] <- 't'
}
x
k <- length(x[1,])
df <- as.data.frame(x)
(mylm <- lm(df))
(mysum <- summary(mylm))
if (n > n25) {
kp3 <- k + 3
nmkm3 <- n - k - 3
gqarr <- array(NA, dim=c(nmkm3-kp3+1,3))
numgqtests <- 0
numsignificant1 <- 0
numsignificant5 <- 0
numsignificant10 <- 0
for (mypoint in kp3:nmkm3) {
j <- 0
numgqtests <- numgqtests + 1
for (myalt in c('greater', 'two.sided', 'less')) {
j <- j + 1
gqarr[mypoint-kp3+1,j] <- gqtest(mylm, point=mypoint, alternative=myalt)$p.value
}
if (gqarr[mypoint-kp3+1,2] < 0.01) numsignificant1 <- numsignificant1 + 1
if (gqarr[mypoint-kp3+1,2] < 0.05) numsignificant5 <- numsignificant5 + 1
if (gqarr[mypoint-kp3+1,2] < 0.10) numsignificant10 <- numsignificant10 + 1
}
gqarr
}
bitmap(file='test0.png')
plot(x[,1], type='l', main='Actuals and Interpolation', ylab='value of Actuals and Interpolation (dots)', xlab='time or index')
points(x[,1]-mysum$resid)
grid()
dev.off()
bitmap(file='test1.png')
plot(mysum$resid, type='b', pch=19, main='Residuals', ylab='value of Residuals', xlab='time or index')
grid()
dev.off()
bitmap(file='test2.png')
hist(mysum$resid, main='Residual Histogram', xlab='values of Residuals')
grid()
dev.off()
bitmap(file='test3.png')
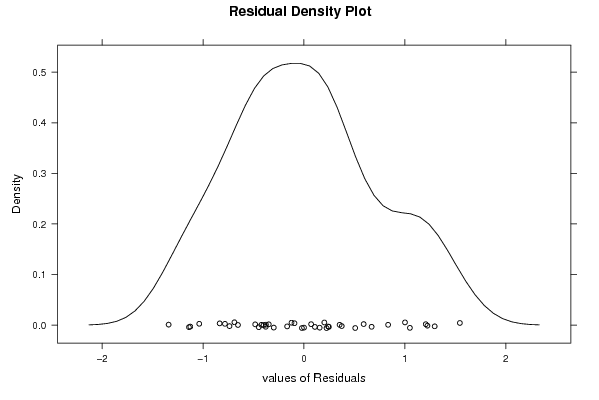
densityplot(~mysum$resid,col='black',main='Residual Density Plot', xlab='values of Residuals')
dev.off()
bitmap(file='test4.png')
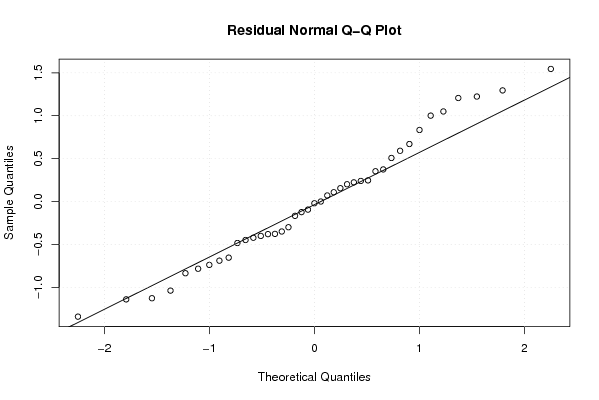
qqnorm(mysum$resid, main='Residual Normal Q-Q Plot')
qqline(mysum$resid)
grid()
dev.off()
(myerror <- as.ts(mysum$resid))
bitmap(file='test5.png')
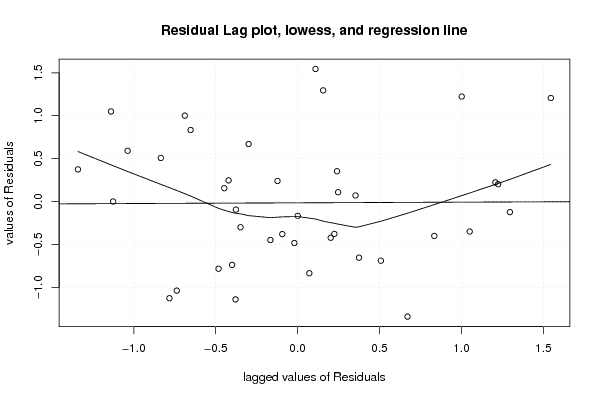
dum <- cbind(lag(myerror,k=1),myerror)
dum
dum1 <- dum[2:length(myerror),]
dum1
z <- as.data.frame(dum1)
z
plot(z,main=paste('Residual Lag plot, lowess, and regression line'), ylab='values of Residuals', xlab='lagged values of Residuals')
lines(lowess(z))
abline(lm(z))
grid()
dev.off()
bitmap(file='test6.png')
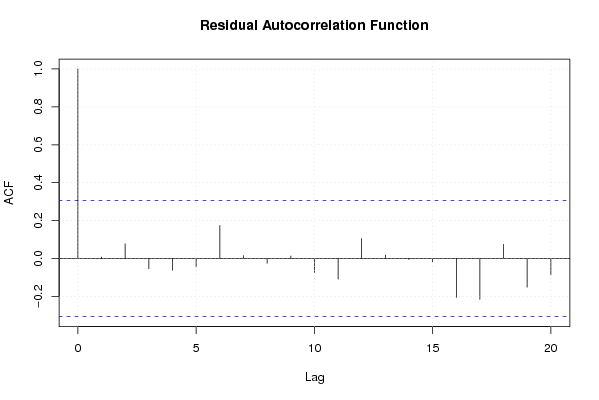
acf(mysum$resid, lag.max=length(mysum$resid)/2, main='Residual Autocorrelation Function')
grid()
dev.off()
bitmap(file='test7.png')
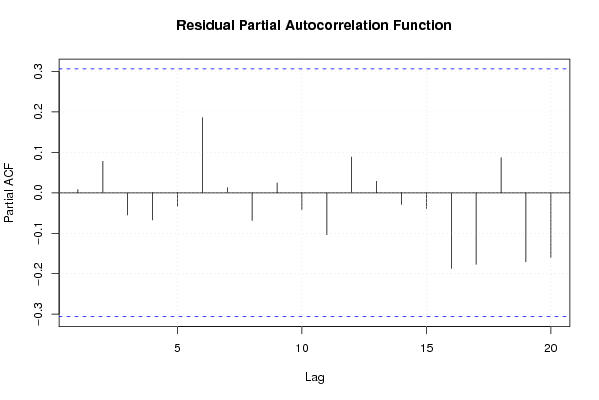
pacf(mysum$resid, lag.max=length(mysum$resid)/2, main='Residual Partial Autocorrelation Function')
grid()
dev.off()
bitmap(file='test8.png')
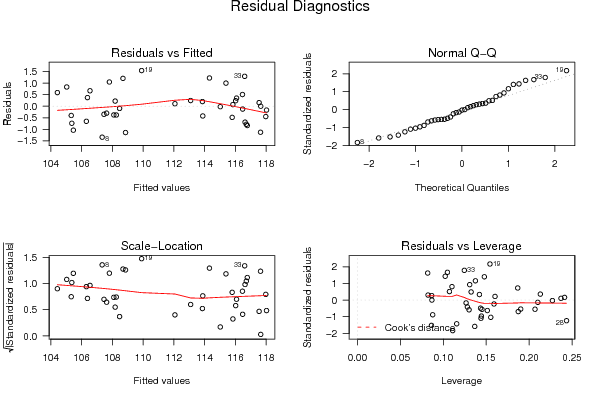
opar <- par(mfrow = c(2,2), oma = c(0, 0, 1.1, 0))
plot(mylm, las = 1, sub='Residual Diagnostics')
par(opar)
dev.off()
if (n > n25) {
bitmap(file='test9.png')
plot(kp3:nmkm3,gqarr[,2], main='Goldfeld-Quandt test',ylab='2-sided p-value',xlab='breakpoint')
grid()
dev.off()
}
load(file='createtable')
a<-table.start()
a<-table.row.start(a)
a<-table.element(a, 'Multiple Linear Regression - Estimated Regression Equation', 1, TRUE)
a<-table.row.end(a)
myeq <- colnames(x)[1]
myeq <- paste(myeq, '[t] = ', sep='')
for (i in 1:k){
if (mysum$coefficients[i,1] > 0) myeq <- paste(myeq, '+', '')
myeq <- paste(myeq, mysum$coefficients[i,1], sep=' ')
if (rownames(mysum$coefficients)[i] != '(Intercept)') {
myeq <- paste(myeq, rownames(mysum$coefficients)[i], sep='')
if (rownames(mysum$coefficients)[i] != 't') myeq <- paste(myeq, '[t]', sep='')
}
}
myeq <- paste(myeq, ' + e[t]')
a<-table.row.start(a)
a<-table.element(a, myeq)
a<-table.row.end(a)
a<-table.end(a)
table.save(a,file='mytable1.tab')
a<-table.start()
a<-table.row.start(a)
a<-table.element(a,hyperlink('ols1.htm','Multiple Linear Regression - Ordinary Least Squares',''), 6, TRUE)
a<-table.row.end(a)
a<-table.row.start(a)
a<-table.element(a,'Variable',header=TRUE)
a<-table.element(a,'Parameter',header=TRUE)
a<-table.element(a,'S.D.',header=TRUE)
a<-table.element(a,'T-STAT
H0: parameter = 0',header=TRUE)
a<-table.element(a,'2-tail p-value',header=TRUE)
a<-table.element(a,'1-tail p-value',header=TRUE)
a<-table.row.end(a)
for (i in 1:k){
a<-table.row.start(a)
a<-table.element(a,rownames(mysum$coefficients)[i],header=TRUE)
a<-table.element(a,mysum$coefficients[i,1])
a<-table.element(a, round(mysum$coefficients[i,2],6))
a<-table.element(a, round(mysum$coefficients[i,3],4))
a<-table.element(a, round(mysum$coefficients[i,4],6))
a<-table.element(a, round(mysum$coefficients[i,4]/2,6))
a<-table.row.end(a)
}
a<-table.end(a)
table.save(a,file='mytable2.tab')
a<-table.start()
a<-table.row.start(a)
a<-table.element(a, 'Multiple Linear Regression - Regression Statistics', 2, TRUE)
a<-table.row.end(a)
a<-table.row.start(a)
a<-table.element(a, 'Multiple R',1,TRUE)
a<-table.element(a, sqrt(mysum$r.squared))
a<-table.row.end(a)
a<-table.row.start(a)
a<-table.element(a, 'R-squared',1,TRUE)
a<-table.element(a, mysum$r.squared)
a<-table.row.end(a)
a<-table.row.start(a)
a<-table.element(a, 'Adjusted R-squared',1,TRUE)
a<-table.element(a, mysum$adj.r.squared)
a<-table.row.end(a)
a<-table.row.start(a)
a<-table.element(a, 'F-TEST (value)',1,TRUE)
a<-table.element(a, mysum$fstatistic[1])
a<-table.row.end(a)
a<-table.row.start(a)
a<-table.element(a, 'F-TEST (DF numerator)',1,TRUE)
a<-table.element(a, mysum$fstatistic[2])
a<-table.row.end(a)
a<-table.row.start(a)
a<-table.element(a, 'F-TEST (DF denominator)',1,TRUE)
a<-table.element(a, mysum$fstatistic[3])
a<-table.row.end(a)
a<-table.row.start(a)
a<-table.element(a, 'p-value',1,TRUE)
a<-table.element(a, 1-pf(mysum$fstatistic[1],mysum$fstatistic[2],mysum$fstatistic[3]))
a<-table.row.end(a)
a<-table.row.start(a)
a<-table.element(a, 'Multiple Linear Regression - Residual Statistics', 2, TRUE)
a<-table.row.end(a)
a<-table.row.start(a)
a<-table.element(a, 'Residual Standard Deviation',1,TRUE)
a<-table.element(a, mysum$sigma)
a<-table.row.end(a)
a<-table.row.start(a)
a<-table.element(a, 'Sum Squared Residuals',1,TRUE)
a<-table.element(a, sum(myerror*myerror))
a<-table.row.end(a)
a<-table.end(a)
table.save(a,file='mytable3.tab')
a<-table.start()
a<-table.row.start(a)
a<-table.element(a, 'Multiple Linear Regression - Actuals, Interpolation, and Residuals', 4, TRUE)
a<-table.row.end(a)
a<-table.row.start(a)
a<-table.element(a, 'Time or Index', 1, TRUE)
a<-table.element(a, 'Actuals', 1, TRUE)
a<-table.element(a, 'Interpolation
Forecast', 1, TRUE)
a<-table.element(a, 'Residuals
Prediction Error', 1, TRUE)
a<-table.row.end(a)
for (i in 1:n) {
a<-table.row.start(a)
a<-table.element(a,i, 1, TRUE)
a<-table.element(a,x[i])
a<-table.element(a,x[i]-mysum$resid[i])
a<-table.element(a,mysum$resid[i])
a<-table.row.end(a)
}
a<-table.end(a)
table.save(a,file='mytable4.tab')
if (n > n25) {
a<-table.start()
a<-table.row.start(a)
a<-table.element(a,'Goldfeld-Quandt test for Heteroskedasticity',4,TRUE)
a<-table.row.end(a)
a<-table.row.start(a)
a<-table.element(a,'p-values',header=TRUE)
a<-table.element(a,'Alternative Hypothesis',3,header=TRUE)
a<-table.row.end(a)
a<-table.row.start(a)
a<-table.element(a,'breakpoint index',header=TRUE)
a<-table.element(a,'greater',header=TRUE)
a<-table.element(a,'2-sided',header=TRUE)
a<-table.element(a,'less',header=TRUE)
a<-table.row.end(a)
for (mypoint in kp3:nmkm3) {
a<-table.row.start(a)
a<-table.element(a,mypoint,header=TRUE)
a<-table.element(a,gqarr[mypoint-kp3+1,1])
a<-table.element(a,gqarr[mypoint-kp3+1,2])
a<-table.element(a,gqarr[mypoint-kp3+1,3])
a<-table.row.end(a)
}
a<-table.end(a)
table.save(a,file='mytable5.tab')
a<-table.start()
a<-table.row.start(a)
a<-table.element(a,'Meta Analysis of Goldfeld-Quandt test for Heteroskedasticity',4,TRUE)
a<-table.row.end(a)
a<-table.row.start(a)
a<-table.element(a,'Description',header=TRUE)
a<-table.element(a,'# significant tests',header=TRUE)
a<-table.element(a,'% significant tests',header=TRUE)
a<-table.element(a,'OK/NOK',header=TRUE)
a<-table.row.end(a)
a<-table.row.start(a)
a<-table.element(a,'1% type I error level',header=TRUE)
a<-table.element(a,numsignificant1)
a<-table.element(a,numsignificant1/numgqtests)
if (numsignificant1/numgqtests < 0.01) dum <- 'OK' else dum <- 'NOK'
a<-table.element(a,dum)
a<-table.row.end(a)
a<-table.row.start(a)
a<-table.element(a,'5% type I error level',header=TRUE)
a<-table.element(a,numsignificant5)
a<-table.element(a,numsignificant5/numgqtests)
if (numsignificant5/numgqtests < 0.05) dum <- 'OK' else dum <- 'NOK'
a<-table.element(a,dum)
a<-table.row.end(a)
a<-table.row.start(a)
a<-table.element(a,'10% type I error level',header=TRUE)
a<-table.element(a,numsignificant10)
a<-table.element(a,numsignificant10/numgqtests)
if (numsignificant10/numgqtests < 0.1) dum <- 'OK' else dum <- 'NOK'
a<-table.element(a,dum)
a<-table.row.end(a)
a<-table.end(a)
table.save(a,file='mytable6.tab')
}