Free Statistics

of Irreproducible Research!

Author's title

Author*The author of this computation has been verified*
R Software Modulerwasp_multipleregression.wasp
Title produced by softwareMultiple Regression
Date of computationFri, 20 Nov 2009 17:24:09 -0700
Cite this page as followsStatistical Computations at FreeStatistics.org, Office for Research Development and Education, URL https://freestatistics.org/blog/index.php?v=date/2009/Nov/21/t12587631224snohktrjg1wpgc.htm/, Retrieved Sat, 27 Apr 2024 21:12:17 +0000
Statistical Computations at FreeStatistics.org, Office for Research Development and Education, URL https://freestatistics.org/blog/index.php?pk=58503, Retrieved Sat, 27 Apr 2024 21:12:17 +0000
QR Codes:

Original text written by user:
IsPrivate?No (this computation is public)
User-defined keywords
Estimated Impact181
Family? (F = Feedback message, R = changed R code, M = changed R Module, P = changed Parameters, D = changed Data)
-       [Multiple Regression] [shwws7vr1] [2009-11-21 00:24:09] [d447d4b3e35da686436a520338c962fc] [Current]
Feedback Forum

Post a new message
Dataseries X:
100,34	105,02	100,39	100,36	100,35	100,35
100,34	104,43	100,34	100,39	100,36	100,35
100,35	104,63	100,34	100,34	100,39	100,36
100,43	104,93	100,35	100,34	100,34	100,39
100,47	105,87	100,43	100,35	100,34	100,34
100,67	105,66	100,47	100,43	100,35	100,34
100,75	106,76	100,67	100,47	100,43	100,35
100,78	106	100,75	100,67	100,47	100,43
100,79	107,22	100,78	100,75	100,67	100,47
100,67	107,33	100,79	100,78	100,75	100,67
100,64	107,11	100,67	100,79	100,78	100,75
100,64	108,86	100,64	100,67	100,79	100,78
100,76	107,72	100,64	100,64	100,67	100,79
100,79	107,88	100,76	100,64	100,64	100,67
100,79	108,38	100,79	100,76	100,64	100,64
100,9	107,72	100,79	100,79	100,76	100,64
100,98	108,41	100,9	100,79	100,79	100,76
101,11	109,9	100,98	100,9	100,79	100,79
101,18	111,45	101,11	100,98	100,9	100,79
101,22	112,18	101,18	101,11	100,98	100,9
101,23	113,34	101,22	101,18	101,11	100,98
101,09	113,46	101,23	101,22	101,18	101,11
101,26	114,06	101,09	101,23	101,22	101,18
101,28	115,54	101,26	101,09	101,23	101,22
101,43	116,39	101,28	101,26	101,09	101,23
101,53	115,94	101,43	101,28	101,26	101,09
101,54	116,97	101,53	101,43	101,28	101,26
101,54	115,94	101,54	101,53	101,43	101,28
101,79	115,91	101,54	101,54	101,53	101,43
102,18	116,43	101,79	101,54	101,54	101,53
102,37	116,26	102,18	101,79	101,54	101,54
102,46	116,35	102,37	102,18	101,79	101,54
102,46	117,9	102,46	102,37	102,18	101,79
102,03	117,7	102,46	102,46	102,37	102,18
102,26	117,53	102,03	102,46	102,46	102,37
102,33	117,86	102,26	102,03	102,46	102,46
102,44	117,65	102,33	102,26	102,03	102,46
102,5	116,51	102,44	102,33	102,26	102,03
102,52	115,93	102,5	102,44	102,33	102,26
102,66	115,31	102,52	102,5	102,44	102,33
102,72	115	102,66	102,52	102,5	102,44


Summary of computational transaction
Raw Inputview raw input (R code)
Raw Outputview raw output of R engine
Computing time3 seconds
R Server'Gwilym Jenkins' @ 72.249.127.135

\begin{tabular}{lllllllll}
\hline
Summary of computational transaction \tabularnewline
Raw Input & view raw input (R code)  \tabularnewline
Raw Output & view raw output of R engine  \tabularnewline
Computing time & 3 seconds \tabularnewline
R Server & 'Gwilym Jenkins' @ 72.249.127.135 \tabularnewline
\hline
\end{tabular}
%Source: https://freestatistics.org/blog/index.php?pk=58503&T=0

[TABLE]
[ROW][C]Summary of computational transaction[/C][/ROW]
[ROW][C]Raw Input[/C][C]view raw input (R code) [/C][/ROW]
[ROW][C]Raw Output[/C][C]view raw output of R engine [/C][/ROW]
[ROW][C]Computing time[/C][C]3 seconds[/C][/ROW]
[ROW][C]R Server[/C][C]'Gwilym Jenkins' @ 72.249.127.135[/C][/ROW]
[/TABLE]
Source: https://freestatistics.org/blog/index.php?pk=58503&T=0

Globally Unique Identifier (entire table): ba.freestatistics.org/blog/index.php?pk=58503&T=0

As an alternative you can also use a QR Code:  

The GUIDs for individual cells are displayed in the table below:

Summary of computational transaction
Raw Inputview raw input (R code)
Raw Outputview raw output of R engine
Computing time3 seconds
R Server'Gwilym Jenkins' @ 72.249.127.135


Multiple Linear Regression - Estimated Regression Equation
y(t)[t] = + 3.23484343028908 + 0.00980623397008176`x(t)`[t] + 1.05967389184518`y(t-1)`[t] -0.078236397966839`y(t-2)`[t] -0.259322390600045`y(t-3)`[t] + 0.235745370015547`y(t-4)`[t] + e[t]

\begin{tabular}{lllllllll}
\hline
Multiple Linear Regression - Estimated Regression Equation \tabularnewline
y(t)[t] =  +  3.23484343028908 +  0.00980623397008176`x(t)`[t] +  1.05967389184518`y(t-1)`[t] -0.078236397966839`y(t-2)`[t] -0.259322390600045`y(t-3)`[t] +  0.235745370015547`y(t-4)`[t]  + e[t] \tabularnewline
\hline
\end{tabular}
%Source: https://freestatistics.org/blog/index.php?pk=58503&T=1

[TABLE]
[ROW][C]Multiple Linear Regression - Estimated Regression Equation[/C][/ROW]
[ROW][C]y(t)[t] =  +  3.23484343028908 +  0.00980623397008176`x(t)`[t] +  1.05967389184518`y(t-1)`[t] -0.078236397966839`y(t-2)`[t] -0.259322390600045`y(t-3)`[t] +  0.235745370015547`y(t-4)`[t]  + e[t][/C][/ROW]
[/TABLE]
Source: https://freestatistics.org/blog/index.php?pk=58503&T=1

Globally Unique Identifier (entire table): ba.freestatistics.org/blog/index.php?pk=58503&T=1

As an alternative you can also use a QR Code:  

The GUIDs for individual cells are displayed in the table below:

Multiple Linear Regression - Estimated Regression Equation
y(t)[t] = + 3.23484343028908 + 0.00980623397008176`x(t)`[t] + 1.05967389184518`y(t-1)`[t] -0.078236397966839`y(t-2)`[t] -0.259322390600045`y(t-3)`[t] + 0.235745370015547`y(t-4)`[t] + e[t]


Multiple Linear Regression - Ordinary Least Squares
VariableParameterS.D.T-STATH0: parameter = 02-tail p-value1-tail p-value
(Intercept)3.234843430289085.3509320.60450.5493850.274693
`x(t)`0.009806233970081760.009351.04880.3014380.150719
`y(t-1)`1.059673891845180.1663926.368500
`y(t-2)`-0.0782363979668390.241364-0.32410.7477590.37388
`y(t-3)`-0.2593223906000450.242875-1.06770.2929570.146479
`y(t-4)`0.2357453700155470.1672811.40930.1675760.083788

\begin{tabular}{lllllllll}
\hline
Multiple Linear Regression - Ordinary Least Squares \tabularnewline
Variable & Parameter & S.D. & T-STATH0: parameter = 0 & 2-tail p-value & 1-tail p-value \tabularnewline
(Intercept) & 3.23484343028908 & 5.350932 & 0.6045 & 0.549385 & 0.274693 \tabularnewline
`x(t)` & 0.00980623397008176 & 0.00935 & 1.0488 & 0.301438 & 0.150719 \tabularnewline
`y(t-1)` & 1.05967389184518 & 0.166392 & 6.3685 & 0 & 0 \tabularnewline
`y(t-2)` & -0.078236397966839 & 0.241364 & -0.3241 & 0.747759 & 0.37388 \tabularnewline
`y(t-3)` & -0.259322390600045 & 0.242875 & -1.0677 & 0.292957 & 0.146479 \tabularnewline
`y(t-4)` & 0.235745370015547 & 0.167281 & 1.4093 & 0.167576 & 0.083788 \tabularnewline
\hline
\end{tabular}
%Source: https://freestatistics.org/blog/index.php?pk=58503&T=2

[TABLE]
[ROW][C]Multiple Linear Regression - Ordinary Least Squares[/C][/ROW]
[ROW][C]Variable[/C][C]Parameter[/C][C]S.D.[/C][C]T-STATH0: parameter = 0[/C][C]2-tail p-value[/C][C]1-tail p-value[/C][/ROW]
[ROW][C](Intercept)[/C][C]3.23484343028908[/C][C]5.350932[/C][C]0.6045[/C][C]0.549385[/C][C]0.274693[/C][/ROW]
[ROW][C]`x(t)`[/C][C]0.00980623397008176[/C][C]0.00935[/C][C]1.0488[/C][C]0.301438[/C][C]0.150719[/C][/ROW]
[ROW][C]`y(t-1)`[/C][C]1.05967389184518[/C][C]0.166392[/C][C]6.3685[/C][C]0[/C][C]0[/C][/ROW]
[ROW][C]`y(t-2)`[/C][C]-0.078236397966839[/C][C]0.241364[/C][C]-0.3241[/C][C]0.747759[/C][C]0.37388[/C][/ROW]
[ROW][C]`y(t-3)`[/C][C]-0.259322390600045[/C][C]0.242875[/C][C]-1.0677[/C][C]0.292957[/C][C]0.146479[/C][/ROW]
[ROW][C]`y(t-4)`[/C][C]0.235745370015547[/C][C]0.167281[/C][C]1.4093[/C][C]0.167576[/C][C]0.083788[/C][/ROW]
[/TABLE]
Source: https://freestatistics.org/blog/index.php?pk=58503&T=2

Globally Unique Identifier (entire table): ba.freestatistics.org/blog/index.php?pk=58503&T=2

As an alternative you can also use a QR Code:  

The GUIDs for individual cells are displayed in the table below:

Multiple Linear Regression - Ordinary Least Squares
VariableParameterS.D.T-STATH0: parameter = 02-tail p-value1-tail p-value
(Intercept)3.234843430289085.3509320.60450.5493850.274693
`x(t)`0.009806233970081760.009351.04880.3014380.150719
`y(t-1)`1.059673891845180.1663926.368500
`y(t-2)`-0.0782363979668390.241364-0.32410.7477590.37388
`y(t-3)`-0.2593223906000450.242875-1.06770.2929570.146479
`y(t-4)`0.2357453700155470.1672811.40930.1675760.083788


Multiple Linear Regression - Regression Statistics
Multiple R0.987945997772003
R-squared0.976037294513718
Adjusted R-squared0.97261405087282
F-TEST (value)285.120603994712
F-TEST (DF numerator)5
F-TEST (DF denominator)35
p-value0
Multiple Linear Regression - Residual Statistics
Residual Standard Deviation0.126325888335065
Sum Squared Residuals0.558538052227512

\begin{tabular}{lllllllll}
\hline
Multiple Linear Regression - Regression Statistics \tabularnewline
Multiple R & 0.987945997772003 \tabularnewline
R-squared & 0.976037294513718 \tabularnewline
Adjusted R-squared & 0.97261405087282 \tabularnewline
F-TEST (value) & 285.120603994712 \tabularnewline
F-TEST (DF numerator) & 5 \tabularnewline
F-TEST (DF denominator) & 35 \tabularnewline
p-value & 0 \tabularnewline
Multiple Linear Regression - Residual Statistics \tabularnewline
Residual Standard Deviation & 0.126325888335065 \tabularnewline
Sum Squared Residuals & 0.558538052227512 \tabularnewline
\hline
\end{tabular}
%Source: https://freestatistics.org/blog/index.php?pk=58503&T=3

[TABLE]
[ROW][C]Multiple Linear Regression - Regression Statistics[/C][/ROW]
[ROW][C]Multiple R[/C][C]0.987945997772003[/C][/ROW]
[ROW][C]R-squared[/C][C]0.976037294513718[/C][/ROW]
[ROW][C]Adjusted R-squared[/C][C]0.97261405087282[/C][/ROW]
[ROW][C]F-TEST (value)[/C][C]285.120603994712[/C][/ROW]
[ROW][C]F-TEST (DF numerator)[/C][C]5[/C][/ROW]
[ROW][C]F-TEST (DF denominator)[/C][C]35[/C][/ROW]
[ROW][C]p-value[/C][C]0[/C][/ROW]
[ROW][C]Multiple Linear Regression - Residual Statistics[/C][/ROW]
[ROW][C]Residual Standard Deviation[/C][C]0.126325888335065[/C][/ROW]
[ROW][C]Sum Squared Residuals[/C][C]0.558538052227512[/C][/ROW]
[/TABLE]
Source: https://freestatistics.org/blog/index.php?pk=58503&T=3

Globally Unique Identifier (entire table): ba.freestatistics.org/blog/index.php?pk=58503&T=3

As an alternative you can also use a QR Code:  

The GUIDs for individual cells are displayed in the table below:

Multiple Linear Regression - Regression Statistics
Multiple R0.987945997772003
R-squared0.976037294513718
Adjusted R-squared0.97261405087282
F-TEST (value)285.120603994712
F-TEST (DF numerator)5
F-TEST (DF denominator)35
p-value0
Multiple Linear Regression - Residual Statistics
Residual Standard Deviation0.126325888335065
Sum Squared Residuals0.558538052227512


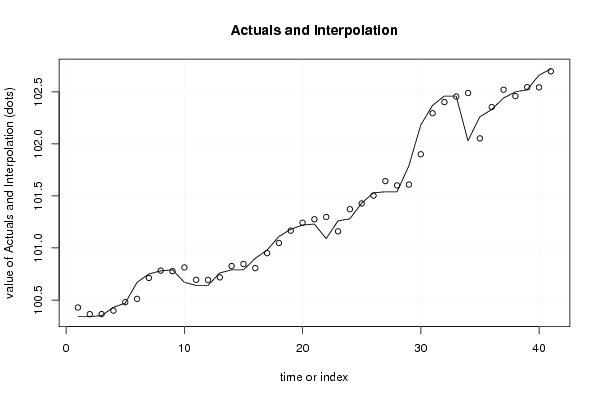
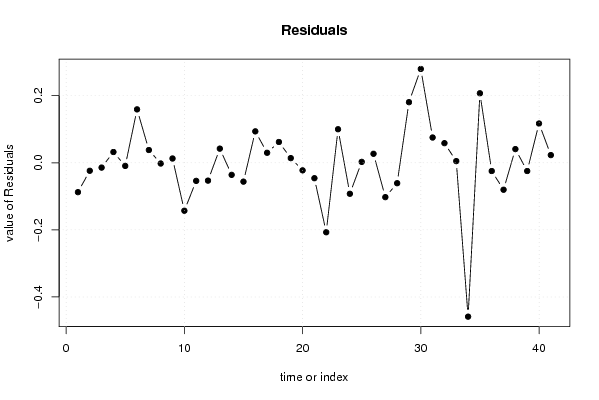
Multiple Linear Regression - Actuals, Interpolation, and Residuals
Time or IndexActualsInterpolationForecastResidualsPrediction Error
1100.34100.427597208559-0.0875972085586901
2100.34100.363887520079-0.0238875200790140
3100.35100.364338368754-0.0143383687535358
4100.43100.3979154584930.0320845415065422
5100.47100.479337597293-0.009337597292526
6100.67100.5108131080890.159186891910742
7100.75100.7120169503590.0379830496411366
8100.78100.782177578273-0.00217757827309182
9100.79100.7772378253150.0127621746847935
10100.67100.812969440786-0.142969440786479
11100.64100.693948796195-0.0539487961952083
12100.64100.693186993838-0.0531869938379806
13100.76100.7178311196230.0421688803767487
14100.79100.826051211396-0.0360512113960248
15100.79100.84628381628-0.0562838162799347
16100.9100.8063459230490.0936540769513304
17100.98100.9501861252750.0298138747251378
18101.11101.0480376825620.0619623174379843
19101.18101.1662105763520.0137894236478478
20101.22101.242561767298-0.0225617672975086
21101.23101.275995125342-0.0459951253421565
22101.09101.297133487178-0.207133487178366
23101.26101.1600097990000.099990201000491
24101.28101.372457273499-0.0924572734988925
25101.43101.4273484509400.00265154905984417
26101.53101.5032328432670.026767156733113
27101.54101.642455458836-0.102455458836195
28101.54101.600944685779-0.060944685779087
29101.79101.6092977012230.180702298777354
30102.18101.9002967289440.279703271056065
31102.37102.2947008411970.0752991588029078
32102.46102.4015786488480.0584213511520858
33102.46102.4550846563240.00491534367623404
34102.03102.488751573805-0.458751573804783
35102.26102.0528773456850.207122654314603
36102.33102.354697132447-0.0246971324470634
37102.44102.520329252168-0.0803292521681463
38102.5102.4592230667430.0407769332571525
39102.52102.544578748536-0.0245787485361407
40102.66102.5429748903690.117025109631340
41102.72102.6970972220030.022902777997371

\begin{tabular}{lllllllll}
\hline
Multiple Linear Regression - Actuals, Interpolation, and Residuals \tabularnewline
Time or Index & Actuals & InterpolationForecast & ResidualsPrediction Error \tabularnewline
1 & 100.34 & 100.427597208559 & -0.0875972085586901 \tabularnewline
2 & 100.34 & 100.363887520079 & -0.0238875200790140 \tabularnewline
3 & 100.35 & 100.364338368754 & -0.0143383687535358 \tabularnewline
4 & 100.43 & 100.397915458493 & 0.0320845415065422 \tabularnewline
5 & 100.47 & 100.479337597293 & -0.009337597292526 \tabularnewline
6 & 100.67 & 100.510813108089 & 0.159186891910742 \tabularnewline
7 & 100.75 & 100.712016950359 & 0.0379830496411366 \tabularnewline
8 & 100.78 & 100.782177578273 & -0.00217757827309182 \tabularnewline
9 & 100.79 & 100.777237825315 & 0.0127621746847935 \tabularnewline
10 & 100.67 & 100.812969440786 & -0.142969440786479 \tabularnewline
11 & 100.64 & 100.693948796195 & -0.0539487961952083 \tabularnewline
12 & 100.64 & 100.693186993838 & -0.0531869938379806 \tabularnewline
13 & 100.76 & 100.717831119623 & 0.0421688803767487 \tabularnewline
14 & 100.79 & 100.826051211396 & -0.0360512113960248 \tabularnewline
15 & 100.79 & 100.84628381628 & -0.0562838162799347 \tabularnewline
16 & 100.9 & 100.806345923049 & 0.0936540769513304 \tabularnewline
17 & 100.98 & 100.950186125275 & 0.0298138747251378 \tabularnewline
18 & 101.11 & 101.048037682562 & 0.0619623174379843 \tabularnewline
19 & 101.18 & 101.166210576352 & 0.0137894236478478 \tabularnewline
20 & 101.22 & 101.242561767298 & -0.0225617672975086 \tabularnewline
21 & 101.23 & 101.275995125342 & -0.0459951253421565 \tabularnewline
22 & 101.09 & 101.297133487178 & -0.207133487178366 \tabularnewline
23 & 101.26 & 101.160009799000 & 0.099990201000491 \tabularnewline
24 & 101.28 & 101.372457273499 & -0.0924572734988925 \tabularnewline
25 & 101.43 & 101.427348450940 & 0.00265154905984417 \tabularnewline
26 & 101.53 & 101.503232843267 & 0.026767156733113 \tabularnewline
27 & 101.54 & 101.642455458836 & -0.102455458836195 \tabularnewline
28 & 101.54 & 101.600944685779 & -0.060944685779087 \tabularnewline
29 & 101.79 & 101.609297701223 & 0.180702298777354 \tabularnewline
30 & 102.18 & 101.900296728944 & 0.279703271056065 \tabularnewline
31 & 102.37 & 102.294700841197 & 0.0752991588029078 \tabularnewline
32 & 102.46 & 102.401578648848 & 0.0584213511520858 \tabularnewline
33 & 102.46 & 102.455084656324 & 0.00491534367623404 \tabularnewline
34 & 102.03 & 102.488751573805 & -0.458751573804783 \tabularnewline
35 & 102.26 & 102.052877345685 & 0.207122654314603 \tabularnewline
36 & 102.33 & 102.354697132447 & -0.0246971324470634 \tabularnewline
37 & 102.44 & 102.520329252168 & -0.0803292521681463 \tabularnewline
38 & 102.5 & 102.459223066743 & 0.0407769332571525 \tabularnewline
39 & 102.52 & 102.544578748536 & -0.0245787485361407 \tabularnewline
40 & 102.66 & 102.542974890369 & 0.117025109631340 \tabularnewline
41 & 102.72 & 102.697097222003 & 0.022902777997371 \tabularnewline
\hline
\end{tabular}
%Source: https://freestatistics.org/blog/index.php?pk=58503&T=4

[TABLE]
[ROW][C]Multiple Linear Regression - Actuals, Interpolation, and Residuals[/C][/ROW]
[ROW][C]Time or Index[/C][C]Actuals[/C][C]InterpolationForecast[/C][C]ResidualsPrediction Error[/C][/ROW]
[ROW][C]1[/C][C]100.34[/C][C]100.427597208559[/C][C]-0.0875972085586901[/C][/ROW]
[ROW][C]2[/C][C]100.34[/C][C]100.363887520079[/C][C]-0.0238875200790140[/C][/ROW]
[ROW][C]3[/C][C]100.35[/C][C]100.364338368754[/C][C]-0.0143383687535358[/C][/ROW]
[ROW][C]4[/C][C]100.43[/C][C]100.397915458493[/C][C]0.0320845415065422[/C][/ROW]
[ROW][C]5[/C][C]100.47[/C][C]100.479337597293[/C][C]-0.009337597292526[/C][/ROW]
[ROW][C]6[/C][C]100.67[/C][C]100.510813108089[/C][C]0.159186891910742[/C][/ROW]
[ROW][C]7[/C][C]100.75[/C][C]100.712016950359[/C][C]0.0379830496411366[/C][/ROW]
[ROW][C]8[/C][C]100.78[/C][C]100.782177578273[/C][C]-0.00217757827309182[/C][/ROW]
[ROW][C]9[/C][C]100.79[/C][C]100.777237825315[/C][C]0.0127621746847935[/C][/ROW]
[ROW][C]10[/C][C]100.67[/C][C]100.812969440786[/C][C]-0.142969440786479[/C][/ROW]
[ROW][C]11[/C][C]100.64[/C][C]100.693948796195[/C][C]-0.0539487961952083[/C][/ROW]
[ROW][C]12[/C][C]100.64[/C][C]100.693186993838[/C][C]-0.0531869938379806[/C][/ROW]
[ROW][C]13[/C][C]100.76[/C][C]100.717831119623[/C][C]0.0421688803767487[/C][/ROW]
[ROW][C]14[/C][C]100.79[/C][C]100.826051211396[/C][C]-0.0360512113960248[/C][/ROW]
[ROW][C]15[/C][C]100.79[/C][C]100.84628381628[/C][C]-0.0562838162799347[/C][/ROW]
[ROW][C]16[/C][C]100.9[/C][C]100.806345923049[/C][C]0.0936540769513304[/C][/ROW]
[ROW][C]17[/C][C]100.98[/C][C]100.950186125275[/C][C]0.0298138747251378[/C][/ROW]
[ROW][C]18[/C][C]101.11[/C][C]101.048037682562[/C][C]0.0619623174379843[/C][/ROW]
[ROW][C]19[/C][C]101.18[/C][C]101.166210576352[/C][C]0.0137894236478478[/C][/ROW]
[ROW][C]20[/C][C]101.22[/C][C]101.242561767298[/C][C]-0.0225617672975086[/C][/ROW]
[ROW][C]21[/C][C]101.23[/C][C]101.275995125342[/C][C]-0.0459951253421565[/C][/ROW]
[ROW][C]22[/C][C]101.09[/C][C]101.297133487178[/C][C]-0.207133487178366[/C][/ROW]
[ROW][C]23[/C][C]101.26[/C][C]101.160009799000[/C][C]0.099990201000491[/C][/ROW]
[ROW][C]24[/C][C]101.28[/C][C]101.372457273499[/C][C]-0.0924572734988925[/C][/ROW]
[ROW][C]25[/C][C]101.43[/C][C]101.427348450940[/C][C]0.00265154905984417[/C][/ROW]
[ROW][C]26[/C][C]101.53[/C][C]101.503232843267[/C][C]0.026767156733113[/C][/ROW]
[ROW][C]27[/C][C]101.54[/C][C]101.642455458836[/C][C]-0.102455458836195[/C][/ROW]
[ROW][C]28[/C][C]101.54[/C][C]101.600944685779[/C][C]-0.060944685779087[/C][/ROW]
[ROW][C]29[/C][C]101.79[/C][C]101.609297701223[/C][C]0.180702298777354[/C][/ROW]
[ROW][C]30[/C][C]102.18[/C][C]101.900296728944[/C][C]0.279703271056065[/C][/ROW]
[ROW][C]31[/C][C]102.37[/C][C]102.294700841197[/C][C]0.0752991588029078[/C][/ROW]
[ROW][C]32[/C][C]102.46[/C][C]102.401578648848[/C][C]0.0584213511520858[/C][/ROW]
[ROW][C]33[/C][C]102.46[/C][C]102.455084656324[/C][C]0.00491534367623404[/C][/ROW]
[ROW][C]34[/C][C]102.03[/C][C]102.488751573805[/C][C]-0.458751573804783[/C][/ROW]
[ROW][C]35[/C][C]102.26[/C][C]102.052877345685[/C][C]0.207122654314603[/C][/ROW]
[ROW][C]36[/C][C]102.33[/C][C]102.354697132447[/C][C]-0.0246971324470634[/C][/ROW]
[ROW][C]37[/C][C]102.44[/C][C]102.520329252168[/C][C]-0.0803292521681463[/C][/ROW]
[ROW][C]38[/C][C]102.5[/C][C]102.459223066743[/C][C]0.0407769332571525[/C][/ROW]
[ROW][C]39[/C][C]102.52[/C][C]102.544578748536[/C][C]-0.0245787485361407[/C][/ROW]
[ROW][C]40[/C][C]102.66[/C][C]102.542974890369[/C][C]0.117025109631340[/C][/ROW]
[ROW][C]41[/C][C]102.72[/C][C]102.697097222003[/C][C]0.022902777997371[/C][/ROW]
[/TABLE]
Source: https://freestatistics.org/blog/index.php?pk=58503&T=4

Globally Unique Identifier (entire table): ba.freestatistics.org/blog/index.php?pk=58503&T=4

As an alternative you can also use a QR Code:  

The GUIDs for individual cells are displayed in the table below:

Multiple Linear Regression - Actuals, Interpolation, and Residuals
Time or IndexActualsInterpolationForecastResidualsPrediction Error
1100.34100.427597208559-0.0875972085586901
2100.34100.363887520079-0.0238875200790140
3100.35100.364338368754-0.0143383687535358
4100.43100.3979154584930.0320845415065422
5100.47100.479337597293-0.009337597292526
6100.67100.5108131080890.159186891910742
7100.75100.7120169503590.0379830496411366
8100.78100.782177578273-0.00217757827309182
9100.79100.7772378253150.0127621746847935
10100.67100.812969440786-0.142969440786479
11100.64100.693948796195-0.0539487961952083
12100.64100.693186993838-0.0531869938379806
13100.76100.7178311196230.0421688803767487
14100.79100.826051211396-0.0360512113960248
15100.79100.84628381628-0.0562838162799347
16100.9100.8063459230490.0936540769513304
17100.98100.9501861252750.0298138747251378
18101.11101.0480376825620.0619623174379843
19101.18101.1662105763520.0137894236478478
20101.22101.242561767298-0.0225617672975086
21101.23101.275995125342-0.0459951253421565
22101.09101.297133487178-0.207133487178366
23101.26101.1600097990000.099990201000491
24101.28101.372457273499-0.0924572734988925
25101.43101.4273484509400.00265154905984417
26101.53101.5032328432670.026767156733113
27101.54101.642455458836-0.102455458836195
28101.54101.600944685779-0.060944685779087
29101.79101.6092977012230.180702298777354
30102.18101.9002967289440.279703271056065
31102.37102.2947008411970.0752991588029078
32102.46102.4015786488480.0584213511520858
33102.46102.4550846563240.00491534367623404
34102.03102.488751573805-0.458751573804783
35102.26102.0528773456850.207122654314603
36102.33102.354697132447-0.0246971324470634
37102.44102.520329252168-0.0803292521681463
38102.5102.4592230667430.0407769332571525
39102.52102.544578748536-0.0245787485361407
40102.66102.5429748903690.117025109631340
41102.72102.6970972220030.022902777997371


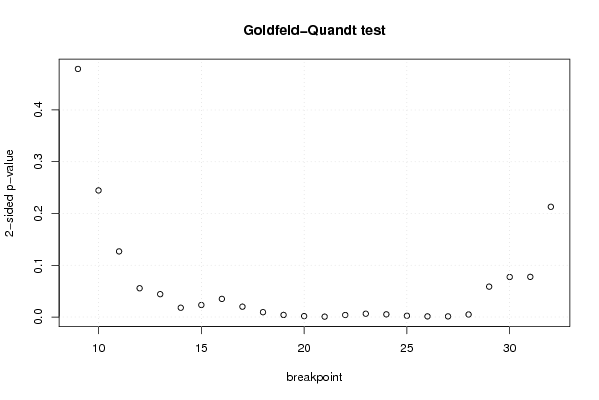
Goldfeld-Quandt test for Heteroskedasticity
p-valuesAlternative Hypothesis
breakpoint indexgreater2-sidedless
90.2395932392005570.4791864784011150.760406760799442
100.1222813693870270.2445627387740540.877718630612973
110.06340536014523490.1268107202904700.936594639854765
120.02781089722133770.05562179444267550.972189102778662
130.02208409829076500.04416819658153010.977915901709235
140.008989671598874510.01797934319774900.991010328401125
150.01163833292038020.02327666584076040.98836166707962
160.01751893568947090.03503787137894180.98248106431053
170.01000570604603610.02001141209207210.989994293953964
180.004716638203970710.009433276407941420.99528336179603
190.002039068949725950.004078137899451910.997960931050274
200.0009154431515559470.001830886303111890.999084556848444
210.0003851340813311310.0007702681626622610.999614865918669
220.001958554220078660.003917108440157320.998041445779921
230.003200027580396180.006400055160792370.996799972419604
240.00262846489800840.00525692979601680.997371535101992
250.001251223286091910.002502446572183810.998748776713908
260.0006748337944990110.001349667588998020.9993251662055
270.0006618785757139880.001323757151427980.999338121424286
280.002472503742087030.004945007484174060.997527496257913
290.02936381564561130.05872763129122270.970636184354389
300.03866335519149630.07732671038299250.961336644808504
310.03880130293805120.07760260587610230.961198697061949
320.1064795985877760.2129591971755530.893520401412224

\begin{tabular}{lllllllll}
\hline
Goldfeld-Quandt test for Heteroskedasticity \tabularnewline
p-values & Alternative Hypothesis \tabularnewline
breakpoint index & greater & 2-sided & less \tabularnewline
9 & 0.239593239200557 & 0.479186478401115 & 0.760406760799442 \tabularnewline
10 & 0.122281369387027 & 0.244562738774054 & 0.877718630612973 \tabularnewline
11 & 0.0634053601452349 & 0.126810720290470 & 0.936594639854765 \tabularnewline
12 & 0.0278108972213377 & 0.0556217944426755 & 0.972189102778662 \tabularnewline
13 & 0.0220840982907650 & 0.0441681965815301 & 0.977915901709235 \tabularnewline
14 & 0.00898967159887451 & 0.0179793431977490 & 0.991010328401125 \tabularnewline
15 & 0.0116383329203802 & 0.0232766658407604 & 0.98836166707962 \tabularnewline
16 & 0.0175189356894709 & 0.0350378713789418 & 0.98248106431053 \tabularnewline
17 & 0.0100057060460361 & 0.0200114120920721 & 0.989994293953964 \tabularnewline
18 & 0.00471663820397071 & 0.00943327640794142 & 0.99528336179603 \tabularnewline
19 & 0.00203906894972595 & 0.00407813789945191 & 0.997960931050274 \tabularnewline
20 & 0.000915443151555947 & 0.00183088630311189 & 0.999084556848444 \tabularnewline
21 & 0.000385134081331131 & 0.000770268162662261 & 0.999614865918669 \tabularnewline
22 & 0.00195855422007866 & 0.00391710844015732 & 0.998041445779921 \tabularnewline
23 & 0.00320002758039618 & 0.00640005516079237 & 0.996799972419604 \tabularnewline
24 & 0.0026284648980084 & 0.0052569297960168 & 0.997371535101992 \tabularnewline
25 & 0.00125122328609191 & 0.00250244657218381 & 0.998748776713908 \tabularnewline
26 & 0.000674833794499011 & 0.00134966758899802 & 0.9993251662055 \tabularnewline
27 & 0.000661878575713988 & 0.00132375715142798 & 0.999338121424286 \tabularnewline
28 & 0.00247250374208703 & 0.00494500748417406 & 0.997527496257913 \tabularnewline
29 & 0.0293638156456113 & 0.0587276312912227 & 0.970636184354389 \tabularnewline
30 & 0.0386633551914963 & 0.0773267103829925 & 0.961336644808504 \tabularnewline
31 & 0.0388013029380512 & 0.0776026058761023 & 0.961198697061949 \tabularnewline
32 & 0.106479598587776 & 0.212959197175553 & 0.893520401412224 \tabularnewline
\hline
\end{tabular}
%Source: https://freestatistics.org/blog/index.php?pk=58503&T=5

[TABLE]
[ROW][C]Goldfeld-Quandt test for Heteroskedasticity[/C][/ROW]
[ROW][C]p-values[/C][C]Alternative Hypothesis[/C][/ROW]
[ROW][C]breakpoint index[/C][C]greater[/C][C]2-sided[/C][C]less[/C][/ROW]
[ROW][C]9[/C][C]0.239593239200557[/C][C]0.479186478401115[/C][C]0.760406760799442[/C][/ROW]
[ROW][C]10[/C][C]0.122281369387027[/C][C]0.244562738774054[/C][C]0.877718630612973[/C][/ROW]
[ROW][C]11[/C][C]0.0634053601452349[/C][C]0.126810720290470[/C][C]0.936594639854765[/C][/ROW]
[ROW][C]12[/C][C]0.0278108972213377[/C][C]0.0556217944426755[/C][C]0.972189102778662[/C][/ROW]
[ROW][C]13[/C][C]0.0220840982907650[/C][C]0.0441681965815301[/C][C]0.977915901709235[/C][/ROW]
[ROW][C]14[/C][C]0.00898967159887451[/C][C]0.0179793431977490[/C][C]0.991010328401125[/C][/ROW]
[ROW][C]15[/C][C]0.0116383329203802[/C][C]0.0232766658407604[/C][C]0.98836166707962[/C][/ROW]
[ROW][C]16[/C][C]0.0175189356894709[/C][C]0.0350378713789418[/C][C]0.98248106431053[/C][/ROW]
[ROW][C]17[/C][C]0.0100057060460361[/C][C]0.0200114120920721[/C][C]0.989994293953964[/C][/ROW]
[ROW][C]18[/C][C]0.00471663820397071[/C][C]0.00943327640794142[/C][C]0.99528336179603[/C][/ROW]
[ROW][C]19[/C][C]0.00203906894972595[/C][C]0.00407813789945191[/C][C]0.997960931050274[/C][/ROW]
[ROW][C]20[/C][C]0.000915443151555947[/C][C]0.00183088630311189[/C][C]0.999084556848444[/C][/ROW]
[ROW][C]21[/C][C]0.000385134081331131[/C][C]0.000770268162662261[/C][C]0.999614865918669[/C][/ROW]
[ROW][C]22[/C][C]0.00195855422007866[/C][C]0.00391710844015732[/C][C]0.998041445779921[/C][/ROW]
[ROW][C]23[/C][C]0.00320002758039618[/C][C]0.00640005516079237[/C][C]0.996799972419604[/C][/ROW]
[ROW][C]24[/C][C]0.0026284648980084[/C][C]0.0052569297960168[/C][C]0.997371535101992[/C][/ROW]
[ROW][C]25[/C][C]0.00125122328609191[/C][C]0.00250244657218381[/C][C]0.998748776713908[/C][/ROW]
[ROW][C]26[/C][C]0.000674833794499011[/C][C]0.00134966758899802[/C][C]0.9993251662055[/C][/ROW]
[ROW][C]27[/C][C]0.000661878575713988[/C][C]0.00132375715142798[/C][C]0.999338121424286[/C][/ROW]
[ROW][C]28[/C][C]0.00247250374208703[/C][C]0.00494500748417406[/C][C]0.997527496257913[/C][/ROW]
[ROW][C]29[/C][C]0.0293638156456113[/C][C]0.0587276312912227[/C][C]0.970636184354389[/C][/ROW]
[ROW][C]30[/C][C]0.0386633551914963[/C][C]0.0773267103829925[/C][C]0.961336644808504[/C][/ROW]
[ROW][C]31[/C][C]0.0388013029380512[/C][C]0.0776026058761023[/C][C]0.961198697061949[/C][/ROW]
[ROW][C]32[/C][C]0.106479598587776[/C][C]0.212959197175553[/C][C]0.893520401412224[/C][/ROW]
[/TABLE]
Source: https://freestatistics.org/blog/index.php?pk=58503&T=5

Globally Unique Identifier (entire table): ba.freestatistics.org/blog/index.php?pk=58503&T=5

As an alternative you can also use a QR Code:  

The GUIDs for individual cells are displayed in the table below:

Goldfeld-Quandt test for Heteroskedasticity
p-valuesAlternative Hypothesis
breakpoint indexgreater2-sidedless
90.2395932392005570.4791864784011150.760406760799442
100.1222813693870270.2445627387740540.877718630612973
110.06340536014523490.1268107202904700.936594639854765
120.02781089722133770.05562179444267550.972189102778662
130.02208409829076500.04416819658153010.977915901709235
140.008989671598874510.01797934319774900.991010328401125
150.01163833292038020.02327666584076040.98836166707962
160.01751893568947090.03503787137894180.98248106431053
170.01000570604603610.02001141209207210.989994293953964
180.004716638203970710.009433276407941420.99528336179603
190.002039068949725950.004078137899451910.997960931050274
200.0009154431515559470.001830886303111890.999084556848444
210.0003851340813311310.0007702681626622610.999614865918669
220.001958554220078660.003917108440157320.998041445779921
230.003200027580396180.006400055160792370.996799972419604
240.00262846489800840.00525692979601680.997371535101992
250.001251223286091910.002502446572183810.998748776713908
260.0006748337944990110.001349667588998020.9993251662055
270.0006618785757139880.001323757151427980.999338121424286
280.002472503742087030.004945007484174060.997527496257913
290.02936381564561130.05872763129122270.970636184354389
300.03866335519149630.07732671038299250.961336644808504
310.03880130293805120.07760260587610230.961198697061949
320.1064795985877760.2129591971755530.893520401412224


Meta Analysis of Goldfeld-Quandt test for Heteroskedasticity
Description# significant tests% significant testsOK/NOK
1% type I error level110.458333333333333NOK
5% type I error level160.666666666666667NOK
10% type I error level200.833333333333333NOK

\begin{tabular}{lllllllll}
\hline
Meta Analysis of Goldfeld-Quandt test for Heteroskedasticity \tabularnewline
Description & # significant tests & % significant tests & OK/NOK \tabularnewline
1% type I error level & 11 & 0.458333333333333 & NOK \tabularnewline
5% type I error level & 16 & 0.666666666666667 & NOK \tabularnewline
10% type I error level & 20 & 0.833333333333333 & NOK \tabularnewline
\hline
\end{tabular}
%Source: https://freestatistics.org/blog/index.php?pk=58503&T=6

[TABLE]
[ROW][C]Meta Analysis of Goldfeld-Quandt test for Heteroskedasticity[/C][/ROW]
[ROW][C]Description[/C][C]# significant tests[/C][C]% significant tests[/C][C]OK/NOK[/C][/ROW]
[ROW][C]1% type I error level[/C][C]11[/C][C]0.458333333333333[/C][C]NOK[/C][/ROW]
[ROW][C]5% type I error level[/C][C]16[/C][C]0.666666666666667[/C][C]NOK[/C][/ROW]
[ROW][C]10% type I error level[/C][C]20[/C][C]0.833333333333333[/C][C]NOK[/C][/ROW]
[/TABLE]
Source: https://freestatistics.org/blog/index.php?pk=58503&T=6

Globally Unique Identifier (entire table): ba.freestatistics.org/blog/index.php?pk=58503&T=6

As an alternative you can also use a QR Code:  

The GUIDs for individual cells are displayed in the table below:

Meta Analysis of Goldfeld-Quandt test for Heteroskedasticity
Description# significant tests% significant testsOK/NOK
1% type I error level110.458333333333333NOK
5% type I error level160.666666666666667NOK
10% type I error level200.833333333333333NOK


Parameters (Session):
Parameters (R input):
par1 = 1 ; par2 = Do not include Seasonal Dummies ; par3 = No Linear Trend ;
R code (references can be found in the software module):
library(lattice)
library(lmtest)
n25 <- 25 #minimum number of obs. for Goldfeld-Quandt test
par1 <- as.numeric(par1)
x <- t(y)
k <- length(x[1,])
n <- length(x[,1])
x1 <- cbind(x[,par1], x[,1:k!=par1])
mycolnames <- c(colnames(x)[par1], colnames(x)[1:k!=par1])
colnames(x1) <- mycolnames #colnames(x)[par1]
x <- x1
if (par3 == 'First Differences'){
x2 <- array(0, dim=c(n-1,k), dimnames=list(1:(n-1), paste('(1-B)',colnames(x),sep='')))
for (i in 1:n-1) {
for (j in 1:k) {
x2[i,j] <- x[i+1,j] - x[i,j]
}
}
x <- x2
}
if (par2 == 'Include Monthly Dummies'){
x2 <- array(0, dim=c(n,11), dimnames=list(1:n, paste('M', seq(1:11), sep ='')))
for (i in 1:11){
x2[seq(i,n,12),i] <- 1
}
x <- cbind(x, x2)
}
if (par2 == 'Include Quarterly Dummies'){
x2 <- array(0, dim=c(n,3), dimnames=list(1:n, paste('Q', seq(1:3), sep ='')))
for (i in 1:3){
x2[seq(i,n,4),i] <- 1
}
x <- cbind(x, x2)
}
k <- length(x[1,])
if (par3 == 'Linear Trend'){
x <- cbind(x, c(1:n))
colnames(x)[k+1] <- 't'
}
x
k <- length(x[1,])
df <- as.data.frame(x)
(mylm <- lm(df))
(mysum <- summary(mylm))
if (n > n25) {
kp3 <- k + 3
nmkm3 <- n - k - 3
gqarr <- array(NA, dim=c(nmkm3-kp3+1,3))
numgqtests <- 0
numsignificant1 <- 0
numsignificant5 <- 0
numsignificant10 <- 0
for (mypoint in kp3:nmkm3) {
j <- 0
numgqtests <- numgqtests + 1
for (myalt in c('greater', 'two.sided', 'less')) {
j <- j + 1
gqarr[mypoint-kp3+1,j] <- gqtest(mylm, point=mypoint, alternative=myalt)$p.value
}
if (gqarr[mypoint-kp3+1,2] < 0.01) numsignificant1 <- numsignificant1 + 1
if (gqarr[mypoint-kp3+1,2] < 0.05) numsignificant5 <- numsignificant5 + 1
if (gqarr[mypoint-kp3+1,2] < 0.10) numsignificant10 <- numsignificant10 + 1
}
gqarr
}
bitmap(file='test0.png')
plot(x[,1], type='l', main='Actuals and Interpolation', ylab='value of Actuals and Interpolation (dots)', xlab='time or index')
points(x[,1]-mysum$resid)
grid()
dev.off()
bitmap(file='test1.png')
plot(mysum$resid, type='b', pch=19, main='Residuals', ylab='value of Residuals', xlab='time or index')
grid()
dev.off()
bitmap(file='test2.png')
hist(mysum$resid, main='Residual Histogram', xlab='values of Residuals')
grid()
dev.off()
bitmap(file='test3.png')
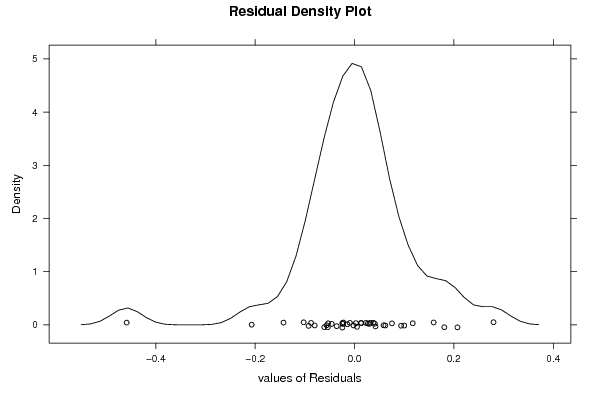
densityplot(~mysum$resid,col='black',main='Residual Density Plot', xlab='values of Residuals')
dev.off()
bitmap(file='test4.png')
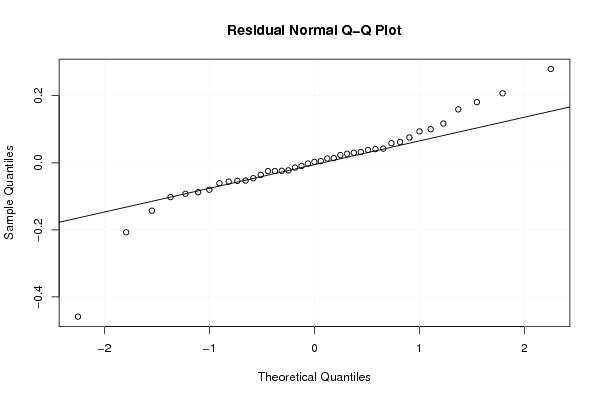
qqnorm(mysum$resid, main='Residual Normal Q-Q Plot')
qqline(mysum$resid)
grid()
dev.off()
(myerror <- as.ts(mysum$resid))
bitmap(file='test5.png')
dum <- cbind(lag(myerror,k=1),myerror)
dum
dum1 <- dum[2:length(myerror),]
dum1
z <- as.data.frame(dum1)
z
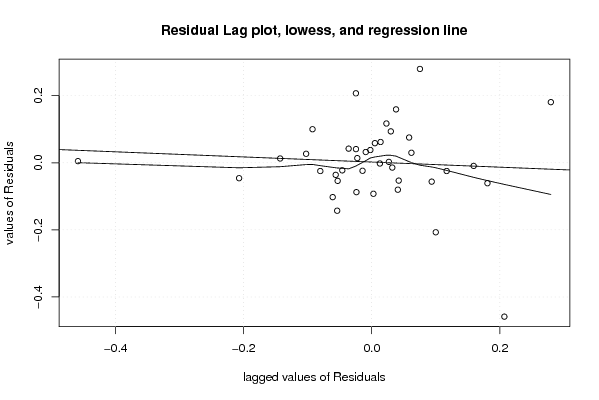
plot(z,main=paste('Residual Lag plot, lowess, and regression line'), ylab='values of Residuals', xlab='lagged values of Residuals')
lines(lowess(z))
abline(lm(z))
grid()
dev.off()
bitmap(file='test6.png')
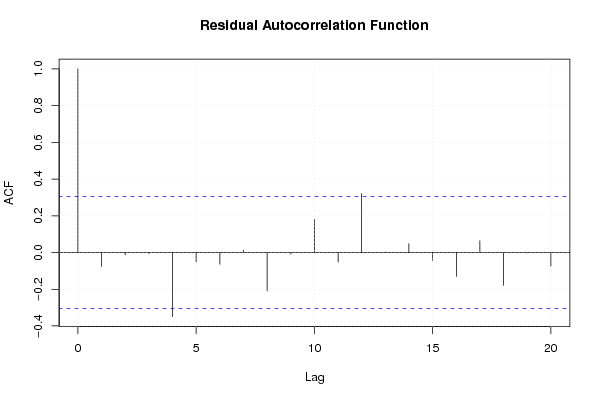
acf(mysum$resid, lag.max=length(mysum$resid)/2, main='Residual Autocorrelation Function')
grid()
dev.off()
bitmap(file='test7.png')
pacf(mysum$resid, lag.max=length(mysum$resid)/2, main='Residual Partial Autocorrelation Function')
grid()
dev.off()
bitmap(file='test8.png')
opar <- par(mfrow = c(2,2), oma = c(0, 0, 1.1, 0))
plot(mylm, las = 1, sub='Residual Diagnostics')
par(opar)
dev.off()
if (n > n25) {
bitmap(file='test9.png')
plot(kp3:nmkm3,gqarr[,2], main='Goldfeld-Quandt test',ylab='2-sided p-value',xlab='breakpoint')
grid()
dev.off()
}
load(file='createtable')
a<-table.start()
a<-table.row.start(a)
a<-table.element(a, 'Multiple Linear Regression - Estimated Regression Equation', 1, TRUE)
a<-table.row.end(a)
myeq <- colnames(x)[1]
myeq <- paste(myeq, '[t] = ', sep='')
for (i in 1:k){
if (mysum$coefficients[i,1] > 0) myeq <- paste(myeq, '+', '')
myeq <- paste(myeq, mysum$coefficients[i,1], sep=' ')
if (rownames(mysum$coefficients)[i] != '(Intercept)') {
myeq <- paste(myeq, rownames(mysum$coefficients)[i], sep='')
if (rownames(mysum$coefficients)[i] != 't') myeq <- paste(myeq, '[t]', sep='')
}
}
myeq <- paste(myeq, ' + e[t]')
a<-table.row.start(a)
a<-table.element(a, myeq)
a<-table.row.end(a)
a<-table.end(a)
table.save(a,file='mytable1.tab')
a<-table.start()
a<-table.row.start(a)
a<-table.element(a,hyperlink('ols1.htm','Multiple Linear Regression - Ordinary Least Squares',''), 6, TRUE)
a<-table.row.end(a)
a<-table.row.start(a)
a<-table.element(a,'Variable',header=TRUE)
a<-table.element(a,'Parameter',header=TRUE)
a<-table.element(a,'S.D.',header=TRUE)
a<-table.element(a,'T-STAT
H0: parameter = 0',header=TRUE)
a<-table.element(a,'2-tail p-value',header=TRUE)
a<-table.element(a,'1-tail p-value',header=TRUE)
a<-table.row.end(a)
for (i in 1:k){
a<-table.row.start(a)
a<-table.element(a,rownames(mysum$coefficients)[i],header=TRUE)
a<-table.element(a,mysum$coefficients[i,1])
a<-table.element(a, round(mysum$coefficients[i,2],6))
a<-table.element(a, round(mysum$coefficients[i,3],4))
a<-table.element(a, round(mysum$coefficients[i,4],6))
a<-table.element(a, round(mysum$coefficients[i,4]/2,6))
a<-table.row.end(a)
}
a<-table.end(a)
table.save(a,file='mytable2.tab')
a<-table.start()
a<-table.row.start(a)
a<-table.element(a, 'Multiple Linear Regression - Regression Statistics', 2, TRUE)
a<-table.row.end(a)
a<-table.row.start(a)
a<-table.element(a, 'Multiple R',1,TRUE)
a<-table.element(a, sqrt(mysum$r.squared))
a<-table.row.end(a)
a<-table.row.start(a)
a<-table.element(a, 'R-squared',1,TRUE)
a<-table.element(a, mysum$r.squared)
a<-table.row.end(a)
a<-table.row.start(a)
a<-table.element(a, 'Adjusted R-squared',1,TRUE)
a<-table.element(a, mysum$adj.r.squared)
a<-table.row.end(a)
a<-table.row.start(a)
a<-table.element(a, 'F-TEST (value)',1,TRUE)
a<-table.element(a, mysum$fstatistic[1])
a<-table.row.end(a)
a<-table.row.start(a)
a<-table.element(a, 'F-TEST (DF numerator)',1,TRUE)
a<-table.element(a, mysum$fstatistic[2])
a<-table.row.end(a)
a<-table.row.start(a)
a<-table.element(a, 'F-TEST (DF denominator)',1,TRUE)
a<-table.element(a, mysum$fstatistic[3])
a<-table.row.end(a)
a<-table.row.start(a)
a<-table.element(a, 'p-value',1,TRUE)
a<-table.element(a, 1-pf(mysum$fstatistic[1],mysum$fstatistic[2],mysum$fstatistic[3]))
a<-table.row.end(a)
a<-table.row.start(a)
a<-table.element(a, 'Multiple Linear Regression - Residual Statistics', 2, TRUE)
a<-table.row.end(a)
a<-table.row.start(a)
a<-table.element(a, 'Residual Standard Deviation',1,TRUE)
a<-table.element(a, mysum$sigma)
a<-table.row.end(a)
a<-table.row.start(a)
a<-table.element(a, 'Sum Squared Residuals',1,TRUE)
a<-table.element(a, sum(myerror*myerror))
a<-table.row.end(a)
a<-table.end(a)
table.save(a,file='mytable3.tab')
a<-table.start()
a<-table.row.start(a)
a<-table.element(a, 'Multiple Linear Regression - Actuals, Interpolation, and Residuals', 4, TRUE)
a<-table.row.end(a)
a<-table.row.start(a)
a<-table.element(a, 'Time or Index', 1, TRUE)
a<-table.element(a, 'Actuals', 1, TRUE)
a<-table.element(a, 'Interpolation
Forecast', 1, TRUE)
a<-table.element(a, 'Residuals
Prediction Error', 1, TRUE)
a<-table.row.end(a)
for (i in 1:n) {
a<-table.row.start(a)
a<-table.element(a,i, 1, TRUE)
a<-table.element(a,x[i])
a<-table.element(a,x[i]-mysum$resid[i])
a<-table.element(a,mysum$resid[i])
a<-table.row.end(a)
}
a<-table.end(a)
table.save(a,file='mytable4.tab')
if (n > n25) {
a<-table.start()
a<-table.row.start(a)
a<-table.element(a,'Goldfeld-Quandt test for Heteroskedasticity',4,TRUE)
a<-table.row.end(a)
a<-table.row.start(a)
a<-table.element(a,'p-values',header=TRUE)
a<-table.element(a,'Alternative Hypothesis',3,header=TRUE)
a<-table.row.end(a)
a<-table.row.start(a)
a<-table.element(a,'breakpoint index',header=TRUE)
a<-table.element(a,'greater',header=TRUE)
a<-table.element(a,'2-sided',header=TRUE)
a<-table.element(a,'less',header=TRUE)
a<-table.row.end(a)
for (mypoint in kp3:nmkm3) {
a<-table.row.start(a)
a<-table.element(a,mypoint,header=TRUE)
a<-table.element(a,gqarr[mypoint-kp3+1,1])
a<-table.element(a,gqarr[mypoint-kp3+1,2])
a<-table.element(a,gqarr[mypoint-kp3+1,3])
a<-table.row.end(a)
}
a<-table.end(a)
table.save(a,file='mytable5.tab')
a<-table.start()
a<-table.row.start(a)
a<-table.element(a,'Meta Analysis of Goldfeld-Quandt test for Heteroskedasticity',4,TRUE)
a<-table.row.end(a)
a<-table.row.start(a)
a<-table.element(a,'Description',header=TRUE)
a<-table.element(a,'# significant tests',header=TRUE)
a<-table.element(a,'% significant tests',header=TRUE)
a<-table.element(a,'OK/NOK',header=TRUE)
a<-table.row.end(a)
a<-table.row.start(a)
a<-table.element(a,'1% type I error level',header=TRUE)
a<-table.element(a,numsignificant1)
a<-table.element(a,numsignificant1/numgqtests)
if (numsignificant1/numgqtests < 0.01) dum <- 'OK' else dum <- 'NOK'
a<-table.element(a,dum)
a<-table.row.end(a)
a<-table.row.start(a)
a<-table.element(a,'5% type I error level',header=TRUE)
a<-table.element(a,numsignificant5)
a<-table.element(a,numsignificant5/numgqtests)
if (numsignificant5/numgqtests < 0.05) dum <- 'OK' else dum <- 'NOK'
a<-table.element(a,dum)
a<-table.row.end(a)
a<-table.row.start(a)
a<-table.element(a,'10% type I error level',header=TRUE)
a<-table.element(a,numsignificant10)
a<-table.element(a,numsignificant10/numgqtests)
if (numsignificant10/numgqtests < 0.1) dum <- 'OK' else dum <- 'NOK'
a<-table.element(a,dum)
a<-table.row.end(a)
a<-table.end(a)
table.save(a,file='mytable6.tab')
}