Free Statistics

of Irreproducible Research!

Author's title

Author*The author of this computation has been verified*
R Software Modulerwasp_multipleregression.wasp
Title produced by softwareMultiple Regression
Date of computationFri, 20 Nov 2009 17:35:27 -0700
Cite this page as followsStatistical Computations at FreeStatistics.org, Office for Research Development and Education, URL https://freestatistics.org/blog/index.php?v=date/2009/Nov/21/t1258763780kpaniovcu4bg4cl.htm/, Retrieved Sun, 28 Apr 2024 07:47:46 +0000
Statistical Computations at FreeStatistics.org, Office for Research Development and Education, URL https://freestatistics.org/blog/index.php?pk=58505, Retrieved Sun, 28 Apr 2024 07:47:46 +0000
QR Codes:

Original text written by user:
IsPrivate?No (this computation is public)
User-defined keywords
Estimated Impact107
Family? (F = Feedback message, R = changed R code, M = changed R Module, P = changed Parameters, D = changed Data)
-     [Multiple Regression] [Q1 The Seatbeltlaw] [2007-11-14 19:27:43] [8cd6641b921d30ebe00b648d1481bba0]
- RMPD  [Multiple Regression] [Seatbelt] [2009-11-12 13:54:52] [b98453cac15ba1066b407e146608df68]
-   PD      [Multiple Regression] [Model 4] [2009-11-21 00:35:27] [7d2d29a9bcbcfc0ea3924e19a42d8563] [Current]
Feedback Forum

Post a new message
Dataseries X:
117.33	102.7	111.1	107.47	103.86	104.08
119.04	103.1	117.33	111.1	107.47	103.86
123.68	100	119.04	117.33	111.1	107.47
125.9	107.2	123.68	119.04	117.33	111.1
124.54	107	125.9	123.68	119.04	117.33
119.39	119	124.54	125.9	123.68	119.04
118.8	110.4	119.39	124.54	125.9	123.68
114.81	101.7	118.8	119.39	124.54	125.9
117.9	102.4	114.81	118.8	119.39	124.54
120.53	98.8	117.9	114.81	118.8	119.39
125.15	105.6	120.53	117.9	114.81	118.8
126.49	104.4	125.15	120.53	117.9	114.81
131.85	106.3	126.49	125.15	120.53	117.9
127.4	107.2	131.85	126.49	125.15	120.53
131.08	108.5	127.4	131.85	126.49	125.15
122.37	106.9	131.08	127.4	131.85	126.49
124.34	114.2	122.37	131.08	127.4	131.85
119.61	125.9	124.34	122.37	131.08	127.4
119.97	110.6	119.61	124.34	122.37	131.08
116.46	110.5	119.97	119.61	124.34	122.37
117.03	106.7	116.46	119.97	119.61	124.34
120.96	104.7	117.03	116.46	119.97	119.61
124.71	107.4	120.96	117.03	116.46	119.97
127.08	109.8	124.71	120.96	117.03	116.46
131.91	103.4	127.08	124.71	120.96	117.03
137.69	114.8	131.91	127.08	124.71	120.96
142.46	114.3	137.69	131.91	127.08	124.71
144.32	109.6	142.46	137.69	131.91	127.08
138.06	118.3	144.32	142.46	137.69	131.91
124.45	127.3	138.06	144.32	142.46	137.69
126.71	112.3	124.45	138.06	144.32	142.46
121.83	114.9	126.71	124.45	138.06	144.32
122.51	108.2	121.83	126.71	124.45	138.06
125.48	105.4	122.51	121.83	126.71	124.45
127.77	122.1	125.48	122.51	121.83	126.71
128.03	113.5	127.77	125.48	122.51	121.83
132.84	110	128.03	127.77	125.48	122.51
133.41	125.3	132.84	128.03	127.77	125.48
139.99	114.3	133.41	132.84	128.03	127.77
138.53	115.6	139.99	133.41	132.84	128.03
136.12	127.1	138.53	139.99	133.41	132.84
124.75	123	136.12	138.53	139.99	133.41
122.88	122.2	124.75	136.12	138.53	139.99
121.46	126.4	122.88	124.75	136.12	138.53
118.4	112.7	121.46	122.88	124.75	136.12
122.45	105.8	118.4	121.46	122.88	124.75
128.94	120.9	122.45	118.4	121.46	122.88
133.25	116.3	128.94	122.45	118.4	121.46
137.94	115.7	133.25	128.94	122.45	118.4
140.04	127.9	137.94	133.25	128.94	122.45
130.74	108.3	140.04	137.94	133.25	128.94
131.55	121.1	130.74	140.04	137.94	133.25
129.47	128.6	131.55	130.74	140.04	137.94
125.45	123.1	129.47	131.55	130.74	140.04
127.87	127.7	125.45	129.47	131.55	130.74
124.68	126.6	127.87	125.45	129.47	131.55


Summary of computational transaction
Raw Inputview raw input (R code)
Raw Outputview raw output of R engine
Computing time3 seconds
R Server'Gwilym Jenkins' @ 72.249.127.135

\begin{tabular}{lllllllll}
\hline
Summary of computational transaction \tabularnewline
Raw Input & view raw input (R code)  \tabularnewline
Raw Output & view raw output of R engine  \tabularnewline
Computing time & 3 seconds \tabularnewline
R Server & 'Gwilym Jenkins' @ 72.249.127.135 \tabularnewline
\hline
\end{tabular}
%Source: https://freestatistics.org/blog/index.php?pk=58505&T=0

[TABLE]
[ROW][C]Summary of computational transaction[/C][/ROW]
[ROW][C]Raw Input[/C][C]view raw input (R code) [/C][/ROW]
[ROW][C]Raw Output[/C][C]view raw output of R engine [/C][/ROW]
[ROW][C]Computing time[/C][C]3 seconds[/C][/ROW]
[ROW][C]R Server[/C][C]'Gwilym Jenkins' @ 72.249.127.135[/C][/ROW]
[/TABLE]
Source: https://freestatistics.org/blog/index.php?pk=58505&T=0

Globally Unique Identifier (entire table): ba.freestatistics.org/blog/index.php?pk=58505&T=0

As an alternative you can also use a QR Code:  

The GUIDs for individual cells are displayed in the table below:

Summary of computational transaction
Raw Inputview raw input (R code)
Raw Outputview raw output of R engine
Computing time3 seconds
R Server'Gwilym Jenkins' @ 72.249.127.135


Multiple Linear Regression - Estimated Regression Equation
Y[t] = + 10.8562216284785 + 0.264895487886645X[t] + 0.741179769060709Y1[t] + 0.169868749827528Y2[t] -0.362243934241926Y3[t] + 0.152135238199125Y4[t] + 3.65823272078654M1[t] -0.440463601056253M2[t] + 1.91915658338744M3[t] -0.108805188726336M4[t] -3.88665101019026M5[t] -10.5879834879979M6[t] -2.76413230559056M7[t] -5.59498712522036M8[t] -3.68967115962482M9[t] + 2.44620732778347M10[t] + 0.210606343946619M11[t] -0.0384352271612887t + e[t]

\begin{tabular}{lllllllll}
\hline
Multiple Linear Regression - Estimated Regression Equation \tabularnewline
Y[t] =  +  10.8562216284785 +  0.264895487886645X[t] +  0.741179769060709Y1[t] +  0.169868749827528Y2[t] -0.362243934241926Y3[t] +  0.152135238199125Y4[t] +  3.65823272078654M1[t] -0.440463601056253M2[t] +  1.91915658338744M3[t] -0.108805188726336M4[t] -3.88665101019026M5[t] -10.5879834879979M6[t] -2.76413230559056M7[t] -5.59498712522036M8[t] -3.68967115962482M9[t] +  2.44620732778347M10[t] +  0.210606343946619M11[t] -0.0384352271612887t  + e[t] \tabularnewline
\hline
\end{tabular}
%Source: https://freestatistics.org/blog/index.php?pk=58505&T=1

[TABLE]
[ROW][C]Multiple Linear Regression - Estimated Regression Equation[/C][/ROW]
[ROW][C]Y[t] =  +  10.8562216284785 +  0.264895487886645X[t] +  0.741179769060709Y1[t] +  0.169868749827528Y2[t] -0.362243934241926Y3[t] +  0.152135238199125Y4[t] +  3.65823272078654M1[t] -0.440463601056253M2[t] +  1.91915658338744M3[t] -0.108805188726336M4[t] -3.88665101019026M5[t] -10.5879834879979M6[t] -2.76413230559056M7[t] -5.59498712522036M8[t] -3.68967115962482M9[t] +  2.44620732778347M10[t] +  0.210606343946619M11[t] -0.0384352271612887t  + e[t][/C][/ROW]
[/TABLE]
Source: https://freestatistics.org/blog/index.php?pk=58505&T=1

Globally Unique Identifier (entire table): ba.freestatistics.org/blog/index.php?pk=58505&T=1

As an alternative you can also use a QR Code:  

The GUIDs for individual cells are displayed in the table below:

Multiple Linear Regression - Estimated Regression Equation
Y[t] = + 10.8562216284785 + 0.264895487886645X[t] + 0.741179769060709Y1[t] + 0.169868749827528Y2[t] -0.362243934241926Y3[t] + 0.152135238199125Y4[t] + 3.65823272078654M1[t] -0.440463601056253M2[t] + 1.91915658338744M3[t] -0.108805188726336M4[t] -3.88665101019026M5[t] -10.5879834879979M6[t] -2.76413230559056M7[t] -5.59498712522036M8[t] -3.68967115962482M9[t] + 2.44620732778347M10[t] + 0.210606343946619M11[t] -0.0384352271612887t + e[t]


Multiple Linear Regression - Ordinary Least Squares
VariableParameterS.D.T-STATH0: parameter = 02-tail p-value1-tail p-value
(Intercept)10.856221628478517.6676740.61450.5425680.271284
X0.2648954878866450.1135582.33270.0250610.01253
Y10.7411797690607090.1504474.92651.7e-058e-06
Y20.1698687498275280.183570.92540.3606170.180308
Y3-0.3622439342419260.186675-1.94050.0597640.029882
Y40.1521352381991250.1506341.010.3188980.159449
M13.658232720786542.010091.81990.0766530.038327
M2-0.4404636010562532.124443-0.20730.8368580.418429
M31.919156583387442.1026950.91270.3671480.183574
M4-0.1088051887263362.226024-0.04890.9612720.480636
M5-3.886651010190262.480063-1.56720.1253680.062684
M6-10.58798348799792.742863-3.86020.0004270.000213
M7-2.764132305590562.771267-0.99740.3248670.162434
M8-5.594987125220362.634212-2.1240.040240.02012
M9-3.689671159624822.691172-1.3710.178410.089205
M102.446207327783472.5189230.97110.3376240.168812
M110.2106063439466192.2091320.09530.924550.462275
t-0.03843522716128870.055337-0.69460.4915550.245778

\begin{tabular}{lllllllll}
\hline
Multiple Linear Regression - Ordinary Least Squares \tabularnewline
Variable & Parameter & S.D. & T-STATH0: parameter = 0 & 2-tail p-value & 1-tail p-value \tabularnewline
(Intercept) & 10.8562216284785 & 17.667674 & 0.6145 & 0.542568 & 0.271284 \tabularnewline
X & 0.264895487886645 & 0.113558 & 2.3327 & 0.025061 & 0.01253 \tabularnewline
Y1 & 0.741179769060709 & 0.150447 & 4.9265 & 1.7e-05 & 8e-06 \tabularnewline
Y2 & 0.169868749827528 & 0.18357 & 0.9254 & 0.360617 & 0.180308 \tabularnewline
Y3 & -0.362243934241926 & 0.186675 & -1.9405 & 0.059764 & 0.029882 \tabularnewline
Y4 & 0.152135238199125 & 0.150634 & 1.01 & 0.318898 & 0.159449 \tabularnewline
M1 & 3.65823272078654 & 2.01009 & 1.8199 & 0.076653 & 0.038327 \tabularnewline
M2 & -0.440463601056253 & 2.124443 & -0.2073 & 0.836858 & 0.418429 \tabularnewline
M3 & 1.91915658338744 & 2.102695 & 0.9127 & 0.367148 & 0.183574 \tabularnewline
M4 & -0.108805188726336 & 2.226024 & -0.0489 & 0.961272 & 0.480636 \tabularnewline
M5 & -3.88665101019026 & 2.480063 & -1.5672 & 0.125368 & 0.062684 \tabularnewline
M6 & -10.5879834879979 & 2.742863 & -3.8602 & 0.000427 & 0.000213 \tabularnewline
M7 & -2.76413230559056 & 2.771267 & -0.9974 & 0.324867 & 0.162434 \tabularnewline
M8 & -5.59498712522036 & 2.634212 & -2.124 & 0.04024 & 0.02012 \tabularnewline
M9 & -3.68967115962482 & 2.691172 & -1.371 & 0.17841 & 0.089205 \tabularnewline
M10 & 2.44620732778347 & 2.518923 & 0.9711 & 0.337624 & 0.168812 \tabularnewline
M11 & 0.210606343946619 & 2.209132 & 0.0953 & 0.92455 & 0.462275 \tabularnewline
t & -0.0384352271612887 & 0.055337 & -0.6946 & 0.491555 & 0.245778 \tabularnewline
\hline
\end{tabular}
%Source: https://freestatistics.org/blog/index.php?pk=58505&T=2

[TABLE]
[ROW][C]Multiple Linear Regression - Ordinary Least Squares[/C][/ROW]
[ROW][C]Variable[/C][C]Parameter[/C][C]S.D.[/C][C]T-STATH0: parameter = 0[/C][C]2-tail p-value[/C][C]1-tail p-value[/C][/ROW]
[ROW][C](Intercept)[/C][C]10.8562216284785[/C][C]17.667674[/C][C]0.6145[/C][C]0.542568[/C][C]0.271284[/C][/ROW]
[ROW][C]X[/C][C]0.264895487886645[/C][C]0.113558[/C][C]2.3327[/C][C]0.025061[/C][C]0.01253[/C][/ROW]
[ROW][C]Y1[/C][C]0.741179769060709[/C][C]0.150447[/C][C]4.9265[/C][C]1.7e-05[/C][C]8e-06[/C][/ROW]
[ROW][C]Y2[/C][C]0.169868749827528[/C][C]0.18357[/C][C]0.9254[/C][C]0.360617[/C][C]0.180308[/C][/ROW]
[ROW][C]Y3[/C][C]-0.362243934241926[/C][C]0.186675[/C][C]-1.9405[/C][C]0.059764[/C][C]0.029882[/C][/ROW]
[ROW][C]Y4[/C][C]0.152135238199125[/C][C]0.150634[/C][C]1.01[/C][C]0.318898[/C][C]0.159449[/C][/ROW]
[ROW][C]M1[/C][C]3.65823272078654[/C][C]2.01009[/C][C]1.8199[/C][C]0.076653[/C][C]0.038327[/C][/ROW]
[ROW][C]M2[/C][C]-0.440463601056253[/C][C]2.124443[/C][C]-0.2073[/C][C]0.836858[/C][C]0.418429[/C][/ROW]
[ROW][C]M3[/C][C]1.91915658338744[/C][C]2.102695[/C][C]0.9127[/C][C]0.367148[/C][C]0.183574[/C][/ROW]
[ROW][C]M4[/C][C]-0.108805188726336[/C][C]2.226024[/C][C]-0.0489[/C][C]0.961272[/C][C]0.480636[/C][/ROW]
[ROW][C]M5[/C][C]-3.88665101019026[/C][C]2.480063[/C][C]-1.5672[/C][C]0.125368[/C][C]0.062684[/C][/ROW]
[ROW][C]M6[/C][C]-10.5879834879979[/C][C]2.742863[/C][C]-3.8602[/C][C]0.000427[/C][C]0.000213[/C][/ROW]
[ROW][C]M7[/C][C]-2.76413230559056[/C][C]2.771267[/C][C]-0.9974[/C][C]0.324867[/C][C]0.162434[/C][/ROW]
[ROW][C]M8[/C][C]-5.59498712522036[/C][C]2.634212[/C][C]-2.124[/C][C]0.04024[/C][C]0.02012[/C][/ROW]
[ROW][C]M9[/C][C]-3.68967115962482[/C][C]2.691172[/C][C]-1.371[/C][C]0.17841[/C][C]0.089205[/C][/ROW]
[ROW][C]M10[/C][C]2.44620732778347[/C][C]2.518923[/C][C]0.9711[/C][C]0.337624[/C][C]0.168812[/C][/ROW]
[ROW][C]M11[/C][C]0.210606343946619[/C][C]2.209132[/C][C]0.0953[/C][C]0.92455[/C][C]0.462275[/C][/ROW]
[ROW][C]t[/C][C]-0.0384352271612887[/C][C]0.055337[/C][C]-0.6946[/C][C]0.491555[/C][C]0.245778[/C][/ROW]
[/TABLE]
Source: https://freestatistics.org/blog/index.php?pk=58505&T=2

Globally Unique Identifier (entire table): ba.freestatistics.org/blog/index.php?pk=58505&T=2

As an alternative you can also use a QR Code:  

The GUIDs for individual cells are displayed in the table below:

Multiple Linear Regression - Ordinary Least Squares
VariableParameterS.D.T-STATH0: parameter = 02-tail p-value1-tail p-value
(Intercept)10.856221628478517.6676740.61450.5425680.271284
X0.2648954878866450.1135582.33270.0250610.01253
Y10.7411797690607090.1504474.92651.7e-058e-06
Y20.1698687498275280.183570.92540.3606170.180308
Y3-0.3622439342419260.186675-1.94050.0597640.029882
Y40.1521352381991250.1506341.010.3188980.159449
M13.658232720786542.010091.81990.0766530.038327
M2-0.4404636010562532.124443-0.20730.8368580.418429
M31.919156583387442.1026950.91270.3671480.183574
M4-0.1088051887263362.226024-0.04890.9612720.480636
M5-3.886651010190262.480063-1.56720.1253680.062684
M6-10.58798348799792.742863-3.86020.0004270.000213
M7-2.764132305590562.771267-0.99740.3248670.162434
M8-5.594987125220362.634212-2.1240.040240.02012
M9-3.689671159624822.691172-1.3710.178410.089205
M102.446207327783472.5189230.97110.3376240.168812
M110.2106063439466192.2091320.09530.924550.462275
t-0.03843522716128870.055337-0.69460.4915550.245778


Multiple Linear Regression - Regression Statistics
Multiple R0.942325551080884
R-squared0.88797744421989
Adjusted R-squared0.837862090318263
F-TEST (value)17.7186705288546
F-TEST (DF numerator)17
F-TEST (DF denominator)38
p-value4.54636328584002e-13
Multiple Linear Regression - Residual Statistics
Residual Standard Deviation2.89784985699467
Sum Squared Residuals319.106284159994

\begin{tabular}{lllllllll}
\hline
Multiple Linear Regression - Regression Statistics \tabularnewline
Multiple R & 0.942325551080884 \tabularnewline
R-squared & 0.88797744421989 \tabularnewline
Adjusted R-squared & 0.837862090318263 \tabularnewline
F-TEST (value) & 17.7186705288546 \tabularnewline
F-TEST (DF numerator) & 17 \tabularnewline
F-TEST (DF denominator) & 38 \tabularnewline
p-value & 4.54636328584002e-13 \tabularnewline
Multiple Linear Regression - Residual Statistics \tabularnewline
Residual Standard Deviation & 2.89784985699467 \tabularnewline
Sum Squared Residuals & 319.106284159994 \tabularnewline
\hline
\end{tabular}
%Source: https://freestatistics.org/blog/index.php?pk=58505&T=3

[TABLE]
[ROW][C]Multiple Linear Regression - Regression Statistics[/C][/ROW]
[ROW][C]Multiple R[/C][C]0.942325551080884[/C][/ROW]
[ROW][C]R-squared[/C][C]0.88797744421989[/C][/ROW]
[ROW][C]Adjusted R-squared[/C][C]0.837862090318263[/C][/ROW]
[ROW][C]F-TEST (value)[/C][C]17.7186705288546[/C][/ROW]
[ROW][C]F-TEST (DF numerator)[/C][C]17[/C][/ROW]
[ROW][C]F-TEST (DF denominator)[/C][C]38[/C][/ROW]
[ROW][C]p-value[/C][C]4.54636328584002e-13[/C][/ROW]
[ROW][C]Multiple Linear Regression - Residual Statistics[/C][/ROW]
[ROW][C]Residual Standard Deviation[/C][C]2.89784985699467[/C][/ROW]
[ROW][C]Sum Squared Residuals[/C][C]319.106284159994[/C][/ROW]
[/TABLE]
Source: https://freestatistics.org/blog/index.php?pk=58505&T=3

Globally Unique Identifier (entire table): ba.freestatistics.org/blog/index.php?pk=58505&T=3

As an alternative you can also use a QR Code:  

The GUIDs for individual cells are displayed in the table below:

Multiple Linear Regression - Regression Statistics
Multiple R0.942325551080884
R-squared0.88797744421989
Adjusted R-squared0.837862090318263
F-TEST (value)17.7186705288546
F-TEST (DF numerator)17
F-TEST (DF denominator)38
p-value4.54636328584002e-13
Multiple Linear Regression - Residual Statistics
Residual Standard Deviation2.89784985699467
Sum Squared Residuals319.106284159994


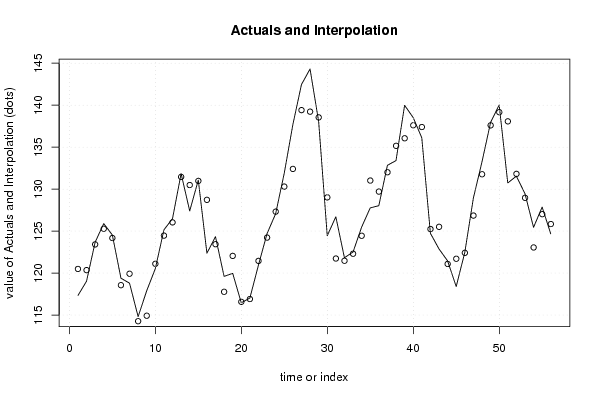
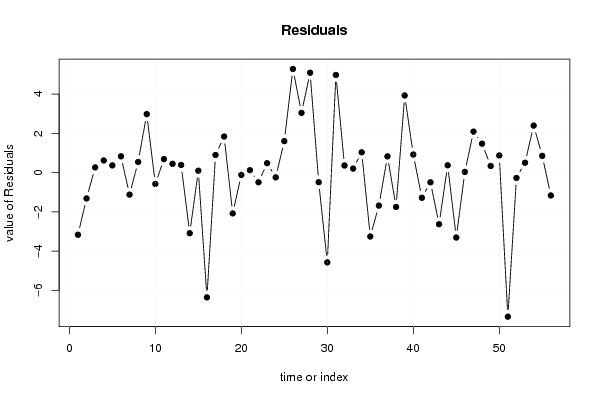
Multiple Linear Regression - Actuals, Interpolation, and Residuals
Time or IndexActualsInterpolationForecastResidualsPrediction Error
1117.33120.49323319607-3.16323319606985
2119.04120.355063010325-1.31506301032531
3123.68123.4150344002790.264965599720899
4125.9125.2809058087700.619094191229748
5124.54124.1736211555090.366378844490938
6119.39118.5610428463120.82895715368763
7118.8119.921986266532-1.12198626653208
8114.81114.2663773291410.543622670859355
9117.9114.9198074055402.9801925944598
10120.53121.106323528458-0.576323528458282
11125.15124.4633673717740.68663262822615
12126.49126.0411032030870.448896796913206
13131.85131.4595729774200.390427022579776
14127.4130.487743754714-3.08774375471440
15131.08130.9829973016010.0970026983993924
16122.37128.726626866768-6.35662686676795
17124.34123.4409544746860.899045525314365
18119.61117.7709718240461.83902817595413
19119.97122.047350287949-2.07735028794931
20116.46116.576197747376-0.116197747376233
21117.03116.9092076205930.120792379407362
22120.96121.453085568527-0.493085568527386
23124.71124.2301737495740.479826250425689
24127.08127.323415941597-0.243415941597359
25131.91130.3045846014781.60541539852207
26137.69132.4092255687515.2807744312486
27142.46139.4144369280223.04556307197832
28144.32139.2312223202465.08877767975448
29138.06138.549443583948-0.489443583947765
30124.45129.021343900775-4.57134390077473
31126.71121.7344038754044.97559612459558
32121.83121.4676132614480.362386738552028
33122.51122.3044136865420.205586313458251
34125.48124.4459604412321.03403955876774
35127.77131.024069579365-3.25406957936475
36128.03129.709992832872-1.67999283287222
37132.84132.0119497732320.828050226768081
38133.41135.159262801068-1.74926280106808
39139.99136.0603448192053.92965518079453
40138.53137.6092618602320.920738139767675
41136.12137.40018428656-1.28018428655992
42124.75125.243245461533-0.493245461532842
43122.88125.510073376508-2.63007337650847
44121.46121.0868209589110.373179041088917
45118.4121.706571287325-3.30657128732542
46122.45122.4146304617820.0353695382179322
47128.94126.8523892992872.08761070071291
48133.25131.7754880224441.47451197755637
49137.94137.60065945180.339340548199918
50140.04139.1687048651410.871295134859192
51130.74138.077186550893-7.33718655089314
52131.55131.821983143984-0.271983143983962
53129.47128.9657964992980.50420350070238
54125.45123.0533959673342.39660403266581
55127.87127.0161861936060.85381380639428
56124.68125.842990703124-1.16299070312407

\begin{tabular}{lllllllll}
\hline
Multiple Linear Regression - Actuals, Interpolation, and Residuals \tabularnewline
Time or Index & Actuals & InterpolationForecast & ResidualsPrediction Error \tabularnewline
1 & 117.33 & 120.49323319607 & -3.16323319606985 \tabularnewline
2 & 119.04 & 120.355063010325 & -1.31506301032531 \tabularnewline
3 & 123.68 & 123.415034400279 & 0.264965599720899 \tabularnewline
4 & 125.9 & 125.280905808770 & 0.619094191229748 \tabularnewline
5 & 124.54 & 124.173621155509 & 0.366378844490938 \tabularnewline
6 & 119.39 & 118.561042846312 & 0.82895715368763 \tabularnewline
7 & 118.8 & 119.921986266532 & -1.12198626653208 \tabularnewline
8 & 114.81 & 114.266377329141 & 0.543622670859355 \tabularnewline
9 & 117.9 & 114.919807405540 & 2.9801925944598 \tabularnewline
10 & 120.53 & 121.106323528458 & -0.576323528458282 \tabularnewline
11 & 125.15 & 124.463367371774 & 0.68663262822615 \tabularnewline
12 & 126.49 & 126.041103203087 & 0.448896796913206 \tabularnewline
13 & 131.85 & 131.459572977420 & 0.390427022579776 \tabularnewline
14 & 127.4 & 130.487743754714 & -3.08774375471440 \tabularnewline
15 & 131.08 & 130.982997301601 & 0.0970026983993924 \tabularnewline
16 & 122.37 & 128.726626866768 & -6.35662686676795 \tabularnewline
17 & 124.34 & 123.440954474686 & 0.899045525314365 \tabularnewline
18 & 119.61 & 117.770971824046 & 1.83902817595413 \tabularnewline
19 & 119.97 & 122.047350287949 & -2.07735028794931 \tabularnewline
20 & 116.46 & 116.576197747376 & -0.116197747376233 \tabularnewline
21 & 117.03 & 116.909207620593 & 0.120792379407362 \tabularnewline
22 & 120.96 & 121.453085568527 & -0.493085568527386 \tabularnewline
23 & 124.71 & 124.230173749574 & 0.479826250425689 \tabularnewline
24 & 127.08 & 127.323415941597 & -0.243415941597359 \tabularnewline
25 & 131.91 & 130.304584601478 & 1.60541539852207 \tabularnewline
26 & 137.69 & 132.409225568751 & 5.2807744312486 \tabularnewline
27 & 142.46 & 139.414436928022 & 3.04556307197832 \tabularnewline
28 & 144.32 & 139.231222320246 & 5.08877767975448 \tabularnewline
29 & 138.06 & 138.549443583948 & -0.489443583947765 \tabularnewline
30 & 124.45 & 129.021343900775 & -4.57134390077473 \tabularnewline
31 & 126.71 & 121.734403875404 & 4.97559612459558 \tabularnewline
32 & 121.83 & 121.467613261448 & 0.362386738552028 \tabularnewline
33 & 122.51 & 122.304413686542 & 0.205586313458251 \tabularnewline
34 & 125.48 & 124.445960441232 & 1.03403955876774 \tabularnewline
35 & 127.77 & 131.024069579365 & -3.25406957936475 \tabularnewline
36 & 128.03 & 129.709992832872 & -1.67999283287222 \tabularnewline
37 & 132.84 & 132.011949773232 & 0.828050226768081 \tabularnewline
38 & 133.41 & 135.159262801068 & -1.74926280106808 \tabularnewline
39 & 139.99 & 136.060344819205 & 3.92965518079453 \tabularnewline
40 & 138.53 & 137.609261860232 & 0.920738139767675 \tabularnewline
41 & 136.12 & 137.40018428656 & -1.28018428655992 \tabularnewline
42 & 124.75 & 125.243245461533 & -0.493245461532842 \tabularnewline
43 & 122.88 & 125.510073376508 & -2.63007337650847 \tabularnewline
44 & 121.46 & 121.086820958911 & 0.373179041088917 \tabularnewline
45 & 118.4 & 121.706571287325 & -3.30657128732542 \tabularnewline
46 & 122.45 & 122.414630461782 & 0.0353695382179322 \tabularnewline
47 & 128.94 & 126.852389299287 & 2.08761070071291 \tabularnewline
48 & 133.25 & 131.775488022444 & 1.47451197755637 \tabularnewline
49 & 137.94 & 137.6006594518 & 0.339340548199918 \tabularnewline
50 & 140.04 & 139.168704865141 & 0.871295134859192 \tabularnewline
51 & 130.74 & 138.077186550893 & -7.33718655089314 \tabularnewline
52 & 131.55 & 131.821983143984 & -0.271983143983962 \tabularnewline
53 & 129.47 & 128.965796499298 & 0.50420350070238 \tabularnewline
54 & 125.45 & 123.053395967334 & 2.39660403266581 \tabularnewline
55 & 127.87 & 127.016186193606 & 0.85381380639428 \tabularnewline
56 & 124.68 & 125.842990703124 & -1.16299070312407 \tabularnewline
\hline
\end{tabular}
%Source: https://freestatistics.org/blog/index.php?pk=58505&T=4

[TABLE]
[ROW][C]Multiple Linear Regression - Actuals, Interpolation, and Residuals[/C][/ROW]
[ROW][C]Time or Index[/C][C]Actuals[/C][C]InterpolationForecast[/C][C]ResidualsPrediction Error[/C][/ROW]
[ROW][C]1[/C][C]117.33[/C][C]120.49323319607[/C][C]-3.16323319606985[/C][/ROW]
[ROW][C]2[/C][C]119.04[/C][C]120.355063010325[/C][C]-1.31506301032531[/C][/ROW]
[ROW][C]3[/C][C]123.68[/C][C]123.415034400279[/C][C]0.264965599720899[/C][/ROW]
[ROW][C]4[/C][C]125.9[/C][C]125.280905808770[/C][C]0.619094191229748[/C][/ROW]
[ROW][C]5[/C][C]124.54[/C][C]124.173621155509[/C][C]0.366378844490938[/C][/ROW]
[ROW][C]6[/C][C]119.39[/C][C]118.561042846312[/C][C]0.82895715368763[/C][/ROW]
[ROW][C]7[/C][C]118.8[/C][C]119.921986266532[/C][C]-1.12198626653208[/C][/ROW]
[ROW][C]8[/C][C]114.81[/C][C]114.266377329141[/C][C]0.543622670859355[/C][/ROW]
[ROW][C]9[/C][C]117.9[/C][C]114.919807405540[/C][C]2.9801925944598[/C][/ROW]
[ROW][C]10[/C][C]120.53[/C][C]121.106323528458[/C][C]-0.576323528458282[/C][/ROW]
[ROW][C]11[/C][C]125.15[/C][C]124.463367371774[/C][C]0.68663262822615[/C][/ROW]
[ROW][C]12[/C][C]126.49[/C][C]126.041103203087[/C][C]0.448896796913206[/C][/ROW]
[ROW][C]13[/C][C]131.85[/C][C]131.459572977420[/C][C]0.390427022579776[/C][/ROW]
[ROW][C]14[/C][C]127.4[/C][C]130.487743754714[/C][C]-3.08774375471440[/C][/ROW]
[ROW][C]15[/C][C]131.08[/C][C]130.982997301601[/C][C]0.0970026983993924[/C][/ROW]
[ROW][C]16[/C][C]122.37[/C][C]128.726626866768[/C][C]-6.35662686676795[/C][/ROW]
[ROW][C]17[/C][C]124.34[/C][C]123.440954474686[/C][C]0.899045525314365[/C][/ROW]
[ROW][C]18[/C][C]119.61[/C][C]117.770971824046[/C][C]1.83902817595413[/C][/ROW]
[ROW][C]19[/C][C]119.97[/C][C]122.047350287949[/C][C]-2.07735028794931[/C][/ROW]
[ROW][C]20[/C][C]116.46[/C][C]116.576197747376[/C][C]-0.116197747376233[/C][/ROW]
[ROW][C]21[/C][C]117.03[/C][C]116.909207620593[/C][C]0.120792379407362[/C][/ROW]
[ROW][C]22[/C][C]120.96[/C][C]121.453085568527[/C][C]-0.493085568527386[/C][/ROW]
[ROW][C]23[/C][C]124.71[/C][C]124.230173749574[/C][C]0.479826250425689[/C][/ROW]
[ROW][C]24[/C][C]127.08[/C][C]127.323415941597[/C][C]-0.243415941597359[/C][/ROW]
[ROW][C]25[/C][C]131.91[/C][C]130.304584601478[/C][C]1.60541539852207[/C][/ROW]
[ROW][C]26[/C][C]137.69[/C][C]132.409225568751[/C][C]5.2807744312486[/C][/ROW]
[ROW][C]27[/C][C]142.46[/C][C]139.414436928022[/C][C]3.04556307197832[/C][/ROW]
[ROW][C]28[/C][C]144.32[/C][C]139.231222320246[/C][C]5.08877767975448[/C][/ROW]
[ROW][C]29[/C][C]138.06[/C][C]138.549443583948[/C][C]-0.489443583947765[/C][/ROW]
[ROW][C]30[/C][C]124.45[/C][C]129.021343900775[/C][C]-4.57134390077473[/C][/ROW]
[ROW][C]31[/C][C]126.71[/C][C]121.734403875404[/C][C]4.97559612459558[/C][/ROW]
[ROW][C]32[/C][C]121.83[/C][C]121.467613261448[/C][C]0.362386738552028[/C][/ROW]
[ROW][C]33[/C][C]122.51[/C][C]122.304413686542[/C][C]0.205586313458251[/C][/ROW]
[ROW][C]34[/C][C]125.48[/C][C]124.445960441232[/C][C]1.03403955876774[/C][/ROW]
[ROW][C]35[/C][C]127.77[/C][C]131.024069579365[/C][C]-3.25406957936475[/C][/ROW]
[ROW][C]36[/C][C]128.03[/C][C]129.709992832872[/C][C]-1.67999283287222[/C][/ROW]
[ROW][C]37[/C][C]132.84[/C][C]132.011949773232[/C][C]0.828050226768081[/C][/ROW]
[ROW][C]38[/C][C]133.41[/C][C]135.159262801068[/C][C]-1.74926280106808[/C][/ROW]
[ROW][C]39[/C][C]139.99[/C][C]136.060344819205[/C][C]3.92965518079453[/C][/ROW]
[ROW][C]40[/C][C]138.53[/C][C]137.609261860232[/C][C]0.920738139767675[/C][/ROW]
[ROW][C]41[/C][C]136.12[/C][C]137.40018428656[/C][C]-1.28018428655992[/C][/ROW]
[ROW][C]42[/C][C]124.75[/C][C]125.243245461533[/C][C]-0.493245461532842[/C][/ROW]
[ROW][C]43[/C][C]122.88[/C][C]125.510073376508[/C][C]-2.63007337650847[/C][/ROW]
[ROW][C]44[/C][C]121.46[/C][C]121.086820958911[/C][C]0.373179041088917[/C][/ROW]
[ROW][C]45[/C][C]118.4[/C][C]121.706571287325[/C][C]-3.30657128732542[/C][/ROW]
[ROW][C]46[/C][C]122.45[/C][C]122.414630461782[/C][C]0.0353695382179322[/C][/ROW]
[ROW][C]47[/C][C]128.94[/C][C]126.852389299287[/C][C]2.08761070071291[/C][/ROW]
[ROW][C]48[/C][C]133.25[/C][C]131.775488022444[/C][C]1.47451197755637[/C][/ROW]
[ROW][C]49[/C][C]137.94[/C][C]137.6006594518[/C][C]0.339340548199918[/C][/ROW]
[ROW][C]50[/C][C]140.04[/C][C]139.168704865141[/C][C]0.871295134859192[/C][/ROW]
[ROW][C]51[/C][C]130.74[/C][C]138.077186550893[/C][C]-7.33718655089314[/C][/ROW]
[ROW][C]52[/C][C]131.55[/C][C]131.821983143984[/C][C]-0.271983143983962[/C][/ROW]
[ROW][C]53[/C][C]129.47[/C][C]128.965796499298[/C][C]0.50420350070238[/C][/ROW]
[ROW][C]54[/C][C]125.45[/C][C]123.053395967334[/C][C]2.39660403266581[/C][/ROW]
[ROW][C]55[/C][C]127.87[/C][C]127.016186193606[/C][C]0.85381380639428[/C][/ROW]
[ROW][C]56[/C][C]124.68[/C][C]125.842990703124[/C][C]-1.16299070312407[/C][/ROW]
[/TABLE]
Source: https://freestatistics.org/blog/index.php?pk=58505&T=4

Globally Unique Identifier (entire table): ba.freestatistics.org/blog/index.php?pk=58505&T=4

As an alternative you can also use a QR Code:  

The GUIDs for individual cells are displayed in the table below:

Multiple Linear Regression - Actuals, Interpolation, and Residuals
Time or IndexActualsInterpolationForecastResidualsPrediction Error
1117.33120.49323319607-3.16323319606985
2119.04120.355063010325-1.31506301032531
3123.68123.4150344002790.264965599720899
4125.9125.2809058087700.619094191229748
5124.54124.1736211555090.366378844490938
6119.39118.5610428463120.82895715368763
7118.8119.921986266532-1.12198626653208
8114.81114.2663773291410.543622670859355
9117.9114.9198074055402.9801925944598
10120.53121.106323528458-0.576323528458282
11125.15124.4633673717740.68663262822615
12126.49126.0411032030870.448896796913206
13131.85131.4595729774200.390427022579776
14127.4130.487743754714-3.08774375471440
15131.08130.9829973016010.0970026983993924
16122.37128.726626866768-6.35662686676795
17124.34123.4409544746860.899045525314365
18119.61117.7709718240461.83902817595413
19119.97122.047350287949-2.07735028794931
20116.46116.576197747376-0.116197747376233
21117.03116.9092076205930.120792379407362
22120.96121.453085568527-0.493085568527386
23124.71124.2301737495740.479826250425689
24127.08127.323415941597-0.243415941597359
25131.91130.3045846014781.60541539852207
26137.69132.4092255687515.2807744312486
27142.46139.4144369280223.04556307197832
28144.32139.2312223202465.08877767975448
29138.06138.549443583948-0.489443583947765
30124.45129.021343900775-4.57134390077473
31126.71121.7344038754044.97559612459558
32121.83121.4676132614480.362386738552028
33122.51122.3044136865420.205586313458251
34125.48124.4459604412321.03403955876774
35127.77131.024069579365-3.25406957936475
36128.03129.709992832872-1.67999283287222
37132.84132.0119497732320.828050226768081
38133.41135.159262801068-1.74926280106808
39139.99136.0603448192053.92965518079453
40138.53137.6092618602320.920738139767675
41136.12137.40018428656-1.28018428655992
42124.75125.243245461533-0.493245461532842
43122.88125.510073376508-2.63007337650847
44121.46121.0868209589110.373179041088917
45118.4121.706571287325-3.30657128732542
46122.45122.4146304617820.0353695382179322
47128.94126.8523892992872.08761070071291
48133.25131.7754880224441.47451197755637
49137.94137.60065945180.339340548199918
50140.04139.1687048651410.871295134859192
51130.74138.077186550893-7.33718655089314
52131.55131.821983143984-0.271983143983962
53129.47128.9657964992980.50420350070238
54125.45123.0533959673342.39660403266581
55127.87127.0161861936060.85381380639428
56124.68125.842990703124-1.16299070312407


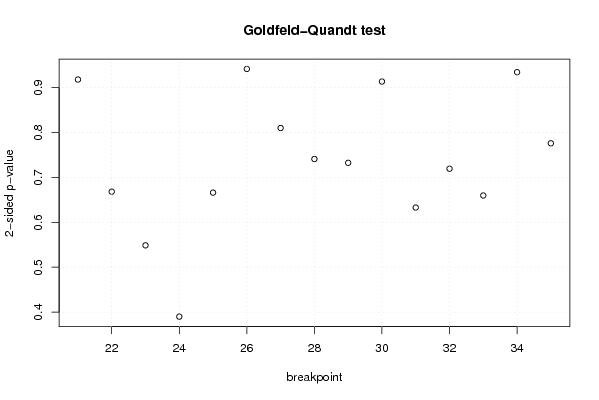
Goldfeld-Quandt test for Heteroskedasticity
p-valuesAlternative Hypothesis
breakpoint indexgreater2-sidedless
210.4589469408268290.9178938816536570.541053059173171
220.3341103690045070.6682207380090130.665889630995493
230.2743819334302080.5487638668604170.725618066569792
240.1950048480247540.3900096960495080.804995151975246
250.3330292507583800.6660585015167610.66697074924162
260.5292752546214960.9414494907570070.470724745378504
270.4049704724093530.8099409448187050.595029527590647
280.3704999730910570.7409999461821130.629500026908943
290.3662407768968760.7324815537937530.633759223103124
300.4567319315912660.9134638631825320.543268068408734
310.6835579244657050.632884151068590.316442075534295
320.6403571677465870.7192856645068260.359642832253413
330.6701342677677840.6597314644644320.329865732232216
340.5328653117118310.9342693765763380.467134688288169
350.6120266786955170.7759466426089660.387973321304483

\begin{tabular}{lllllllll}
\hline
Goldfeld-Quandt test for Heteroskedasticity \tabularnewline
p-values & Alternative Hypothesis \tabularnewline
breakpoint index & greater & 2-sided & less \tabularnewline
21 & 0.458946940826829 & 0.917893881653657 & 0.541053059173171 \tabularnewline
22 & 0.334110369004507 & 0.668220738009013 & 0.665889630995493 \tabularnewline
23 & 0.274381933430208 & 0.548763866860417 & 0.725618066569792 \tabularnewline
24 & 0.195004848024754 & 0.390009696049508 & 0.804995151975246 \tabularnewline
25 & 0.333029250758380 & 0.666058501516761 & 0.66697074924162 \tabularnewline
26 & 0.529275254621496 & 0.941449490757007 & 0.470724745378504 \tabularnewline
27 & 0.404970472409353 & 0.809940944818705 & 0.595029527590647 \tabularnewline
28 & 0.370499973091057 & 0.740999946182113 & 0.629500026908943 \tabularnewline
29 & 0.366240776896876 & 0.732481553793753 & 0.633759223103124 \tabularnewline
30 & 0.456731931591266 & 0.913463863182532 & 0.543268068408734 \tabularnewline
31 & 0.683557924465705 & 0.63288415106859 & 0.316442075534295 \tabularnewline
32 & 0.640357167746587 & 0.719285664506826 & 0.359642832253413 \tabularnewline
33 & 0.670134267767784 & 0.659731464464432 & 0.329865732232216 \tabularnewline
34 & 0.532865311711831 & 0.934269376576338 & 0.467134688288169 \tabularnewline
35 & 0.612026678695517 & 0.775946642608966 & 0.387973321304483 \tabularnewline
\hline
\end{tabular}
%Source: https://freestatistics.org/blog/index.php?pk=58505&T=5

[TABLE]
[ROW][C]Goldfeld-Quandt test for Heteroskedasticity[/C][/ROW]
[ROW][C]p-values[/C][C]Alternative Hypothesis[/C][/ROW]
[ROW][C]breakpoint index[/C][C]greater[/C][C]2-sided[/C][C]less[/C][/ROW]
[ROW][C]21[/C][C]0.458946940826829[/C][C]0.917893881653657[/C][C]0.541053059173171[/C][/ROW]
[ROW][C]22[/C][C]0.334110369004507[/C][C]0.668220738009013[/C][C]0.665889630995493[/C][/ROW]
[ROW][C]23[/C][C]0.274381933430208[/C][C]0.548763866860417[/C][C]0.725618066569792[/C][/ROW]
[ROW][C]24[/C][C]0.195004848024754[/C][C]0.390009696049508[/C][C]0.804995151975246[/C][/ROW]
[ROW][C]25[/C][C]0.333029250758380[/C][C]0.666058501516761[/C][C]0.66697074924162[/C][/ROW]
[ROW][C]26[/C][C]0.529275254621496[/C][C]0.941449490757007[/C][C]0.470724745378504[/C][/ROW]
[ROW][C]27[/C][C]0.404970472409353[/C][C]0.809940944818705[/C][C]0.595029527590647[/C][/ROW]
[ROW][C]28[/C][C]0.370499973091057[/C][C]0.740999946182113[/C][C]0.629500026908943[/C][/ROW]
[ROW][C]29[/C][C]0.366240776896876[/C][C]0.732481553793753[/C][C]0.633759223103124[/C][/ROW]
[ROW][C]30[/C][C]0.456731931591266[/C][C]0.913463863182532[/C][C]0.543268068408734[/C][/ROW]
[ROW][C]31[/C][C]0.683557924465705[/C][C]0.63288415106859[/C][C]0.316442075534295[/C][/ROW]
[ROW][C]32[/C][C]0.640357167746587[/C][C]0.719285664506826[/C][C]0.359642832253413[/C][/ROW]
[ROW][C]33[/C][C]0.670134267767784[/C][C]0.659731464464432[/C][C]0.329865732232216[/C][/ROW]
[ROW][C]34[/C][C]0.532865311711831[/C][C]0.934269376576338[/C][C]0.467134688288169[/C][/ROW]
[ROW][C]35[/C][C]0.612026678695517[/C][C]0.775946642608966[/C][C]0.387973321304483[/C][/ROW]
[/TABLE]
Source: https://freestatistics.org/blog/index.php?pk=58505&T=5

Globally Unique Identifier (entire table): ba.freestatistics.org/blog/index.php?pk=58505&T=5

As an alternative you can also use a QR Code:  

The GUIDs for individual cells are displayed in the table below:

Goldfeld-Quandt test for Heteroskedasticity
p-valuesAlternative Hypothesis
breakpoint indexgreater2-sidedless
210.4589469408268290.9178938816536570.541053059173171
220.3341103690045070.6682207380090130.665889630995493
230.2743819334302080.5487638668604170.725618066569792
240.1950048480247540.3900096960495080.804995151975246
250.3330292507583800.6660585015167610.66697074924162
260.5292752546214960.9414494907570070.470724745378504
270.4049704724093530.8099409448187050.595029527590647
280.3704999730910570.7409999461821130.629500026908943
290.3662407768968760.7324815537937530.633759223103124
300.4567319315912660.9134638631825320.543268068408734
310.6835579244657050.632884151068590.316442075534295
320.6403571677465870.7192856645068260.359642832253413
330.6701342677677840.6597314644644320.329865732232216
340.5328653117118310.9342693765763380.467134688288169
350.6120266786955170.7759466426089660.387973321304483


Meta Analysis of Goldfeld-Quandt test for Heteroskedasticity
Description# significant tests% significant testsOK/NOK
1% type I error level00OK
5% type I error level00OK
10% type I error level00OK

\begin{tabular}{lllllllll}
\hline
Meta Analysis of Goldfeld-Quandt test for Heteroskedasticity \tabularnewline
Description & # significant tests & % significant tests & OK/NOK \tabularnewline
1% type I error level & 0 & 0 & OK \tabularnewline
5% type I error level & 0 & 0 & OK \tabularnewline
10% type I error level & 0 & 0 & OK \tabularnewline
\hline
\end{tabular}
%Source: https://freestatistics.org/blog/index.php?pk=58505&T=6

[TABLE]
[ROW][C]Meta Analysis of Goldfeld-Quandt test for Heteroskedasticity[/C][/ROW]
[ROW][C]Description[/C][C]# significant tests[/C][C]% significant tests[/C][C]OK/NOK[/C][/ROW]
[ROW][C]1% type I error level[/C][C]0[/C][C]0[/C][C]OK[/C][/ROW]
[ROW][C]5% type I error level[/C][C]0[/C][C]0[/C][C]OK[/C][/ROW]
[ROW][C]10% type I error level[/C][C]0[/C][C]0[/C][C]OK[/C][/ROW]
[/TABLE]
Source: https://freestatistics.org/blog/index.php?pk=58505&T=6

Globally Unique Identifier (entire table): ba.freestatistics.org/blog/index.php?pk=58505&T=6

As an alternative you can also use a QR Code:  

The GUIDs for individual cells are displayed in the table below:

Meta Analysis of Goldfeld-Quandt test for Heteroskedasticity
Description# significant tests% significant testsOK/NOK
1% type I error level00OK
5% type I error level00OK
10% type I error level00OK


Parameters (Session):
par1 = 1 ; par2 = Include Monthly Dummies ; par3 = Linear Trend ;
Parameters (R input):
par1 = 1 ; par2 = Include Monthly Dummies ; par3 = Linear Trend ;
R code (references can be found in the software module):
library(lattice)
library(lmtest)
n25 <- 25 #minimum number of obs. for Goldfeld-Quandt test
par1 <- as.numeric(par1)
x <- t(y)
k <- length(x[1,])
n <- length(x[,1])
x1 <- cbind(x[,par1], x[,1:k!=par1])
mycolnames <- c(colnames(x)[par1], colnames(x)[1:k!=par1])
colnames(x1) <- mycolnames #colnames(x)[par1]
x <- x1
if (par3 == 'First Differences'){
x2 <- array(0, dim=c(n-1,k), dimnames=list(1:(n-1), paste('(1-B)',colnames(x),sep='')))
for (i in 1:n-1) {
for (j in 1:k) {
x2[i,j] <- x[i+1,j] - x[i,j]
}
}
x <- x2
}
if (par2 == 'Include Monthly Dummies'){
x2 <- array(0, dim=c(n,11), dimnames=list(1:n, paste('M', seq(1:11), sep ='')))
for (i in 1:11){
x2[seq(i,n,12),i] <- 1
}
x <- cbind(x, x2)
}
if (par2 == 'Include Quarterly Dummies'){
x2 <- array(0, dim=c(n,3), dimnames=list(1:n, paste('Q', seq(1:3), sep ='')))
for (i in 1:3){
x2[seq(i,n,4),i] <- 1
}
x <- cbind(x, x2)
}
k <- length(x[1,])
if (par3 == 'Linear Trend'){
x <- cbind(x, c(1:n))
colnames(x)[k+1] <- 't'
}
x
k <- length(x[1,])
df <- as.data.frame(x)
(mylm <- lm(df))
(mysum <- summary(mylm))
if (n > n25) {
kp3 <- k + 3
nmkm3 <- n - k - 3
gqarr <- array(NA, dim=c(nmkm3-kp3+1,3))
numgqtests <- 0
numsignificant1 <- 0
numsignificant5 <- 0
numsignificant10 <- 0
for (mypoint in kp3:nmkm3) {
j <- 0
numgqtests <- numgqtests + 1
for (myalt in c('greater', 'two.sided', 'less')) {
j <- j + 1
gqarr[mypoint-kp3+1,j] <- gqtest(mylm, point=mypoint, alternative=myalt)$p.value
}
if (gqarr[mypoint-kp3+1,2] < 0.01) numsignificant1 <- numsignificant1 + 1
if (gqarr[mypoint-kp3+1,2] < 0.05) numsignificant5 <- numsignificant5 + 1
if (gqarr[mypoint-kp3+1,2] < 0.10) numsignificant10 <- numsignificant10 + 1
}
gqarr
}
bitmap(file='test0.png')
plot(x[,1], type='l', main='Actuals and Interpolation', ylab='value of Actuals and Interpolation (dots)', xlab='time or index')
points(x[,1]-mysum$resid)
grid()
dev.off()
bitmap(file='test1.png')
plot(mysum$resid, type='b', pch=19, main='Residuals', ylab='value of Residuals', xlab='time or index')
grid()
dev.off()
bitmap(file='test2.png')
hist(mysum$resid, main='Residual Histogram', xlab='values of Residuals')
grid()
dev.off()
bitmap(file='test3.png')
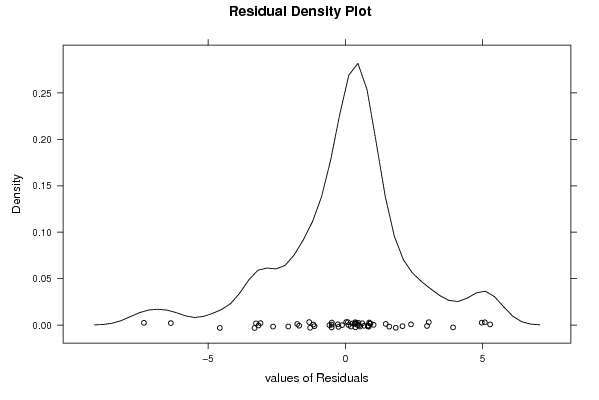
densityplot(~mysum$resid,col='black',main='Residual Density Plot', xlab='values of Residuals')
dev.off()
bitmap(file='test4.png')
qqnorm(mysum$resid, main='Residual Normal Q-Q Plot')
qqline(mysum$resid)
grid()
dev.off()
(myerror <- as.ts(mysum$resid))
bitmap(file='test5.png')
dum <- cbind(lag(myerror,k=1),myerror)
dum
dum1 <- dum[2:length(myerror),]
dum1
z <- as.data.frame(dum1)
z
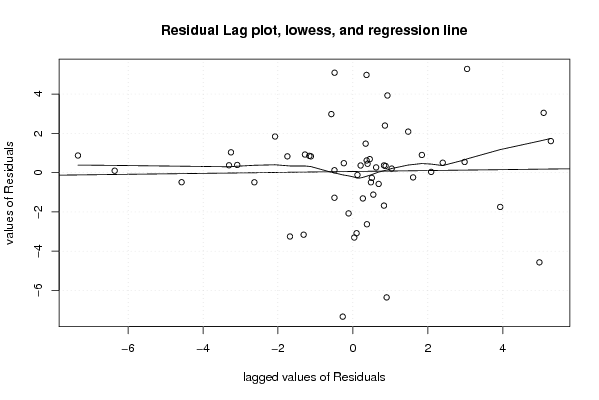
plot(z,main=paste('Residual Lag plot, lowess, and regression line'), ylab='values of Residuals', xlab='lagged values of Residuals')
lines(lowess(z))
abline(lm(z))
grid()
dev.off()
bitmap(file='test6.png')
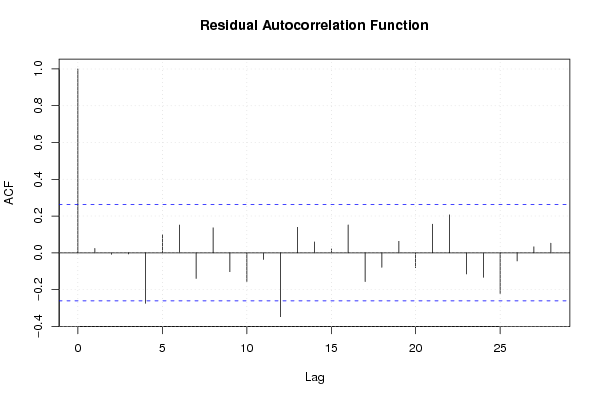
acf(mysum$resid, lag.max=length(mysum$resid)/2, main='Residual Autocorrelation Function')
grid()
dev.off()
bitmap(file='test7.png')
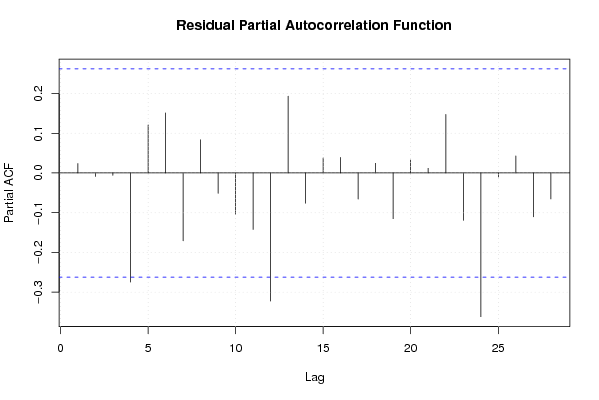
pacf(mysum$resid, lag.max=length(mysum$resid)/2, main='Residual Partial Autocorrelation Function')
grid()
dev.off()
bitmap(file='test8.png')
opar <- par(mfrow = c(2,2), oma = c(0, 0, 1.1, 0))
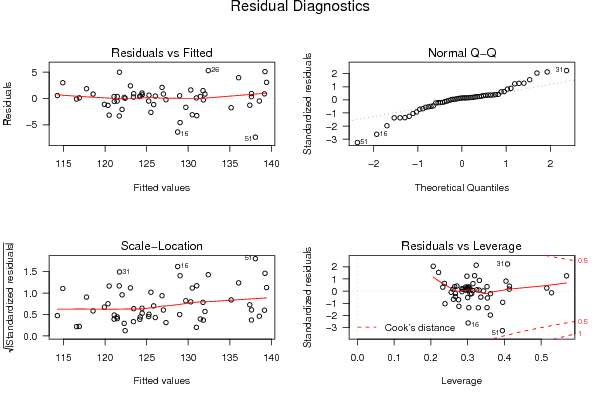
plot(mylm, las = 1, sub='Residual Diagnostics')
par(opar)
dev.off()
if (n > n25) {
bitmap(file='test9.png')
plot(kp3:nmkm3,gqarr[,2], main='Goldfeld-Quandt test',ylab='2-sided p-value',xlab='breakpoint')
grid()
dev.off()
}
load(file='createtable')
a<-table.start()
a<-table.row.start(a)
a<-table.element(a, 'Multiple Linear Regression - Estimated Regression Equation', 1, TRUE)
a<-table.row.end(a)
myeq <- colnames(x)[1]
myeq <- paste(myeq, '[t] = ', sep='')
for (i in 1:k){
if (mysum$coefficients[i,1] > 0) myeq <- paste(myeq, '+', '')
myeq <- paste(myeq, mysum$coefficients[i,1], sep=' ')
if (rownames(mysum$coefficients)[i] != '(Intercept)') {
myeq <- paste(myeq, rownames(mysum$coefficients)[i], sep='')
if (rownames(mysum$coefficients)[i] != 't') myeq <- paste(myeq, '[t]', sep='')
}
}
myeq <- paste(myeq, ' + e[t]')
a<-table.row.start(a)
a<-table.element(a, myeq)
a<-table.row.end(a)
a<-table.end(a)
table.save(a,file='mytable1.tab')
a<-table.start()
a<-table.row.start(a)
a<-table.element(a,hyperlink('ols1.htm','Multiple Linear Regression - Ordinary Least Squares',''), 6, TRUE)
a<-table.row.end(a)
a<-table.row.start(a)
a<-table.element(a,'Variable',header=TRUE)
a<-table.element(a,'Parameter',header=TRUE)
a<-table.element(a,'S.D.',header=TRUE)
a<-table.element(a,'T-STAT
H0: parameter = 0',header=TRUE)
a<-table.element(a,'2-tail p-value',header=TRUE)
a<-table.element(a,'1-tail p-value',header=TRUE)
a<-table.row.end(a)
for (i in 1:k){
a<-table.row.start(a)
a<-table.element(a,rownames(mysum$coefficients)[i],header=TRUE)
a<-table.element(a,mysum$coefficients[i,1])
a<-table.element(a, round(mysum$coefficients[i,2],6))
a<-table.element(a, round(mysum$coefficients[i,3],4))
a<-table.element(a, round(mysum$coefficients[i,4],6))
a<-table.element(a, round(mysum$coefficients[i,4]/2,6))
a<-table.row.end(a)
}
a<-table.end(a)
table.save(a,file='mytable2.tab')
a<-table.start()
a<-table.row.start(a)
a<-table.element(a, 'Multiple Linear Regression - Regression Statistics', 2, TRUE)
a<-table.row.end(a)
a<-table.row.start(a)
a<-table.element(a, 'Multiple R',1,TRUE)
a<-table.element(a, sqrt(mysum$r.squared))
a<-table.row.end(a)
a<-table.row.start(a)
a<-table.element(a, 'R-squared',1,TRUE)
a<-table.element(a, mysum$r.squared)
a<-table.row.end(a)
a<-table.row.start(a)
a<-table.element(a, 'Adjusted R-squared',1,TRUE)
a<-table.element(a, mysum$adj.r.squared)
a<-table.row.end(a)
a<-table.row.start(a)
a<-table.element(a, 'F-TEST (value)',1,TRUE)
a<-table.element(a, mysum$fstatistic[1])
a<-table.row.end(a)
a<-table.row.start(a)
a<-table.element(a, 'F-TEST (DF numerator)',1,TRUE)
a<-table.element(a, mysum$fstatistic[2])
a<-table.row.end(a)
a<-table.row.start(a)
a<-table.element(a, 'F-TEST (DF denominator)',1,TRUE)
a<-table.element(a, mysum$fstatistic[3])
a<-table.row.end(a)
a<-table.row.start(a)
a<-table.element(a, 'p-value',1,TRUE)
a<-table.element(a, 1-pf(mysum$fstatistic[1],mysum$fstatistic[2],mysum$fstatistic[3]))
a<-table.row.end(a)
a<-table.row.start(a)
a<-table.element(a, 'Multiple Linear Regression - Residual Statistics', 2, TRUE)
a<-table.row.end(a)
a<-table.row.start(a)
a<-table.element(a, 'Residual Standard Deviation',1,TRUE)
a<-table.element(a, mysum$sigma)
a<-table.row.end(a)
a<-table.row.start(a)
a<-table.element(a, 'Sum Squared Residuals',1,TRUE)
a<-table.element(a, sum(myerror*myerror))
a<-table.row.end(a)
a<-table.end(a)
table.save(a,file='mytable3.tab')
a<-table.start()
a<-table.row.start(a)
a<-table.element(a, 'Multiple Linear Regression - Actuals, Interpolation, and Residuals', 4, TRUE)
a<-table.row.end(a)
a<-table.row.start(a)
a<-table.element(a, 'Time or Index', 1, TRUE)
a<-table.element(a, 'Actuals', 1, TRUE)
a<-table.element(a, 'Interpolation
Forecast', 1, TRUE)
a<-table.element(a, 'Residuals
Prediction Error', 1, TRUE)
a<-table.row.end(a)
for (i in 1:n) {
a<-table.row.start(a)
a<-table.element(a,i, 1, TRUE)
a<-table.element(a,x[i])
a<-table.element(a,x[i]-mysum$resid[i])
a<-table.element(a,mysum$resid[i])
a<-table.row.end(a)
}
a<-table.end(a)
table.save(a,file='mytable4.tab')
if (n > n25) {
a<-table.start()
a<-table.row.start(a)
a<-table.element(a,'Goldfeld-Quandt test for Heteroskedasticity',4,TRUE)
a<-table.row.end(a)
a<-table.row.start(a)
a<-table.element(a,'p-values',header=TRUE)
a<-table.element(a,'Alternative Hypothesis',3,header=TRUE)
a<-table.row.end(a)
a<-table.row.start(a)
a<-table.element(a,'breakpoint index',header=TRUE)
a<-table.element(a,'greater',header=TRUE)
a<-table.element(a,'2-sided',header=TRUE)
a<-table.element(a,'less',header=TRUE)
a<-table.row.end(a)
for (mypoint in kp3:nmkm3) {
a<-table.row.start(a)
a<-table.element(a,mypoint,header=TRUE)
a<-table.element(a,gqarr[mypoint-kp3+1,1])
a<-table.element(a,gqarr[mypoint-kp3+1,2])
a<-table.element(a,gqarr[mypoint-kp3+1,3])
a<-table.row.end(a)
}
a<-table.end(a)
table.save(a,file='mytable5.tab')
a<-table.start()
a<-table.row.start(a)
a<-table.element(a,'Meta Analysis of Goldfeld-Quandt test for Heteroskedasticity',4,TRUE)
a<-table.row.end(a)
a<-table.row.start(a)
a<-table.element(a,'Description',header=TRUE)
a<-table.element(a,'# significant tests',header=TRUE)
a<-table.element(a,'% significant tests',header=TRUE)
a<-table.element(a,'OK/NOK',header=TRUE)
a<-table.row.end(a)
a<-table.row.start(a)
a<-table.element(a,'1% type I error level',header=TRUE)
a<-table.element(a,numsignificant1)
a<-table.element(a,numsignificant1/numgqtests)
if (numsignificant1/numgqtests < 0.01) dum <- 'OK' else dum <- 'NOK'
a<-table.element(a,dum)
a<-table.row.end(a)
a<-table.row.start(a)
a<-table.element(a,'5% type I error level',header=TRUE)
a<-table.element(a,numsignificant5)
a<-table.element(a,numsignificant5/numgqtests)
if (numsignificant5/numgqtests < 0.05) dum <- 'OK' else dum <- 'NOK'
a<-table.element(a,dum)
a<-table.row.end(a)
a<-table.row.start(a)
a<-table.element(a,'10% type I error level',header=TRUE)
a<-table.element(a,numsignificant10)
a<-table.element(a,numsignificant10/numgqtests)
if (numsignificant10/numgqtests < 0.1) dum <- 'OK' else dum <- 'NOK'
a<-table.element(a,dum)
a<-table.row.end(a)
a<-table.end(a)
table.save(a,file='mytable6.tab')
}