Free Statistics

of Irreproducible Research!

Author's title

Author*The author of this computation has been verified*
R Software Modulerwasp_multipleregression.wasp
Title produced by softwareMultiple Regression
Date of computationSat, 21 Nov 2009 00:14:01 -0700
Cite this page as followsStatistical Computations at FreeStatistics.org, Office for Research Development and Education, URL https://freestatistics.org/blog/index.php?v=date/2009/Nov/21/t1258787747m6ta4cb3acishbe.htm/, Retrieved Sat, 27 Apr 2024 18:07:48 +0000
Statistical Computations at FreeStatistics.org, Office for Research Development and Education, URL https://freestatistics.org/blog/index.php?pk=58510, Retrieved Sat, 27 Apr 2024 18:07:48 +0000
QR Codes:

Original text written by user:
IsPrivate?No (this computation is public)
User-defined keywords
Estimated Impact182
Family? (F = Feedback message, R = changed R code, M = changed R Module, P = changed Parameters, D = changed Data)
-       [Multiple Regression] [WS 7 Multiple Reg...] [2009-11-21 07:14:01] [762da55b2e2304daaed24a7cc507d14d] [Current]
Feedback Forum

Post a new message
Dataseries X:
83.4	108.8
113.6	128.4
112.9	121.1
104	119.5
109.9	128.7
99	108.7
106.3	105.5
128.9	119.8
111.1	111.3
102.9	110.6
130	120.1
87	97.5
87.5	107.7
117.6	127.3
103.4	117.2
110.8	119.8
112.6	116.2
102.5	111
112.4	112.4
135.6	130.6
105.1	109.1
127.7	118.8
137	123.9
91	101.6
90.5	112.8
122.4	128
123.3	129.6
124.3	125.8
120	119.5
118.1	115.7
119	113.6
142.7	129.7
123.6	112
129.6	116.8
151.6	127
110.4	112.1
99.2	114.2
130.5	121.1
136.2	131.6
129.7	125
128	120.4
121.6	117.7
135.8	117.5
143.8	120.6
147.5	127.5
136.2	112.3
156.6	124.5
123.3	115.2
104.5	104.7
139.8	130.9
136.5	129.2
112.1	113.5
118.5	125.6
94.4	107.6
102.3	107
111.4	121.6
99.2	110.7
87.8	106.3
115.8	118.6
79.7	104.6


Summary of computational transaction
Raw Inputview raw input (R code)
Raw Outputview raw output of R engine
Computing time4 seconds
R Server'Gwilym Jenkins' @ 72.249.127.135

\begin{tabular}{lllllllll}
\hline
Summary of computational transaction \tabularnewline
Raw Input & view raw input (R code)  \tabularnewline
Raw Output & view raw output of R engine  \tabularnewline
Computing time & 4 seconds \tabularnewline
R Server & 'Gwilym Jenkins' @ 72.249.127.135 \tabularnewline
\hline
\end{tabular}
%Source: https://freestatistics.org/blog/index.php?pk=58510&T=0

[TABLE]
[ROW][C]Summary of computational transaction[/C][/ROW]
[ROW][C]Raw Input[/C][C]view raw input (R code) [/C][/ROW]
[ROW][C]Raw Output[/C][C]view raw output of R engine [/C][/ROW]
[ROW][C]Computing time[/C][C]4 seconds[/C][/ROW]
[ROW][C]R Server[/C][C]'Gwilym Jenkins' @ 72.249.127.135[/C][/ROW]
[/TABLE]
Source: https://freestatistics.org/blog/index.php?pk=58510&T=0

Globally Unique Identifier (entire table): ba.freestatistics.org/blog/index.php?pk=58510&T=0

As an alternative you can also use a QR Code:  

The GUIDs for individual cells are displayed in the table below:

Summary of computational transaction
Raw Inputview raw input (R code)
Raw Outputview raw output of R engine
Computing time4 seconds
R Server'Gwilym Jenkins' @ 72.249.127.135


Multiple Linear Regression - Estimated Regression Equation
inv[t] = -100.311791928551 + 1.86997920836677cons[t] -11.6927284767817M1[t] -12.6573646232001M2[t] -12.3593937314866M3[t] -9.25209810548548M4[t] -10.1752698288643M5[t] -2.26767649769861M6[t] + 7.53010395816615M7[t] + 0.0541796552228235M8[t] + 4.20976466973519M9[t] + 5.91894055144064M10[t] + 8.84094555694431M11[t] + e[t]

\begin{tabular}{lllllllll}
\hline
Multiple Linear Regression - Estimated Regression Equation \tabularnewline
inv[t] =  -100.311791928551 +  1.86997920836677cons[t] -11.6927284767817M1[t] -12.6573646232001M2[t] -12.3593937314866M3[t] -9.25209810548548M4[t] -10.1752698288643M5[t] -2.26767649769861M6[t] +  7.53010395816615M7[t] +  0.0541796552228235M8[t] +  4.20976466973519M9[t] +  5.91894055144064M10[t] +  8.84094555694431M11[t]  + e[t] \tabularnewline
\hline
\end{tabular}
%Source: https://freestatistics.org/blog/index.php?pk=58510&T=1

[TABLE]
[ROW][C]Multiple Linear Regression - Estimated Regression Equation[/C][/ROW]
[ROW][C]inv[t] =  -100.311791928551 +  1.86997920836677cons[t] -11.6927284767817M1[t] -12.6573646232001M2[t] -12.3593937314866M3[t] -9.25209810548548M4[t] -10.1752698288643M5[t] -2.26767649769861M6[t] +  7.53010395816615M7[t] +  0.0541796552228235M8[t] +  4.20976466973519M9[t] +  5.91894055144064M10[t] +  8.84094555694431M11[t]  + e[t][/C][/ROW]
[/TABLE]
Source: https://freestatistics.org/blog/index.php?pk=58510&T=1

Globally Unique Identifier (entire table): ba.freestatistics.org/blog/index.php?pk=58510&T=1

As an alternative you can also use a QR Code:  

The GUIDs for individual cells are displayed in the table below:

Multiple Linear Regression - Estimated Regression Equation
inv[t] = -100.311791928551 + 1.86997920836677cons[t] -11.6927284767817M1[t] -12.6573646232001M2[t] -12.3593937314866M3[t] -9.25209810548548M4[t] -10.1752698288643M5[t] -2.26767649769861M6[t] + 7.53010395816615M7[t] + 0.0541796552228235M8[t] + 4.20976466973519M9[t] + 5.91894055144064M10[t] + 8.84094555694431M11[t] + e[t]


Multiple Linear Regression - Ordinary Least Squares
VariableParameterS.D.T-STATH0: parameter = 02-tail p-value1-tail p-value
(Intercept)-100.31179192855130.421899-3.29740.0018640.000932
cons1.869979208366770.2831126.605100
M1-11.69272847678176.628718-1.7640.084240.04212
M2-12.65736462320018.839514-1.43190.1587870.079394
M3-12.35939373148668.57873-1.44070.1562980.078149
M4-9.252098105485487.738864-1.19550.2378750.118937
M5-10.17526982886437.950085-1.27990.2068640.103432
M6-2.267676497698616.769009-0.3350.7391090.369555
M77.530103958166156.7078481.12260.2673170.133659
M80.05417965522282358.3496410.00650.994850.497425
M94.209764669735196.9295810.60750.5464390.27322
M105.918940551440646.8303880.86660.3905860.195293
M118.840945556944318.070411.09550.278890.139445

\begin{tabular}{lllllllll}
\hline
Multiple Linear Regression - Ordinary Least Squares \tabularnewline
Variable & Parameter & S.D. & T-STATH0: parameter = 0 & 2-tail p-value & 1-tail p-value \tabularnewline
(Intercept) & -100.311791928551 & 30.421899 & -3.2974 & 0.001864 & 0.000932 \tabularnewline
cons & 1.86997920836677 & 0.283112 & 6.6051 & 0 & 0 \tabularnewline
M1 & -11.6927284767817 & 6.628718 & -1.764 & 0.08424 & 0.04212 \tabularnewline
M2 & -12.6573646232001 & 8.839514 & -1.4319 & 0.158787 & 0.079394 \tabularnewline
M3 & -12.3593937314866 & 8.57873 & -1.4407 & 0.156298 & 0.078149 \tabularnewline
M4 & -9.25209810548548 & 7.738864 & -1.1955 & 0.237875 & 0.118937 \tabularnewline
M5 & -10.1752698288643 & 7.950085 & -1.2799 & 0.206864 & 0.103432 \tabularnewline
M6 & -2.26767649769861 & 6.769009 & -0.335 & 0.739109 & 0.369555 \tabularnewline
M7 & 7.53010395816615 & 6.707848 & 1.1226 & 0.267317 & 0.133659 \tabularnewline
M8 & 0.0541796552228235 & 8.349641 & 0.0065 & 0.99485 & 0.497425 \tabularnewline
M9 & 4.20976466973519 & 6.929581 & 0.6075 & 0.546439 & 0.27322 \tabularnewline
M10 & 5.91894055144064 & 6.830388 & 0.8666 & 0.390586 & 0.195293 \tabularnewline
M11 & 8.84094555694431 & 8.07041 & 1.0955 & 0.27889 & 0.139445 \tabularnewline
\hline
\end{tabular}
%Source: https://freestatistics.org/blog/index.php?pk=58510&T=2

[TABLE]
[ROW][C]Multiple Linear Regression - Ordinary Least Squares[/C][/ROW]
[ROW][C]Variable[/C][C]Parameter[/C][C]S.D.[/C][C]T-STATH0: parameter = 0[/C][C]2-tail p-value[/C][C]1-tail p-value[/C][/ROW]
[ROW][C](Intercept)[/C][C]-100.311791928551[/C][C]30.421899[/C][C]-3.2974[/C][C]0.001864[/C][C]0.000932[/C][/ROW]
[ROW][C]cons[/C][C]1.86997920836677[/C][C]0.283112[/C][C]6.6051[/C][C]0[/C][C]0[/C][/ROW]
[ROW][C]M1[/C][C]-11.6927284767817[/C][C]6.628718[/C][C]-1.764[/C][C]0.08424[/C][C]0.04212[/C][/ROW]
[ROW][C]M2[/C][C]-12.6573646232001[/C][C]8.839514[/C][C]-1.4319[/C][C]0.158787[/C][C]0.079394[/C][/ROW]
[ROW][C]M3[/C][C]-12.3593937314866[/C][C]8.57873[/C][C]-1.4407[/C][C]0.156298[/C][C]0.078149[/C][/ROW]
[ROW][C]M4[/C][C]-9.25209810548548[/C][C]7.738864[/C][C]-1.1955[/C][C]0.237875[/C][C]0.118937[/C][/ROW]
[ROW][C]M5[/C][C]-10.1752698288643[/C][C]7.950085[/C][C]-1.2799[/C][C]0.206864[/C][C]0.103432[/C][/ROW]
[ROW][C]M6[/C][C]-2.26767649769861[/C][C]6.769009[/C][C]-0.335[/C][C]0.739109[/C][C]0.369555[/C][/ROW]
[ROW][C]M7[/C][C]7.53010395816615[/C][C]6.707848[/C][C]1.1226[/C][C]0.267317[/C][C]0.133659[/C][/ROW]
[ROW][C]M8[/C][C]0.0541796552228235[/C][C]8.349641[/C][C]0.0065[/C][C]0.99485[/C][C]0.497425[/C][/ROW]
[ROW][C]M9[/C][C]4.20976466973519[/C][C]6.929581[/C][C]0.6075[/C][C]0.546439[/C][C]0.27322[/C][/ROW]
[ROW][C]M10[/C][C]5.91894055144064[/C][C]6.830388[/C][C]0.8666[/C][C]0.390586[/C][C]0.195293[/C][/ROW]
[ROW][C]M11[/C][C]8.84094555694431[/C][C]8.07041[/C][C]1.0955[/C][C]0.27889[/C][C]0.139445[/C][/ROW]
[/TABLE]
Source: https://freestatistics.org/blog/index.php?pk=58510&T=2

Globally Unique Identifier (entire table): ba.freestatistics.org/blog/index.php?pk=58510&T=2

As an alternative you can also use a QR Code:  

The GUIDs for individual cells are displayed in the table below:

Multiple Linear Regression - Ordinary Least Squares
VariableParameterS.D.T-STATH0: parameter = 02-tail p-value1-tail p-value
(Intercept)-100.31179192855130.421899-3.29740.0018640.000932
cons1.869979208366770.2831126.605100
M1-11.69272847678176.628718-1.7640.084240.04212
M2-12.65736462320018.839514-1.43190.1587870.079394
M3-12.35939373148668.57873-1.44070.1562980.078149
M4-9.252098105485487.738864-1.19550.2378750.118937
M5-10.17526982886437.950085-1.27990.2068640.103432
M6-2.267676497698616.769009-0.3350.7391090.369555
M77.530103958166156.7078481.12260.2673170.133659
M80.05417965522282358.3496410.00650.994850.497425
M94.209764669735196.9295810.60750.5464390.27322
M105.918940551440646.8303880.86660.3905860.195293
M118.840945556944318.070411.09550.278890.139445


Multiple Linear Regression - Regression Statistics
Multiple R0.854903900048446
R-squared0.730860678318043
Adjusted R-squared0.662144255760947
F-TEST (value)10.6358953379853
F-TEST (DF numerator)12
F-TEST (DF denominator)47
p-value9.79218484076227e-10
Multiple Linear Regression - Residual Statistics
Residual Standard Deviation10.3671854805278
Sum Squared Residuals5051.49113502033

\begin{tabular}{lllllllll}
\hline
Multiple Linear Regression - Regression Statistics \tabularnewline
Multiple R & 0.854903900048446 \tabularnewline
R-squared & 0.730860678318043 \tabularnewline
Adjusted R-squared & 0.662144255760947 \tabularnewline
F-TEST (value) & 10.6358953379853 \tabularnewline
F-TEST (DF numerator) & 12 \tabularnewline
F-TEST (DF denominator) & 47 \tabularnewline
p-value & 9.79218484076227e-10 \tabularnewline
Multiple Linear Regression - Residual Statistics \tabularnewline
Residual Standard Deviation & 10.3671854805278 \tabularnewline
Sum Squared Residuals & 5051.49113502033 \tabularnewline
\hline
\end{tabular}
%Source: https://freestatistics.org/blog/index.php?pk=58510&T=3

[TABLE]
[ROW][C]Multiple Linear Regression - Regression Statistics[/C][/ROW]
[ROW][C]Multiple R[/C][C]0.854903900048446[/C][/ROW]
[ROW][C]R-squared[/C][C]0.730860678318043[/C][/ROW]
[ROW][C]Adjusted R-squared[/C][C]0.662144255760947[/C][/ROW]
[ROW][C]F-TEST (value)[/C][C]10.6358953379853[/C][/ROW]
[ROW][C]F-TEST (DF numerator)[/C][C]12[/C][/ROW]
[ROW][C]F-TEST (DF denominator)[/C][C]47[/C][/ROW]
[ROW][C]p-value[/C][C]9.79218484076227e-10[/C][/ROW]
[ROW][C]Multiple Linear Regression - Residual Statistics[/C][/ROW]
[ROW][C]Residual Standard Deviation[/C][C]10.3671854805278[/C][/ROW]
[ROW][C]Sum Squared Residuals[/C][C]5051.49113502033[/C][/ROW]
[/TABLE]
Source: https://freestatistics.org/blog/index.php?pk=58510&T=3

Globally Unique Identifier (entire table): ba.freestatistics.org/blog/index.php?pk=58510&T=3

As an alternative you can also use a QR Code:  

The GUIDs for individual cells are displayed in the table below:

Multiple Linear Regression - Regression Statistics
Multiple R0.854903900048446
R-squared0.730860678318043
Adjusted R-squared0.662144255760947
F-TEST (value)10.6358953379853
F-TEST (DF numerator)12
F-TEST (DF denominator)47
p-value9.79218484076227e-10
Multiple Linear Regression - Residual Statistics
Residual Standard Deviation10.3671854805278
Sum Squared Residuals5051.49113502033


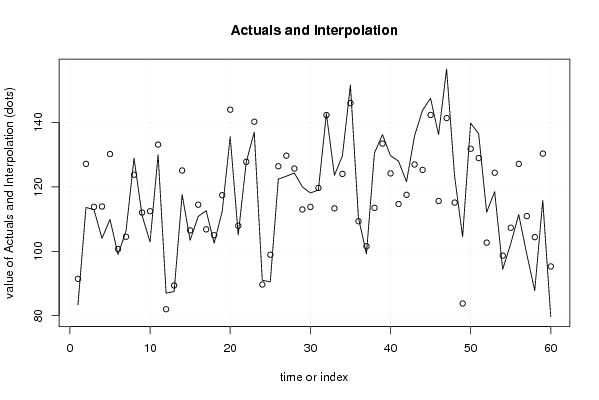
Multiple Linear Regression - Actuals, Interpolation, and Residuals
Time or IndexActualsInterpolationForecastResidualsPrediction Error
183.491.4492174649721-8.04921746497212
2113.6127.136173802542-13.5361738025421
3112.9113.783296473178-0.883296473178192
4104113.898625365793-9.89862536579254
5109.9130.179262359388-20.279262359388
699100.687271523218-1.68727152321832
7106.3104.5011185123091.79888148769056
8128.9123.7658968890115.13410311098914
9111.1112.026658632406-0.92665863240571
10102.9112.426849068254-9.52684906825442
11130133.113656553242-3.11365655324238
128782.01118088720914.98881911279087
1387.589.3922403357684-1.89224033576843
14117.6125.079196673339-7.4791966733387
15103.4106.490377560548-3.09037756054782
16110.8114.459619128303-3.65961912830257
17112.6106.8045222548035.79547774519658
18102.5104.988223702462-2.48822370246188
19112.4117.40397505004-5.00397505004013
20135.6143.961672339372-8.36167233937196
21105.1107.912704373999-2.81270437399882
22127.7127.760678576862-0.060678576861918
23137140.219577545036-3.21957754503612
249189.67809564151291.32190435848713
2590.598.929134298439-8.42913429843894
26122.4126.388182119195-3.98818211919543
27123.3129.678119744296-6.37811974429573
28124.3125.679494378503-1.37949437850318
29120112.9754536424147.02454635758626
30118.1113.7771259817864.32287401821429
31119119.647950100080-0.647950100080233
32142.7142.2786910518420.421308948158136
33123.6113.33564407826210.2643559217375
34129.6124.0207201601285.5792798398716
35151.6146.0165130909735.58348690902691
36110.4109.3128773293641.08712267063608
3799.2101.547105190152-2.34710519015241
38130.5113.48532558146517.0146744185353
39136.2133.4180781610292.78192183897073
40129.7124.1835110118105.51648898819022
41128114.65843492994413.3415650700562
42121.6117.5170843985194.08291560148076
43135.8126.9408690127118.85913098728938
44143.8125.26188025570418.5381197442957
45147.5142.3203218079475.17967819205265
46136.2115.60581372247820.5941862775221
47156.6141.34156507005615.2584349299438
48123.3115.1098128753018.19018712469907
49104.583.782302710668120.7176972893319
50139.8131.8111218234597.98887817654094
51136.5128.9301280609497.56987193905099
52112.1102.6787501155929.42124988440806
53118.5124.382326813451-5.88232681345101
5494.498.6302943940149-4.23029439401486
55102.3107.306087324860-5.00608732485958
56111.4127.131859464071-15.7318594640710
5799.2110.904671107386-11.7046711073857
5887.8104.385938472277-16.5859384722773
59115.8130.308687740692-14.5086877406922
6079.795.2880332666132-15.5880332666132

\begin{tabular}{lllllllll}
\hline
Multiple Linear Regression - Actuals, Interpolation, and Residuals \tabularnewline
Time or Index & Actuals & InterpolationForecast & ResidualsPrediction Error \tabularnewline
1 & 83.4 & 91.4492174649721 & -8.04921746497212 \tabularnewline
2 & 113.6 & 127.136173802542 & -13.5361738025421 \tabularnewline
3 & 112.9 & 113.783296473178 & -0.883296473178192 \tabularnewline
4 & 104 & 113.898625365793 & -9.89862536579254 \tabularnewline
5 & 109.9 & 130.179262359388 & -20.279262359388 \tabularnewline
6 & 99 & 100.687271523218 & -1.68727152321832 \tabularnewline
7 & 106.3 & 104.501118512309 & 1.79888148769056 \tabularnewline
8 & 128.9 & 123.765896889011 & 5.13410311098914 \tabularnewline
9 & 111.1 & 112.026658632406 & -0.92665863240571 \tabularnewline
10 & 102.9 & 112.426849068254 & -9.52684906825442 \tabularnewline
11 & 130 & 133.113656553242 & -3.11365655324238 \tabularnewline
12 & 87 & 82.0111808872091 & 4.98881911279087 \tabularnewline
13 & 87.5 & 89.3922403357684 & -1.89224033576843 \tabularnewline
14 & 117.6 & 125.079196673339 & -7.4791966733387 \tabularnewline
15 & 103.4 & 106.490377560548 & -3.09037756054782 \tabularnewline
16 & 110.8 & 114.459619128303 & -3.65961912830257 \tabularnewline
17 & 112.6 & 106.804522254803 & 5.79547774519658 \tabularnewline
18 & 102.5 & 104.988223702462 & -2.48822370246188 \tabularnewline
19 & 112.4 & 117.40397505004 & -5.00397505004013 \tabularnewline
20 & 135.6 & 143.961672339372 & -8.36167233937196 \tabularnewline
21 & 105.1 & 107.912704373999 & -2.81270437399882 \tabularnewline
22 & 127.7 & 127.760678576862 & -0.060678576861918 \tabularnewline
23 & 137 & 140.219577545036 & -3.21957754503612 \tabularnewline
24 & 91 & 89.6780956415129 & 1.32190435848713 \tabularnewline
25 & 90.5 & 98.929134298439 & -8.42913429843894 \tabularnewline
26 & 122.4 & 126.388182119195 & -3.98818211919543 \tabularnewline
27 & 123.3 & 129.678119744296 & -6.37811974429573 \tabularnewline
28 & 124.3 & 125.679494378503 & -1.37949437850318 \tabularnewline
29 & 120 & 112.975453642414 & 7.02454635758626 \tabularnewline
30 & 118.1 & 113.777125981786 & 4.32287401821429 \tabularnewline
31 & 119 & 119.647950100080 & -0.647950100080233 \tabularnewline
32 & 142.7 & 142.278691051842 & 0.421308948158136 \tabularnewline
33 & 123.6 & 113.335644078262 & 10.2643559217375 \tabularnewline
34 & 129.6 & 124.020720160128 & 5.5792798398716 \tabularnewline
35 & 151.6 & 146.016513090973 & 5.58348690902691 \tabularnewline
36 & 110.4 & 109.312877329364 & 1.08712267063608 \tabularnewline
37 & 99.2 & 101.547105190152 & -2.34710519015241 \tabularnewline
38 & 130.5 & 113.485325581465 & 17.0146744185353 \tabularnewline
39 & 136.2 & 133.418078161029 & 2.78192183897073 \tabularnewline
40 & 129.7 & 124.183511011810 & 5.51648898819022 \tabularnewline
41 & 128 & 114.658434929944 & 13.3415650700562 \tabularnewline
42 & 121.6 & 117.517084398519 & 4.08291560148076 \tabularnewline
43 & 135.8 & 126.940869012711 & 8.85913098728938 \tabularnewline
44 & 143.8 & 125.261880255704 & 18.5381197442957 \tabularnewline
45 & 147.5 & 142.320321807947 & 5.17967819205265 \tabularnewline
46 & 136.2 & 115.605813722478 & 20.5941862775221 \tabularnewline
47 & 156.6 & 141.341565070056 & 15.2584349299438 \tabularnewline
48 & 123.3 & 115.109812875301 & 8.19018712469907 \tabularnewline
49 & 104.5 & 83.7823027106681 & 20.7176972893319 \tabularnewline
50 & 139.8 & 131.811121823459 & 7.98887817654094 \tabularnewline
51 & 136.5 & 128.930128060949 & 7.56987193905099 \tabularnewline
52 & 112.1 & 102.678750115592 & 9.42124988440806 \tabularnewline
53 & 118.5 & 124.382326813451 & -5.88232681345101 \tabularnewline
54 & 94.4 & 98.6302943940149 & -4.23029439401486 \tabularnewline
55 & 102.3 & 107.306087324860 & -5.00608732485958 \tabularnewline
56 & 111.4 & 127.131859464071 & -15.7318594640710 \tabularnewline
57 & 99.2 & 110.904671107386 & -11.7046711073857 \tabularnewline
58 & 87.8 & 104.385938472277 & -16.5859384722773 \tabularnewline
59 & 115.8 & 130.308687740692 & -14.5086877406922 \tabularnewline
60 & 79.7 & 95.2880332666132 & -15.5880332666132 \tabularnewline
\hline
\end{tabular}
%Source: https://freestatistics.org/blog/index.php?pk=58510&T=4

[TABLE]
[ROW][C]Multiple Linear Regression - Actuals, Interpolation, and Residuals[/C][/ROW]
[ROW][C]Time or Index[/C][C]Actuals[/C][C]InterpolationForecast[/C][C]ResidualsPrediction Error[/C][/ROW]
[ROW][C]1[/C][C]83.4[/C][C]91.4492174649721[/C][C]-8.04921746497212[/C][/ROW]
[ROW][C]2[/C][C]113.6[/C][C]127.136173802542[/C][C]-13.5361738025421[/C][/ROW]
[ROW][C]3[/C][C]112.9[/C][C]113.783296473178[/C][C]-0.883296473178192[/C][/ROW]
[ROW][C]4[/C][C]104[/C][C]113.898625365793[/C][C]-9.89862536579254[/C][/ROW]
[ROW][C]5[/C][C]109.9[/C][C]130.179262359388[/C][C]-20.279262359388[/C][/ROW]
[ROW][C]6[/C][C]99[/C][C]100.687271523218[/C][C]-1.68727152321832[/C][/ROW]
[ROW][C]7[/C][C]106.3[/C][C]104.501118512309[/C][C]1.79888148769056[/C][/ROW]
[ROW][C]8[/C][C]128.9[/C][C]123.765896889011[/C][C]5.13410311098914[/C][/ROW]
[ROW][C]9[/C][C]111.1[/C][C]112.026658632406[/C][C]-0.92665863240571[/C][/ROW]
[ROW][C]10[/C][C]102.9[/C][C]112.426849068254[/C][C]-9.52684906825442[/C][/ROW]
[ROW][C]11[/C][C]130[/C][C]133.113656553242[/C][C]-3.11365655324238[/C][/ROW]
[ROW][C]12[/C][C]87[/C][C]82.0111808872091[/C][C]4.98881911279087[/C][/ROW]
[ROW][C]13[/C][C]87.5[/C][C]89.3922403357684[/C][C]-1.89224033576843[/C][/ROW]
[ROW][C]14[/C][C]117.6[/C][C]125.079196673339[/C][C]-7.4791966733387[/C][/ROW]
[ROW][C]15[/C][C]103.4[/C][C]106.490377560548[/C][C]-3.09037756054782[/C][/ROW]
[ROW][C]16[/C][C]110.8[/C][C]114.459619128303[/C][C]-3.65961912830257[/C][/ROW]
[ROW][C]17[/C][C]112.6[/C][C]106.804522254803[/C][C]5.79547774519658[/C][/ROW]
[ROW][C]18[/C][C]102.5[/C][C]104.988223702462[/C][C]-2.48822370246188[/C][/ROW]
[ROW][C]19[/C][C]112.4[/C][C]117.40397505004[/C][C]-5.00397505004013[/C][/ROW]
[ROW][C]20[/C][C]135.6[/C][C]143.961672339372[/C][C]-8.36167233937196[/C][/ROW]
[ROW][C]21[/C][C]105.1[/C][C]107.912704373999[/C][C]-2.81270437399882[/C][/ROW]
[ROW][C]22[/C][C]127.7[/C][C]127.760678576862[/C][C]-0.060678576861918[/C][/ROW]
[ROW][C]23[/C][C]137[/C][C]140.219577545036[/C][C]-3.21957754503612[/C][/ROW]
[ROW][C]24[/C][C]91[/C][C]89.6780956415129[/C][C]1.32190435848713[/C][/ROW]
[ROW][C]25[/C][C]90.5[/C][C]98.929134298439[/C][C]-8.42913429843894[/C][/ROW]
[ROW][C]26[/C][C]122.4[/C][C]126.388182119195[/C][C]-3.98818211919543[/C][/ROW]
[ROW][C]27[/C][C]123.3[/C][C]129.678119744296[/C][C]-6.37811974429573[/C][/ROW]
[ROW][C]28[/C][C]124.3[/C][C]125.679494378503[/C][C]-1.37949437850318[/C][/ROW]
[ROW][C]29[/C][C]120[/C][C]112.975453642414[/C][C]7.02454635758626[/C][/ROW]
[ROW][C]30[/C][C]118.1[/C][C]113.777125981786[/C][C]4.32287401821429[/C][/ROW]
[ROW][C]31[/C][C]119[/C][C]119.647950100080[/C][C]-0.647950100080233[/C][/ROW]
[ROW][C]32[/C][C]142.7[/C][C]142.278691051842[/C][C]0.421308948158136[/C][/ROW]
[ROW][C]33[/C][C]123.6[/C][C]113.335644078262[/C][C]10.2643559217375[/C][/ROW]
[ROW][C]34[/C][C]129.6[/C][C]124.020720160128[/C][C]5.5792798398716[/C][/ROW]
[ROW][C]35[/C][C]151.6[/C][C]146.016513090973[/C][C]5.58348690902691[/C][/ROW]
[ROW][C]36[/C][C]110.4[/C][C]109.312877329364[/C][C]1.08712267063608[/C][/ROW]
[ROW][C]37[/C][C]99.2[/C][C]101.547105190152[/C][C]-2.34710519015241[/C][/ROW]
[ROW][C]38[/C][C]130.5[/C][C]113.485325581465[/C][C]17.0146744185353[/C][/ROW]
[ROW][C]39[/C][C]136.2[/C][C]133.418078161029[/C][C]2.78192183897073[/C][/ROW]
[ROW][C]40[/C][C]129.7[/C][C]124.183511011810[/C][C]5.51648898819022[/C][/ROW]
[ROW][C]41[/C][C]128[/C][C]114.658434929944[/C][C]13.3415650700562[/C][/ROW]
[ROW][C]42[/C][C]121.6[/C][C]117.517084398519[/C][C]4.08291560148076[/C][/ROW]
[ROW][C]43[/C][C]135.8[/C][C]126.940869012711[/C][C]8.85913098728938[/C][/ROW]
[ROW][C]44[/C][C]143.8[/C][C]125.261880255704[/C][C]18.5381197442957[/C][/ROW]
[ROW][C]45[/C][C]147.5[/C][C]142.320321807947[/C][C]5.17967819205265[/C][/ROW]
[ROW][C]46[/C][C]136.2[/C][C]115.605813722478[/C][C]20.5941862775221[/C][/ROW]
[ROW][C]47[/C][C]156.6[/C][C]141.341565070056[/C][C]15.2584349299438[/C][/ROW]
[ROW][C]48[/C][C]123.3[/C][C]115.109812875301[/C][C]8.19018712469907[/C][/ROW]
[ROW][C]49[/C][C]104.5[/C][C]83.7823027106681[/C][C]20.7176972893319[/C][/ROW]
[ROW][C]50[/C][C]139.8[/C][C]131.811121823459[/C][C]7.98887817654094[/C][/ROW]
[ROW][C]51[/C][C]136.5[/C][C]128.930128060949[/C][C]7.56987193905099[/C][/ROW]
[ROW][C]52[/C][C]112.1[/C][C]102.678750115592[/C][C]9.42124988440806[/C][/ROW]
[ROW][C]53[/C][C]118.5[/C][C]124.382326813451[/C][C]-5.88232681345101[/C][/ROW]
[ROW][C]54[/C][C]94.4[/C][C]98.6302943940149[/C][C]-4.23029439401486[/C][/ROW]
[ROW][C]55[/C][C]102.3[/C][C]107.306087324860[/C][C]-5.00608732485958[/C][/ROW]
[ROW][C]56[/C][C]111.4[/C][C]127.131859464071[/C][C]-15.7318594640710[/C][/ROW]
[ROW][C]57[/C][C]99.2[/C][C]110.904671107386[/C][C]-11.7046711073857[/C][/ROW]
[ROW][C]58[/C][C]87.8[/C][C]104.385938472277[/C][C]-16.5859384722773[/C][/ROW]
[ROW][C]59[/C][C]115.8[/C][C]130.308687740692[/C][C]-14.5086877406922[/C][/ROW]
[ROW][C]60[/C][C]79.7[/C][C]95.2880332666132[/C][C]-15.5880332666132[/C][/ROW]
[/TABLE]
Source: https://freestatistics.org/blog/index.php?pk=58510&T=4

Globally Unique Identifier (entire table): ba.freestatistics.org/blog/index.php?pk=58510&T=4

As an alternative you can also use a QR Code:  

The GUIDs for individual cells are displayed in the table below:

Multiple Linear Regression - Actuals, Interpolation, and Residuals
Time or IndexActualsInterpolationForecastResidualsPrediction Error
183.491.4492174649721-8.04921746497212
2113.6127.136173802542-13.5361738025421
3112.9113.783296473178-0.883296473178192
4104113.898625365793-9.89862536579254
5109.9130.179262359388-20.279262359388
699100.687271523218-1.68727152321832
7106.3104.5011185123091.79888148769056
8128.9123.7658968890115.13410311098914
9111.1112.026658632406-0.92665863240571
10102.9112.426849068254-9.52684906825442
11130133.113656553242-3.11365655324238
128782.01118088720914.98881911279087
1387.589.3922403357684-1.89224033576843
14117.6125.079196673339-7.4791966733387
15103.4106.490377560548-3.09037756054782
16110.8114.459619128303-3.65961912830257
17112.6106.8045222548035.79547774519658
18102.5104.988223702462-2.48822370246188
19112.4117.40397505004-5.00397505004013
20135.6143.961672339372-8.36167233937196
21105.1107.912704373999-2.81270437399882
22127.7127.760678576862-0.060678576861918
23137140.219577545036-3.21957754503612
249189.67809564151291.32190435848713
2590.598.929134298439-8.42913429843894
26122.4126.388182119195-3.98818211919543
27123.3129.678119744296-6.37811974429573
28124.3125.679494378503-1.37949437850318
29120112.9754536424147.02454635758626
30118.1113.7771259817864.32287401821429
31119119.647950100080-0.647950100080233
32142.7142.2786910518420.421308948158136
33123.6113.33564407826210.2643559217375
34129.6124.0207201601285.5792798398716
35151.6146.0165130909735.58348690902691
36110.4109.3128773293641.08712267063608
3799.2101.547105190152-2.34710519015241
38130.5113.48532558146517.0146744185353
39136.2133.4180781610292.78192183897073
40129.7124.1835110118105.51648898819022
41128114.65843492994413.3415650700562
42121.6117.5170843985194.08291560148076
43135.8126.9408690127118.85913098728938
44143.8125.26188025570418.5381197442957
45147.5142.3203218079475.17967819205265
46136.2115.60581372247820.5941862775221
47156.6141.34156507005615.2584349299438
48123.3115.1098128753018.19018712469907
49104.583.782302710668120.7176972893319
50139.8131.8111218234597.98887817654094
51136.5128.9301280609497.56987193905099
52112.1102.6787501155929.42124988440806
53118.5124.382326813451-5.88232681345101
5494.498.6302943940149-4.23029439401486
55102.3107.306087324860-5.00608732485958
56111.4127.131859464071-15.7318594640710
5799.2110.904671107386-11.7046711073857
5887.8104.385938472277-16.5859384722773
59115.8130.308687740692-14.5086877406922
6079.795.2880332666132-15.5880332666132


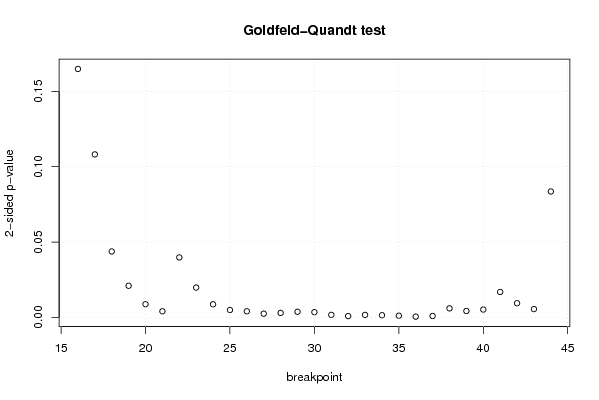
Goldfeld-Quandt test for Heteroskedasticity
p-valuesAlternative Hypothesis
breakpoint indexgreater2-sidedless
160.0824658523128890.1649317046257780.917534147687111
170.0540968771353420.1081937542706840.945903122864658
180.02187090799096720.04374181598193440.978129092009033
190.01047698144415940.02095396288831880.98952301855584
200.004360566708918730.008721133417837460.995639433291081
210.002009550684472860.004019101368945720.997990449315527
220.019894535033650.03978907006730.98010546496635
230.009886639431520240.01977327886304050.99011336056848
240.004330402167981570.008660804335963150.995669597832018
250.002438768311074110.004877536622148220.997561231688926
260.002014497470330230.004028994940660460.99798550252967
270.001220288783889700.002440577567779390.99877971121611
280.001471714404934460.002943428809868920.998528285595066
290.001855492848167270.003710985696334540.998144507151833
300.001718475092782190.003436950185564380.998281524907218
310.000821941383385420.001643882766770840.999178058616615
320.0004071203889300160.0008142407778600320.99959287961107
330.0008099178223108550.001619835644621710.99919008217769
340.0006971274139575230.001394254827915050.999302872586042
350.0005414466762773880.001082893352554780.999458553323723
360.00022975356622540.00045950713245080.999770246433775
370.0004505984510938520.0009011969021877040.999549401548906
380.002989527495142590.005979054990285180.997010472504857
390.002108781844234650.004217563688469300.997891218155765
400.00259392752367510.00518785504735020.997406072476325
410.008429481617532110.01685896323506420.991570518382468
420.004687455489307550.00937491097861510.995312544510693
430.002748048682240800.005496097364481610.99725195131776
440.04179315658130140.08358631316260290.958206843418699

\begin{tabular}{lllllllll}
\hline
Goldfeld-Quandt test for Heteroskedasticity \tabularnewline
p-values & Alternative Hypothesis \tabularnewline
breakpoint index & greater & 2-sided & less \tabularnewline
16 & 0.082465852312889 & 0.164931704625778 & 0.917534147687111 \tabularnewline
17 & 0.054096877135342 & 0.108193754270684 & 0.945903122864658 \tabularnewline
18 & 0.0218709079909672 & 0.0437418159819344 & 0.978129092009033 \tabularnewline
19 & 0.0104769814441594 & 0.0209539628883188 & 0.98952301855584 \tabularnewline
20 & 0.00436056670891873 & 0.00872113341783746 & 0.995639433291081 \tabularnewline
21 & 0.00200955068447286 & 0.00401910136894572 & 0.997990449315527 \tabularnewline
22 & 0.01989453503365 & 0.0397890700673 & 0.98010546496635 \tabularnewline
23 & 0.00988663943152024 & 0.0197732788630405 & 0.99011336056848 \tabularnewline
24 & 0.00433040216798157 & 0.00866080433596315 & 0.995669597832018 \tabularnewline
25 & 0.00243876831107411 & 0.00487753662214822 & 0.997561231688926 \tabularnewline
26 & 0.00201449747033023 & 0.00402899494066046 & 0.99798550252967 \tabularnewline
27 & 0.00122028878388970 & 0.00244057756777939 & 0.99877971121611 \tabularnewline
28 & 0.00147171440493446 & 0.00294342880986892 & 0.998528285595066 \tabularnewline
29 & 0.00185549284816727 & 0.00371098569633454 & 0.998144507151833 \tabularnewline
30 & 0.00171847509278219 & 0.00343695018556438 & 0.998281524907218 \tabularnewline
31 & 0.00082194138338542 & 0.00164388276677084 & 0.999178058616615 \tabularnewline
32 & 0.000407120388930016 & 0.000814240777860032 & 0.99959287961107 \tabularnewline
33 & 0.000809917822310855 & 0.00161983564462171 & 0.99919008217769 \tabularnewline
34 & 0.000697127413957523 & 0.00139425482791505 & 0.999302872586042 \tabularnewline
35 & 0.000541446676277388 & 0.00108289335255478 & 0.999458553323723 \tabularnewline
36 & 0.0002297535662254 & 0.0004595071324508 & 0.999770246433775 \tabularnewline
37 & 0.000450598451093852 & 0.000901196902187704 & 0.999549401548906 \tabularnewline
38 & 0.00298952749514259 & 0.00597905499028518 & 0.997010472504857 \tabularnewline
39 & 0.00210878184423465 & 0.00421756368846930 & 0.997891218155765 \tabularnewline
40 & 0.0025939275236751 & 0.0051878550473502 & 0.997406072476325 \tabularnewline
41 & 0.00842948161753211 & 0.0168589632350642 & 0.991570518382468 \tabularnewline
42 & 0.00468745548930755 & 0.0093749109786151 & 0.995312544510693 \tabularnewline
43 & 0.00274804868224080 & 0.00549609736448161 & 0.99725195131776 \tabularnewline
44 & 0.0417931565813014 & 0.0835863131626029 & 0.958206843418699 \tabularnewline
\hline
\end{tabular}
%Source: https://freestatistics.org/blog/index.php?pk=58510&T=5

[TABLE]
[ROW][C]Goldfeld-Quandt test for Heteroskedasticity[/C][/ROW]
[ROW][C]p-values[/C][C]Alternative Hypothesis[/C][/ROW]
[ROW][C]breakpoint index[/C][C]greater[/C][C]2-sided[/C][C]less[/C][/ROW]
[ROW][C]16[/C][C]0.082465852312889[/C][C]0.164931704625778[/C][C]0.917534147687111[/C][/ROW]
[ROW][C]17[/C][C]0.054096877135342[/C][C]0.108193754270684[/C][C]0.945903122864658[/C][/ROW]
[ROW][C]18[/C][C]0.0218709079909672[/C][C]0.0437418159819344[/C][C]0.978129092009033[/C][/ROW]
[ROW][C]19[/C][C]0.0104769814441594[/C][C]0.0209539628883188[/C][C]0.98952301855584[/C][/ROW]
[ROW][C]20[/C][C]0.00436056670891873[/C][C]0.00872113341783746[/C][C]0.995639433291081[/C][/ROW]
[ROW][C]21[/C][C]0.00200955068447286[/C][C]0.00401910136894572[/C][C]0.997990449315527[/C][/ROW]
[ROW][C]22[/C][C]0.01989453503365[/C][C]0.0397890700673[/C][C]0.98010546496635[/C][/ROW]
[ROW][C]23[/C][C]0.00988663943152024[/C][C]0.0197732788630405[/C][C]0.99011336056848[/C][/ROW]
[ROW][C]24[/C][C]0.00433040216798157[/C][C]0.00866080433596315[/C][C]0.995669597832018[/C][/ROW]
[ROW][C]25[/C][C]0.00243876831107411[/C][C]0.00487753662214822[/C][C]0.997561231688926[/C][/ROW]
[ROW][C]26[/C][C]0.00201449747033023[/C][C]0.00402899494066046[/C][C]0.99798550252967[/C][/ROW]
[ROW][C]27[/C][C]0.00122028878388970[/C][C]0.00244057756777939[/C][C]0.99877971121611[/C][/ROW]
[ROW][C]28[/C][C]0.00147171440493446[/C][C]0.00294342880986892[/C][C]0.998528285595066[/C][/ROW]
[ROW][C]29[/C][C]0.00185549284816727[/C][C]0.00371098569633454[/C][C]0.998144507151833[/C][/ROW]
[ROW][C]30[/C][C]0.00171847509278219[/C][C]0.00343695018556438[/C][C]0.998281524907218[/C][/ROW]
[ROW][C]31[/C][C]0.00082194138338542[/C][C]0.00164388276677084[/C][C]0.999178058616615[/C][/ROW]
[ROW][C]32[/C][C]0.000407120388930016[/C][C]0.000814240777860032[/C][C]0.99959287961107[/C][/ROW]
[ROW][C]33[/C][C]0.000809917822310855[/C][C]0.00161983564462171[/C][C]0.99919008217769[/C][/ROW]
[ROW][C]34[/C][C]0.000697127413957523[/C][C]0.00139425482791505[/C][C]0.999302872586042[/C][/ROW]
[ROW][C]35[/C][C]0.000541446676277388[/C][C]0.00108289335255478[/C][C]0.999458553323723[/C][/ROW]
[ROW][C]36[/C][C]0.0002297535662254[/C][C]0.0004595071324508[/C][C]0.999770246433775[/C][/ROW]
[ROW][C]37[/C][C]0.000450598451093852[/C][C]0.000901196902187704[/C][C]0.999549401548906[/C][/ROW]
[ROW][C]38[/C][C]0.00298952749514259[/C][C]0.00597905499028518[/C][C]0.997010472504857[/C][/ROW]
[ROW][C]39[/C][C]0.00210878184423465[/C][C]0.00421756368846930[/C][C]0.997891218155765[/C][/ROW]
[ROW][C]40[/C][C]0.0025939275236751[/C][C]0.0051878550473502[/C][C]0.997406072476325[/C][/ROW]
[ROW][C]41[/C][C]0.00842948161753211[/C][C]0.0168589632350642[/C][C]0.991570518382468[/C][/ROW]
[ROW][C]42[/C][C]0.00468745548930755[/C][C]0.0093749109786151[/C][C]0.995312544510693[/C][/ROW]
[ROW][C]43[/C][C]0.00274804868224080[/C][C]0.00549609736448161[/C][C]0.99725195131776[/C][/ROW]
[ROW][C]44[/C][C]0.0417931565813014[/C][C]0.0835863131626029[/C][C]0.958206843418699[/C][/ROW]
[/TABLE]
Source: https://freestatistics.org/blog/index.php?pk=58510&T=5

Globally Unique Identifier (entire table): ba.freestatistics.org/blog/index.php?pk=58510&T=5

As an alternative you can also use a QR Code:  

The GUIDs for individual cells are displayed in the table below:

Goldfeld-Quandt test for Heteroskedasticity
p-valuesAlternative Hypothesis
breakpoint indexgreater2-sidedless
160.0824658523128890.1649317046257780.917534147687111
170.0540968771353420.1081937542706840.945903122864658
180.02187090799096720.04374181598193440.978129092009033
190.01047698144415940.02095396288831880.98952301855584
200.004360566708918730.008721133417837460.995639433291081
210.002009550684472860.004019101368945720.997990449315527
220.019894535033650.03978907006730.98010546496635
230.009886639431520240.01977327886304050.99011336056848
240.004330402167981570.008660804335963150.995669597832018
250.002438768311074110.004877536622148220.997561231688926
260.002014497470330230.004028994940660460.99798550252967
270.001220288783889700.002440577567779390.99877971121611
280.001471714404934460.002943428809868920.998528285595066
290.001855492848167270.003710985696334540.998144507151833
300.001718475092782190.003436950185564380.998281524907218
310.000821941383385420.001643882766770840.999178058616615
320.0004071203889300160.0008142407778600320.99959287961107
330.0008099178223108550.001619835644621710.99919008217769
340.0006971274139575230.001394254827915050.999302872586042
350.0005414466762773880.001082893352554780.999458553323723
360.00022975356622540.00045950713245080.999770246433775
370.0004505984510938520.0009011969021877040.999549401548906
380.002989527495142590.005979054990285180.997010472504857
390.002108781844234650.004217563688469300.997891218155765
400.00259392752367510.00518785504735020.997406072476325
410.008429481617532110.01685896323506420.991570518382468
420.004687455489307550.00937491097861510.995312544510693
430.002748048682240800.005496097364481610.99725195131776
440.04179315658130140.08358631316260290.958206843418699


Meta Analysis of Goldfeld-Quandt test for Heteroskedasticity
Description# significant tests% significant testsOK/NOK
1% type I error level210.724137931034483NOK
5% type I error level260.896551724137931NOK
10% type I error level270.93103448275862NOK

\begin{tabular}{lllllllll}
\hline
Meta Analysis of Goldfeld-Quandt test for Heteroskedasticity \tabularnewline
Description & # significant tests & % significant tests & OK/NOK \tabularnewline
1% type I error level & 21 & 0.724137931034483 & NOK \tabularnewline
5% type I error level & 26 & 0.896551724137931 & NOK \tabularnewline
10% type I error level & 27 & 0.93103448275862 & NOK \tabularnewline
\hline
\end{tabular}
%Source: https://freestatistics.org/blog/index.php?pk=58510&T=6

[TABLE]
[ROW][C]Meta Analysis of Goldfeld-Quandt test for Heteroskedasticity[/C][/ROW]
[ROW][C]Description[/C][C]# significant tests[/C][C]% significant tests[/C][C]OK/NOK[/C][/ROW]
[ROW][C]1% type I error level[/C][C]21[/C][C]0.724137931034483[/C][C]NOK[/C][/ROW]
[ROW][C]5% type I error level[/C][C]26[/C][C]0.896551724137931[/C][C]NOK[/C][/ROW]
[ROW][C]10% type I error level[/C][C]27[/C][C]0.93103448275862[/C][C]NOK[/C][/ROW]
[/TABLE]
Source: https://freestatistics.org/blog/index.php?pk=58510&T=6

Globally Unique Identifier (entire table): ba.freestatistics.org/blog/index.php?pk=58510&T=6

As an alternative you can also use a QR Code:  

The GUIDs for individual cells are displayed in the table below:

Meta Analysis of Goldfeld-Quandt test for Heteroskedasticity
Description# significant tests% significant testsOK/NOK
1% type I error level210.724137931034483NOK
5% type I error level260.896551724137931NOK
10% type I error level270.93103448275862NOK


Parameters (Session):
par1 = 1 ; par2 = Include Monthly Dummies ; par3 = No Linear Trend ;
Parameters (R input):
par1 = 1 ; par2 = Include Monthly Dummies ; par3 = No Linear Trend ;
R code (references can be found in the software module):
library(lattice)
library(lmtest)
n25 <- 25 #minimum number of obs. for Goldfeld-Quandt test
par1 <- as.numeric(par1)
x <- t(y)
k <- length(x[1,])
n <- length(x[,1])
x1 <- cbind(x[,par1], x[,1:k!=par1])
mycolnames <- c(colnames(x)[par1], colnames(x)[1:k!=par1])
colnames(x1) <- mycolnames #colnames(x)[par1]
x <- x1
if (par3 == 'First Differences'){
x2 <- array(0, dim=c(n-1,k), dimnames=list(1:(n-1), paste('(1-B)',colnames(x),sep='')))
for (i in 1:n-1) {
for (j in 1:k) {
x2[i,j] <- x[i+1,j] - x[i,j]
}
}
x <- x2
}
if (par2 == 'Include Monthly Dummies'){
x2 <- array(0, dim=c(n,11), dimnames=list(1:n, paste('M', seq(1:11), sep ='')))
for (i in 1:11){
x2[seq(i,n,12),i] <- 1
}
x <- cbind(x, x2)
}
if (par2 == 'Include Quarterly Dummies'){
x2 <- array(0, dim=c(n,3), dimnames=list(1:n, paste('Q', seq(1:3), sep ='')))
for (i in 1:3){
x2[seq(i,n,4),i] <- 1
}
x <- cbind(x, x2)
}
k <- length(x[1,])
if (par3 == 'Linear Trend'){
x <- cbind(x, c(1:n))
colnames(x)[k+1] <- 't'
}
x
k <- length(x[1,])
df <- as.data.frame(x)
(mylm <- lm(df))
(mysum <- summary(mylm))
if (n > n25) {
kp3 <- k + 3
nmkm3 <- n - k - 3
gqarr <- array(NA, dim=c(nmkm3-kp3+1,3))
numgqtests <- 0
numsignificant1 <- 0
numsignificant5 <- 0
numsignificant10 <- 0
for (mypoint in kp3:nmkm3) {
j <- 0
numgqtests <- numgqtests + 1
for (myalt in c('greater', 'two.sided', 'less')) {
j <- j + 1
gqarr[mypoint-kp3+1,j] <- gqtest(mylm, point=mypoint, alternative=myalt)$p.value
}
if (gqarr[mypoint-kp3+1,2] < 0.01) numsignificant1 <- numsignificant1 + 1
if (gqarr[mypoint-kp3+1,2] < 0.05) numsignificant5 <- numsignificant5 + 1
if (gqarr[mypoint-kp3+1,2] < 0.10) numsignificant10 <- numsignificant10 + 1
}
gqarr
}
bitmap(file='test0.png')
plot(x[,1], type='l', main='Actuals and Interpolation', ylab='value of Actuals and Interpolation (dots)', xlab='time or index')
points(x[,1]-mysum$resid)
grid()
dev.off()
bitmap(file='test1.png')
plot(mysum$resid, type='b', pch=19, main='Residuals', ylab='value of Residuals', xlab='time or index')
grid()
dev.off()
bitmap(file='test2.png')
hist(mysum$resid, main='Residual Histogram', xlab='values of Residuals')
grid()
dev.off()
bitmap(file='test3.png')
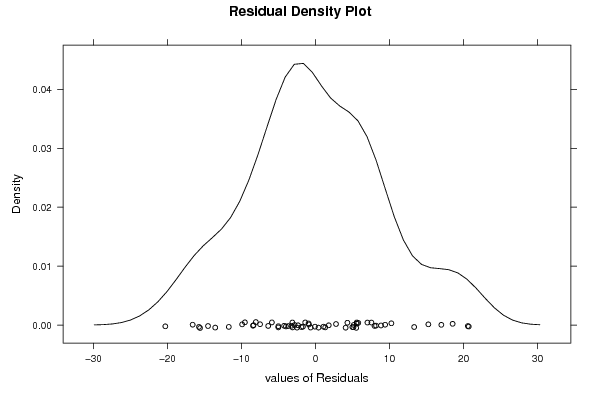
densityplot(~mysum$resid,col='black',main='Residual Density Plot', xlab='values of Residuals')
dev.off()
bitmap(file='test4.png')
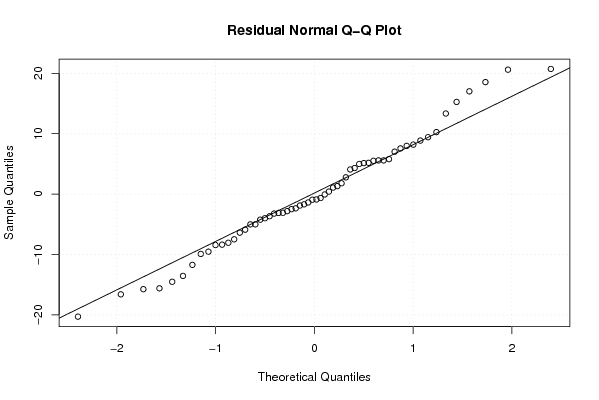
qqnorm(mysum$resid, main='Residual Normal Q-Q Plot')
qqline(mysum$resid)
grid()
dev.off()
(myerror <- as.ts(mysum$resid))
bitmap(file='test5.png')
dum <- cbind(lag(myerror,k=1),myerror)
dum
dum1 <- dum[2:length(myerror),]
dum1
z <- as.data.frame(dum1)
z
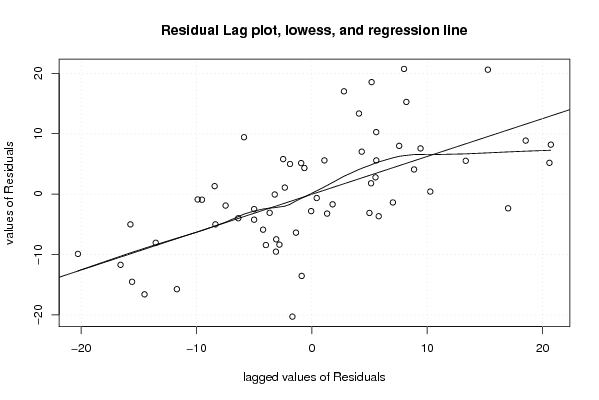
plot(z,main=paste('Residual Lag plot, lowess, and regression line'), ylab='values of Residuals', xlab='lagged values of Residuals')
lines(lowess(z))
abline(lm(z))
grid()
dev.off()
bitmap(file='test6.png')
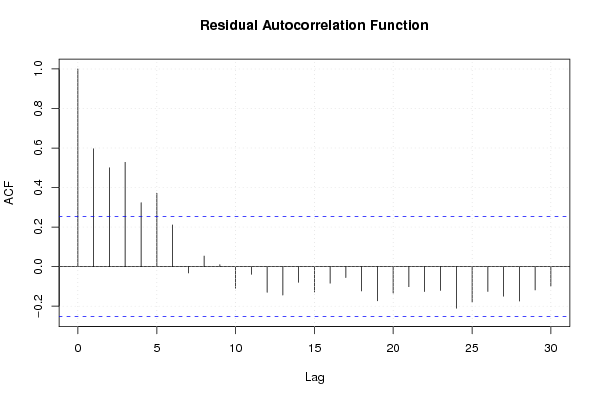
acf(mysum$resid, lag.max=length(mysum$resid)/2, main='Residual Autocorrelation Function')
grid()
dev.off()
bitmap(file='test7.png')
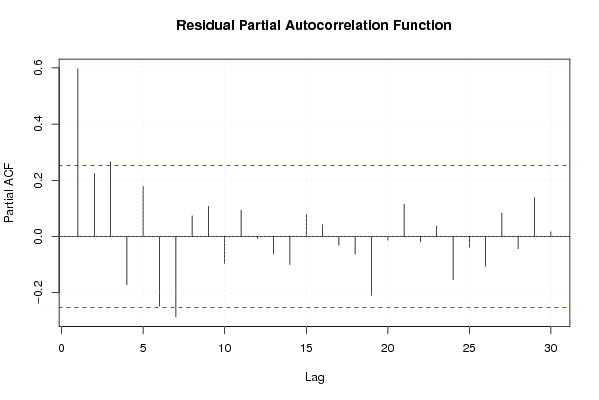
pacf(mysum$resid, lag.max=length(mysum$resid)/2, main='Residual Partial Autocorrelation Function')
grid()
dev.off()
bitmap(file='test8.png')
opar <- par(mfrow = c(2,2), oma = c(0, 0, 1.1, 0))
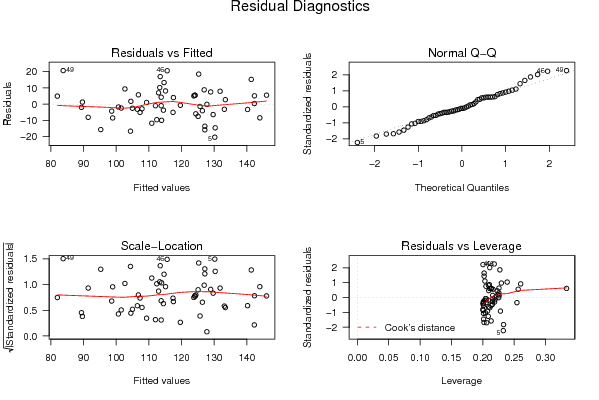
plot(mylm, las = 1, sub='Residual Diagnostics')
par(opar)
dev.off()
if (n > n25) {
bitmap(file='test9.png')
plot(kp3:nmkm3,gqarr[,2], main='Goldfeld-Quandt test',ylab='2-sided p-value',xlab='breakpoint')
grid()
dev.off()
}
load(file='createtable')
a<-table.start()
a<-table.row.start(a)
a<-table.element(a, 'Multiple Linear Regression - Estimated Regression Equation', 1, TRUE)
a<-table.row.end(a)
myeq <- colnames(x)[1]
myeq <- paste(myeq, '[t] = ', sep='')
for (i in 1:k){
if (mysum$coefficients[i,1] > 0) myeq <- paste(myeq, '+', '')
myeq <- paste(myeq, mysum$coefficients[i,1], sep=' ')
if (rownames(mysum$coefficients)[i] != '(Intercept)') {
myeq <- paste(myeq, rownames(mysum$coefficients)[i], sep='')
if (rownames(mysum$coefficients)[i] != 't') myeq <- paste(myeq, '[t]', sep='')
}
}
myeq <- paste(myeq, ' + e[t]')
a<-table.row.start(a)
a<-table.element(a, myeq)
a<-table.row.end(a)
a<-table.end(a)
table.save(a,file='mytable1.tab')
a<-table.start()
a<-table.row.start(a)
a<-table.element(a,hyperlink('ols1.htm','Multiple Linear Regression - Ordinary Least Squares',''), 6, TRUE)
a<-table.row.end(a)
a<-table.row.start(a)
a<-table.element(a,'Variable',header=TRUE)
a<-table.element(a,'Parameter',header=TRUE)
a<-table.element(a,'S.D.',header=TRUE)
a<-table.element(a,'T-STAT
H0: parameter = 0',header=TRUE)
a<-table.element(a,'2-tail p-value',header=TRUE)
a<-table.element(a,'1-tail p-value',header=TRUE)
a<-table.row.end(a)
for (i in 1:k){
a<-table.row.start(a)
a<-table.element(a,rownames(mysum$coefficients)[i],header=TRUE)
a<-table.element(a,mysum$coefficients[i,1])
a<-table.element(a, round(mysum$coefficients[i,2],6))
a<-table.element(a, round(mysum$coefficients[i,3],4))
a<-table.element(a, round(mysum$coefficients[i,4],6))
a<-table.element(a, round(mysum$coefficients[i,4]/2,6))
a<-table.row.end(a)
}
a<-table.end(a)
table.save(a,file='mytable2.tab')
a<-table.start()
a<-table.row.start(a)
a<-table.element(a, 'Multiple Linear Regression - Regression Statistics', 2, TRUE)
a<-table.row.end(a)
a<-table.row.start(a)
a<-table.element(a, 'Multiple R',1,TRUE)
a<-table.element(a, sqrt(mysum$r.squared))
a<-table.row.end(a)
a<-table.row.start(a)
a<-table.element(a, 'R-squared',1,TRUE)
a<-table.element(a, mysum$r.squared)
a<-table.row.end(a)
a<-table.row.start(a)
a<-table.element(a, 'Adjusted R-squared',1,TRUE)
a<-table.element(a, mysum$adj.r.squared)
a<-table.row.end(a)
a<-table.row.start(a)
a<-table.element(a, 'F-TEST (value)',1,TRUE)
a<-table.element(a, mysum$fstatistic[1])
a<-table.row.end(a)
a<-table.row.start(a)
a<-table.element(a, 'F-TEST (DF numerator)',1,TRUE)
a<-table.element(a, mysum$fstatistic[2])
a<-table.row.end(a)
a<-table.row.start(a)
a<-table.element(a, 'F-TEST (DF denominator)',1,TRUE)
a<-table.element(a, mysum$fstatistic[3])
a<-table.row.end(a)
a<-table.row.start(a)
a<-table.element(a, 'p-value',1,TRUE)
a<-table.element(a, 1-pf(mysum$fstatistic[1],mysum$fstatistic[2],mysum$fstatistic[3]))
a<-table.row.end(a)
a<-table.row.start(a)
a<-table.element(a, 'Multiple Linear Regression - Residual Statistics', 2, TRUE)
a<-table.row.end(a)
a<-table.row.start(a)
a<-table.element(a, 'Residual Standard Deviation',1,TRUE)
a<-table.element(a, mysum$sigma)
a<-table.row.end(a)
a<-table.row.start(a)
a<-table.element(a, 'Sum Squared Residuals',1,TRUE)
a<-table.element(a, sum(myerror*myerror))
a<-table.row.end(a)
a<-table.end(a)
table.save(a,file='mytable3.tab')
a<-table.start()
a<-table.row.start(a)
a<-table.element(a, 'Multiple Linear Regression - Actuals, Interpolation, and Residuals', 4, TRUE)
a<-table.row.end(a)
a<-table.row.start(a)
a<-table.element(a, 'Time or Index', 1, TRUE)
a<-table.element(a, 'Actuals', 1, TRUE)
a<-table.element(a, 'Interpolation
Forecast', 1, TRUE)
a<-table.element(a, 'Residuals
Prediction Error', 1, TRUE)
a<-table.row.end(a)
for (i in 1:n) {
a<-table.row.start(a)
a<-table.element(a,i, 1, TRUE)
a<-table.element(a,x[i])
a<-table.element(a,x[i]-mysum$resid[i])
a<-table.element(a,mysum$resid[i])
a<-table.row.end(a)
}
a<-table.end(a)
table.save(a,file='mytable4.tab')
if (n > n25) {
a<-table.start()
a<-table.row.start(a)
a<-table.element(a,'Goldfeld-Quandt test for Heteroskedasticity',4,TRUE)
a<-table.row.end(a)
a<-table.row.start(a)
a<-table.element(a,'p-values',header=TRUE)
a<-table.element(a,'Alternative Hypothesis',3,header=TRUE)
a<-table.row.end(a)
a<-table.row.start(a)
a<-table.element(a,'breakpoint index',header=TRUE)
a<-table.element(a,'greater',header=TRUE)
a<-table.element(a,'2-sided',header=TRUE)
a<-table.element(a,'less',header=TRUE)
a<-table.row.end(a)
for (mypoint in kp3:nmkm3) {
a<-table.row.start(a)
a<-table.element(a,mypoint,header=TRUE)
a<-table.element(a,gqarr[mypoint-kp3+1,1])
a<-table.element(a,gqarr[mypoint-kp3+1,2])
a<-table.element(a,gqarr[mypoint-kp3+1,3])
a<-table.row.end(a)
}
a<-table.end(a)
table.save(a,file='mytable5.tab')
a<-table.start()
a<-table.row.start(a)
a<-table.element(a,'Meta Analysis of Goldfeld-Quandt test for Heteroskedasticity',4,TRUE)
a<-table.row.end(a)
a<-table.row.start(a)
a<-table.element(a,'Description',header=TRUE)
a<-table.element(a,'# significant tests',header=TRUE)
a<-table.element(a,'% significant tests',header=TRUE)
a<-table.element(a,'OK/NOK',header=TRUE)
a<-table.row.end(a)
a<-table.row.start(a)
a<-table.element(a,'1% type I error level',header=TRUE)
a<-table.element(a,numsignificant1)
a<-table.element(a,numsignificant1/numgqtests)
if (numsignificant1/numgqtests < 0.01) dum <- 'OK' else dum <- 'NOK'
a<-table.element(a,dum)
a<-table.row.end(a)
a<-table.row.start(a)
a<-table.element(a,'5% type I error level',header=TRUE)
a<-table.element(a,numsignificant5)
a<-table.element(a,numsignificant5/numgqtests)
if (numsignificant5/numgqtests < 0.05) dum <- 'OK' else dum <- 'NOK'
a<-table.element(a,dum)
a<-table.row.end(a)
a<-table.row.start(a)
a<-table.element(a,'10% type I error level',header=TRUE)
a<-table.element(a,numsignificant10)
a<-table.element(a,numsignificant10/numgqtests)
if (numsignificant10/numgqtests < 0.1) dum <- 'OK' else dum <- 'NOK'
a<-table.element(a,dum)
a<-table.row.end(a)
a<-table.end(a)
table.save(a,file='mytable6.tab')
}