Free Statistics

of Irreproducible Research!

Author's title

Author*The author of this computation has been verified*
R Software Modulerwasp_multipleregression.wasp
Title produced by softwareMultiple Regression
Date of computationSat, 21 Nov 2009 00:18:18 -0700
Cite this page as followsStatistical Computations at FreeStatistics.org, Office for Research Development and Education, URL https://freestatistics.org/blog/index.php?v=date/2009/Nov/21/t12587879523vnjwac9z6zq8c3.htm/, Retrieved Sun, 28 Apr 2024 15:32:14 +0000
Statistical Computations at FreeStatistics.org, Office for Research Development and Education, URL https://freestatistics.org/blog/index.php?pk=58511, Retrieved Sun, 28 Apr 2024 15:32:14 +0000
QR Codes:

Original text written by user:
IsPrivate?No (this computation is public)
User-defined keywords
Estimated Impact185
Family? (F = Feedback message, R = changed R code, M = changed R Module, P = changed Parameters, D = changed Data)
-       [Multiple Regression] [WS 7 Multiple Reg...] [2009-11-21 07:18:18] [762da55b2e2304daaed24a7cc507d14d] [Current]
Feedback Forum

Post a new message
Dataseries X:
83.4	108.8
113.6	128.4
112.9	121.1
104	119.5
109.9	128.7
99	108.7
106.3	105.5
128.9	119.8
111.1	111.3
102.9	110.6
130	120.1
87	97.5
87.5	107.7
117.6	127.3
103.4	117.2
110.8	119.8
112.6	116.2
102.5	111
112.4	112.4
135.6	130.6
105.1	109.1
127.7	118.8
137	123.9
91	101.6
90.5	112.8
122.4	128
123.3	129.6
124.3	125.8
120	119.5
118.1	115.7
119	113.6
142.7	129.7
123.6	112
129.6	116.8
151.6	127
110.4	112.1
99.2	114.2
130.5	121.1
136.2	131.6
129.7	125
128	120.4
121.6	117.7
135.8	117.5
143.8	120.6
147.5	127.5
136.2	112.3
156.6	124.5
123.3	115.2
104.5	104.7
139.8	130.9
136.5	129.2
112.1	113.5
118.5	125.6
94.4	107.6
102.3	107
111.4	121.6
99.2	110.7
87.8	106.3
115.8	118.6
79.7	104.6


Summary of computational transaction
Raw Inputview raw input (R code)
Raw Outputview raw output of R engine
Computing time4 seconds
R Server'Gwilym Jenkins' @ 72.249.127.135

\begin{tabular}{lllllllll}
\hline
Summary of computational transaction \tabularnewline
Raw Input & view raw input (R code)  \tabularnewline
Raw Output & view raw output of R engine  \tabularnewline
Computing time & 4 seconds \tabularnewline
R Server & 'Gwilym Jenkins' @ 72.249.127.135 \tabularnewline
\hline
\end{tabular}
%Source: https://freestatistics.org/blog/index.php?pk=58511&T=0

[TABLE]
[ROW][C]Summary of computational transaction[/C][/ROW]
[ROW][C]Raw Input[/C][C]view raw input (R code) [/C][/ROW]
[ROW][C]Raw Output[/C][C]view raw output of R engine [/C][/ROW]
[ROW][C]Computing time[/C][C]4 seconds[/C][/ROW]
[ROW][C]R Server[/C][C]'Gwilym Jenkins' @ 72.249.127.135[/C][/ROW]
[/TABLE]
Source: https://freestatistics.org/blog/index.php?pk=58511&T=0

Globally Unique Identifier (entire table): ba.freestatistics.org/blog/index.php?pk=58511&T=0

As an alternative you can also use a QR Code:  

The GUIDs for individual cells are displayed in the table below:

Summary of computational transaction
Raw Inputview raw input (R code)
Raw Outputview raw output of R engine
Computing time4 seconds
R Server'Gwilym Jenkins' @ 72.249.127.135


Multiple Linear Regression - Estimated Regression Equation
inv[t] = -98.6031754376958 + 1.81249154252463cons[t] -10.1515734108020M1[t] -10.2323024500268M2[t] -10.1369413355362M3[t] -7.44036083710648M4[t] -8.40747637998386M5[t] -1.19343749233295M6[t] + 8.4281775125963M7[t] + 1.59241261367585M8[t] + 5.03144811833661M9[t] + 6.55181126262129M10[t] + 9.91851760828455M11[t] + 0.122127045043892t + e[t]

\begin{tabular}{lllllllll}
\hline
Multiple Linear Regression - Estimated Regression Equation \tabularnewline
inv[t] =  -98.6031754376958 +  1.81249154252463cons[t] -10.1515734108020M1[t] -10.2323024500268M2[t] -10.1369413355362M3[t] -7.44036083710648M4[t] -8.40747637998386M5[t] -1.19343749233295M6[t] +  8.4281775125963M7[t] +  1.59241261367585M8[t] +  5.03144811833661M9[t] +  6.55181126262129M10[t] +  9.91851760828455M11[t] +  0.122127045043892t  + e[t] \tabularnewline
\hline
\end{tabular}
%Source: https://freestatistics.org/blog/index.php?pk=58511&T=1

[TABLE]
[ROW][C]Multiple Linear Regression - Estimated Regression Equation[/C][/ROW]
[ROW][C]inv[t] =  -98.6031754376958 +  1.81249154252463cons[t] -10.1515734108020M1[t] -10.2323024500268M2[t] -10.1369413355362M3[t] -7.44036083710648M4[t] -8.40747637998386M5[t] -1.19343749233295M6[t] +  8.4281775125963M7[t] +  1.59241261367585M8[t] +  5.03144811833661M9[t] +  6.55181126262129M10[t] +  9.91851760828455M11[t] +  0.122127045043892t  + e[t][/C][/ROW]
[/TABLE]
Source: https://freestatistics.org/blog/index.php?pk=58511&T=1

Globally Unique Identifier (entire table): ba.freestatistics.org/blog/index.php?pk=58511&T=1

As an alternative you can also use a QR Code:  

The GUIDs for individual cells are displayed in the table below:

Multiple Linear Regression - Estimated Regression Equation
inv[t] = -98.6031754376958 + 1.81249154252463cons[t] -10.1515734108020M1[t] -10.2323024500268M2[t] -10.1369413355362M3[t] -7.44036083710648M4[t] -8.40747637998386M5[t] -1.19343749233295M6[t] + 8.4281775125963M7[t] + 1.59241261367585M8[t] + 5.03144811833661M9[t] + 6.55181126262129M10[t] + 9.91851760828455M11[t] + 0.122127045043892t + e[t]


Multiple Linear Regression - Ordinary Least Squares
VariableParameterS.D.T-STATH0: parameter = 02-tail p-value1-tail p-value
(Intercept)-98.603175437695829.989951-3.28790.0019390.00097
cons1.812491542524630.2813356.442500
M1-10.15157341080206.604696-1.5370.1311380.065569
M2-10.23230245002688.846138-1.15670.2533680.126684
M3-10.13694133553628.570762-1.18270.2429910.121496
M4-7.440360837106487.712021-0.96480.3397030.169851
M5-8.407476379983867.913696-1.06240.2936020.146801
M6-1.193437492332956.703974-0.1780.8594890.429745
M78.42817751259636.6332681.27060.2102630.105131
M81.592412613675858.2846020.19220.8484210.42421
M95.031448118336616.8469580.73480.4661640.233082
M106.551811262621296.7411490.97190.3361770.168088
M119.918517608284557.9805171.24280.2202240.110112
t0.1221270450438920.0783711.55830.1260110.063005

\begin{tabular}{lllllllll}
\hline
Multiple Linear Regression - Ordinary Least Squares \tabularnewline
Variable & Parameter & S.D. & T-STATH0: parameter = 0 & 2-tail p-value & 1-tail p-value \tabularnewline
(Intercept) & -98.6031754376958 & 29.989951 & -3.2879 & 0.001939 & 0.00097 \tabularnewline
cons & 1.81249154252463 & 0.281335 & 6.4425 & 0 & 0 \tabularnewline
M1 & -10.1515734108020 & 6.604696 & -1.537 & 0.131138 & 0.065569 \tabularnewline
M2 & -10.2323024500268 & 8.846138 & -1.1567 & 0.253368 & 0.126684 \tabularnewline
M3 & -10.1369413355362 & 8.570762 & -1.1827 & 0.242991 & 0.121496 \tabularnewline
M4 & -7.44036083710648 & 7.712021 & -0.9648 & 0.339703 & 0.169851 \tabularnewline
M5 & -8.40747637998386 & 7.913696 & -1.0624 & 0.293602 & 0.146801 \tabularnewline
M6 & -1.19343749233295 & 6.703974 & -0.178 & 0.859489 & 0.429745 \tabularnewline
M7 & 8.4281775125963 & 6.633268 & 1.2706 & 0.210263 & 0.105131 \tabularnewline
M8 & 1.59241261367585 & 8.284602 & 0.1922 & 0.848421 & 0.42421 \tabularnewline
M9 & 5.03144811833661 & 6.846958 & 0.7348 & 0.466164 & 0.233082 \tabularnewline
M10 & 6.55181126262129 & 6.741149 & 0.9719 & 0.336177 & 0.168088 \tabularnewline
M11 & 9.91851760828455 & 7.980517 & 1.2428 & 0.220224 & 0.110112 \tabularnewline
t & 0.122127045043892 & 0.078371 & 1.5583 & 0.126011 & 0.063005 \tabularnewline
\hline
\end{tabular}
%Source: https://freestatistics.org/blog/index.php?pk=58511&T=2

[TABLE]
[ROW][C]Multiple Linear Regression - Ordinary Least Squares[/C][/ROW]
[ROW][C]Variable[/C][C]Parameter[/C][C]S.D.[/C][C]T-STATH0: parameter = 0[/C][C]2-tail p-value[/C][C]1-tail p-value[/C][/ROW]
[ROW][C](Intercept)[/C][C]-98.6031754376958[/C][C]29.989951[/C][C]-3.2879[/C][C]0.001939[/C][C]0.00097[/C][/ROW]
[ROW][C]cons[/C][C]1.81249154252463[/C][C]0.281335[/C][C]6.4425[/C][C]0[/C][C]0[/C][/ROW]
[ROW][C]M1[/C][C]-10.1515734108020[/C][C]6.604696[/C][C]-1.537[/C][C]0.131138[/C][C]0.065569[/C][/ROW]
[ROW][C]M2[/C][C]-10.2323024500268[/C][C]8.846138[/C][C]-1.1567[/C][C]0.253368[/C][C]0.126684[/C][/ROW]
[ROW][C]M3[/C][C]-10.1369413355362[/C][C]8.570762[/C][C]-1.1827[/C][C]0.242991[/C][C]0.121496[/C][/ROW]
[ROW][C]M4[/C][C]-7.44036083710648[/C][C]7.712021[/C][C]-0.9648[/C][C]0.339703[/C][C]0.169851[/C][/ROW]
[ROW][C]M5[/C][C]-8.40747637998386[/C][C]7.913696[/C][C]-1.0624[/C][C]0.293602[/C][C]0.146801[/C][/ROW]
[ROW][C]M6[/C][C]-1.19343749233295[/C][C]6.703974[/C][C]-0.178[/C][C]0.859489[/C][C]0.429745[/C][/ROW]
[ROW][C]M7[/C][C]8.4281775125963[/C][C]6.633268[/C][C]1.2706[/C][C]0.210263[/C][C]0.105131[/C][/ROW]
[ROW][C]M8[/C][C]1.59241261367585[/C][C]8.284602[/C][C]0.1922[/C][C]0.848421[/C][C]0.42421[/C][/ROW]
[ROW][C]M9[/C][C]5.03144811833661[/C][C]6.846958[/C][C]0.7348[/C][C]0.466164[/C][C]0.233082[/C][/ROW]
[ROW][C]M10[/C][C]6.55181126262129[/C][C]6.741149[/C][C]0.9719[/C][C]0.336177[/C][C]0.168088[/C][/ROW]
[ROW][C]M11[/C][C]9.91851760828455[/C][C]7.980517[/C][C]1.2428[/C][C]0.220224[/C][C]0.110112[/C][/ROW]
[ROW][C]t[/C][C]0.122127045043892[/C][C]0.078371[/C][C]1.5583[/C][C]0.126011[/C][C]0.063005[/C][/ROW]
[/TABLE]
Source: https://freestatistics.org/blog/index.php?pk=58511&T=2

Globally Unique Identifier (entire table): ba.freestatistics.org/blog/index.php?pk=58511&T=2

As an alternative you can also use a QR Code:  

The GUIDs for individual cells are displayed in the table below:

Multiple Linear Regression - Ordinary Least Squares
VariableParameterS.D.T-STATH0: parameter = 02-tail p-value1-tail p-value
(Intercept)-98.603175437695829.989951-3.28790.0019390.00097
cons1.812491542524630.2813356.442500
M1-10.15157341080206.604696-1.5370.1311380.065569
M2-10.23230245002688.846138-1.15670.2533680.126684
M3-10.13694133553628.570762-1.18270.2429910.121496
M4-7.440360837106487.712021-0.96480.3397030.169851
M5-8.407476379983867.913696-1.06240.2936020.146801
M6-1.193437492332956.703974-0.1780.8594890.429745
M78.42817751259636.6332681.27060.2102630.105131
M81.592412613675858.2846020.19220.8484210.42421
M95.031448118336616.8469580.73480.4661640.233082
M106.551811262621296.7411490.97190.3361770.168088
M119.918517608284557.9805171.24280.2202240.110112
t0.1221270450438920.0783711.55830.1260110.063005


Multiple Linear Regression - Regression Statistics
Multiple R0.86276085439231
R-squared0.744356291871749
Adjusted R-squared0.67210915696594
F-TEST (value)10.3029177951787
F-TEST (DF numerator)13
F-TEST (DF denominator)46
p-value1.11456865958814e-09
Multiple Linear Regression - Residual Statistics
Residual Standard Deviation10.2131534985726
Sum Squared Residuals4798.19120172865

\begin{tabular}{lllllllll}
\hline
Multiple Linear Regression - Regression Statistics \tabularnewline
Multiple R & 0.86276085439231 \tabularnewline
R-squared & 0.744356291871749 \tabularnewline
Adjusted R-squared & 0.67210915696594 \tabularnewline
F-TEST (value) & 10.3029177951787 \tabularnewline
F-TEST (DF numerator) & 13 \tabularnewline
F-TEST (DF denominator) & 46 \tabularnewline
p-value & 1.11456865958814e-09 \tabularnewline
Multiple Linear Regression - Residual Statistics \tabularnewline
Residual Standard Deviation & 10.2131534985726 \tabularnewline
Sum Squared Residuals & 4798.19120172865 \tabularnewline
\hline
\end{tabular}
%Source: https://freestatistics.org/blog/index.php?pk=58511&T=3

[TABLE]
[ROW][C]Multiple Linear Regression - Regression Statistics[/C][/ROW]
[ROW][C]Multiple R[/C][C]0.86276085439231[/C][/ROW]
[ROW][C]R-squared[/C][C]0.744356291871749[/C][/ROW]
[ROW][C]Adjusted R-squared[/C][C]0.67210915696594[/C][/ROW]
[ROW][C]F-TEST (value)[/C][C]10.3029177951787[/C][/ROW]
[ROW][C]F-TEST (DF numerator)[/C][C]13[/C][/ROW]
[ROW][C]F-TEST (DF denominator)[/C][C]46[/C][/ROW]
[ROW][C]p-value[/C][C]1.11456865958814e-09[/C][/ROW]
[ROW][C]Multiple Linear Regression - Residual Statistics[/C][/ROW]
[ROW][C]Residual Standard Deviation[/C][C]10.2131534985726[/C][/ROW]
[ROW][C]Sum Squared Residuals[/C][C]4798.19120172865[/C][/ROW]
[/TABLE]
Source: https://freestatistics.org/blog/index.php?pk=58511&T=3

Globally Unique Identifier (entire table): ba.freestatistics.org/blog/index.php?pk=58511&T=3

As an alternative you can also use a QR Code:  

The GUIDs for individual cells are displayed in the table below:

Multiple Linear Regression - Regression Statistics
Multiple R0.86276085439231
R-squared0.744356291871749
Adjusted R-squared0.67210915696594
F-TEST (value)10.3029177951787
F-TEST (DF numerator)13
F-TEST (DF denominator)46
p-value1.11456865958814e-09
Multiple Linear Regression - Residual Statistics
Residual Standard Deviation10.2131534985726
Sum Squared Residuals4798.19120172865


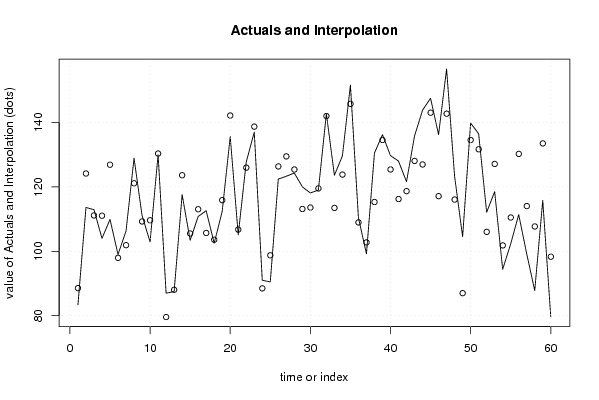
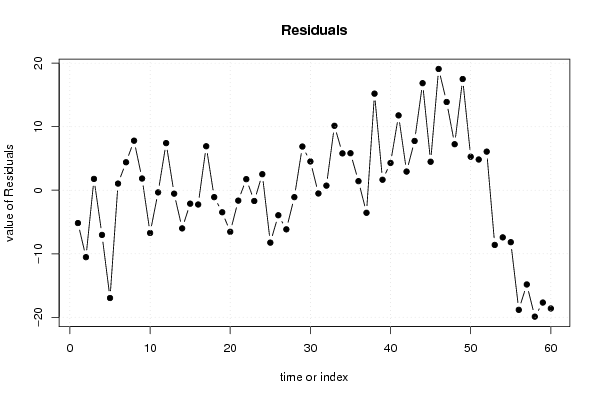
Multiple Linear Regression - Actuals, Interpolation, and Residuals
Time or IndexActualsInterpolationForecastResidualsPrediction Error
183.488.5664580232261-5.16645802322608
2113.6124.132690262528-10.5326902625276
3112.9111.1189901616321.7810098383677
4104111.037711237067-7.03771123706654
5109.9126.867644930460-16.9676449304596
69997.95398001266191.04601998733814
7106.3101.8977491265564.40225087344379
8128.9121.1027403307827.79725966921819
9111.1109.2577247690271.84227523097287
10102.9109.631470878588-6.73147087858845
11130130.338973923280-0.338973923279582
128779.58027449898237.41972550101768
1387.588.0382418669755-0.538241866975468
14117.6123.604474106277-6.00447410627726
15103.4105.515797686313-2.11579768631297
16110.8113.046983240351-2.24698324035063
17112.6105.6770251894286.92297481057151
18102.5103.588235100995-1.08823510099521
19112.4115.869465310503-3.46946531050285
20135.6142.143173530575-6.54317353057452
21105.1106.735767916000-1.63576791599965
22127.7125.9594260678171.74057393218288
23137138.6919663254-1.6919663253999
249188.477014363862.52298563614
2590.598.7474732743778-8.24747327437777
26122.4126.338742726571-3.93874272657119
27123.3129.456217354145-6.15621735414507
28124.3125.387457036025-1.08745703602511
29120113.1237718202866.87622817971354
30118.1113.5724698913884.52753010861231
31119119.509979702059-0.509979702059099
32142.7141.9774556828290.722544317170941
33123.6113.45751792984810.1424820701522
34129.6123.7999675232955.80003247670542
35151.6145.7762146477535.82378535224705
36110.4108.9737001008951.42629989910470
3799.2102.750485974439-3.55048597443897
38130.5115.29807562367815.2019243763221
39136.2134.5467249797211.65327502027895
40129.7125.4029883425324.29701165746787
41128116.22053874908511.7794612509147
42121.6118.6629775169642.93702248303635
43135.8128.0442212584327.75577874156814
44143.8126.94930718638216.8506928136184
45147.5143.0166613795064.48333862049376
46136.2117.10928012246019.0907198775395
47156.6142.71051033196813.8894896680319
48123.3116.0579484232487.24205157675162
49104.586.997340860981717.5026591390183
50139.8134.5260172809465.27398271905397
51136.5131.6622698181894.83773018181137
52112.1106.0248601440266.0751398559744
53118.5127.11101931074-8.6110193107401
5494.4101.822337477992-7.42233747799158
55102.3110.47858460245-8.17858460244998
56111.4130.227323269433-18.8273232694330
5799.2114.032328005619-14.8323280056192
5887.8107.699855407839-19.8998554078394
59115.8133.482334771599-17.6823347715995
6079.798.311062613014-18.611062613014

\begin{tabular}{lllllllll}
\hline
Multiple Linear Regression - Actuals, Interpolation, and Residuals \tabularnewline
Time or Index & Actuals & InterpolationForecast & ResidualsPrediction Error \tabularnewline
1 & 83.4 & 88.5664580232261 & -5.16645802322608 \tabularnewline
2 & 113.6 & 124.132690262528 & -10.5326902625276 \tabularnewline
3 & 112.9 & 111.118990161632 & 1.7810098383677 \tabularnewline
4 & 104 & 111.037711237067 & -7.03771123706654 \tabularnewline
5 & 109.9 & 126.867644930460 & -16.9676449304596 \tabularnewline
6 & 99 & 97.9539800126619 & 1.04601998733814 \tabularnewline
7 & 106.3 & 101.897749126556 & 4.40225087344379 \tabularnewline
8 & 128.9 & 121.102740330782 & 7.79725966921819 \tabularnewline
9 & 111.1 & 109.257724769027 & 1.84227523097287 \tabularnewline
10 & 102.9 & 109.631470878588 & -6.73147087858845 \tabularnewline
11 & 130 & 130.338973923280 & -0.338973923279582 \tabularnewline
12 & 87 & 79.5802744989823 & 7.41972550101768 \tabularnewline
13 & 87.5 & 88.0382418669755 & -0.538241866975468 \tabularnewline
14 & 117.6 & 123.604474106277 & -6.00447410627726 \tabularnewline
15 & 103.4 & 105.515797686313 & -2.11579768631297 \tabularnewline
16 & 110.8 & 113.046983240351 & -2.24698324035063 \tabularnewline
17 & 112.6 & 105.677025189428 & 6.92297481057151 \tabularnewline
18 & 102.5 & 103.588235100995 & -1.08823510099521 \tabularnewline
19 & 112.4 & 115.869465310503 & -3.46946531050285 \tabularnewline
20 & 135.6 & 142.143173530575 & -6.54317353057452 \tabularnewline
21 & 105.1 & 106.735767916000 & -1.63576791599965 \tabularnewline
22 & 127.7 & 125.959426067817 & 1.74057393218288 \tabularnewline
23 & 137 & 138.6919663254 & -1.6919663253999 \tabularnewline
24 & 91 & 88.47701436386 & 2.52298563614 \tabularnewline
25 & 90.5 & 98.7474732743778 & -8.24747327437777 \tabularnewline
26 & 122.4 & 126.338742726571 & -3.93874272657119 \tabularnewline
27 & 123.3 & 129.456217354145 & -6.15621735414507 \tabularnewline
28 & 124.3 & 125.387457036025 & -1.08745703602511 \tabularnewline
29 & 120 & 113.123771820286 & 6.87622817971354 \tabularnewline
30 & 118.1 & 113.572469891388 & 4.52753010861231 \tabularnewline
31 & 119 & 119.509979702059 & -0.509979702059099 \tabularnewline
32 & 142.7 & 141.977455682829 & 0.722544317170941 \tabularnewline
33 & 123.6 & 113.457517929848 & 10.1424820701522 \tabularnewline
34 & 129.6 & 123.799967523295 & 5.80003247670542 \tabularnewline
35 & 151.6 & 145.776214647753 & 5.82378535224705 \tabularnewline
36 & 110.4 & 108.973700100895 & 1.42629989910470 \tabularnewline
37 & 99.2 & 102.750485974439 & -3.55048597443897 \tabularnewline
38 & 130.5 & 115.298075623678 & 15.2019243763221 \tabularnewline
39 & 136.2 & 134.546724979721 & 1.65327502027895 \tabularnewline
40 & 129.7 & 125.402988342532 & 4.29701165746787 \tabularnewline
41 & 128 & 116.220538749085 & 11.7794612509147 \tabularnewline
42 & 121.6 & 118.662977516964 & 2.93702248303635 \tabularnewline
43 & 135.8 & 128.044221258432 & 7.75577874156814 \tabularnewline
44 & 143.8 & 126.949307186382 & 16.8506928136184 \tabularnewline
45 & 147.5 & 143.016661379506 & 4.48333862049376 \tabularnewline
46 & 136.2 & 117.109280122460 & 19.0907198775395 \tabularnewline
47 & 156.6 & 142.710510331968 & 13.8894896680319 \tabularnewline
48 & 123.3 & 116.057948423248 & 7.24205157675162 \tabularnewline
49 & 104.5 & 86.9973408609817 & 17.5026591390183 \tabularnewline
50 & 139.8 & 134.526017280946 & 5.27398271905397 \tabularnewline
51 & 136.5 & 131.662269818189 & 4.83773018181137 \tabularnewline
52 & 112.1 & 106.024860144026 & 6.0751398559744 \tabularnewline
53 & 118.5 & 127.11101931074 & -8.6110193107401 \tabularnewline
54 & 94.4 & 101.822337477992 & -7.42233747799158 \tabularnewline
55 & 102.3 & 110.47858460245 & -8.17858460244998 \tabularnewline
56 & 111.4 & 130.227323269433 & -18.8273232694330 \tabularnewline
57 & 99.2 & 114.032328005619 & -14.8323280056192 \tabularnewline
58 & 87.8 & 107.699855407839 & -19.8998554078394 \tabularnewline
59 & 115.8 & 133.482334771599 & -17.6823347715995 \tabularnewline
60 & 79.7 & 98.311062613014 & -18.611062613014 \tabularnewline
\hline
\end{tabular}
%Source: https://freestatistics.org/blog/index.php?pk=58511&T=4

[TABLE]
[ROW][C]Multiple Linear Regression - Actuals, Interpolation, and Residuals[/C][/ROW]
[ROW][C]Time or Index[/C][C]Actuals[/C][C]InterpolationForecast[/C][C]ResidualsPrediction Error[/C][/ROW]
[ROW][C]1[/C][C]83.4[/C][C]88.5664580232261[/C][C]-5.16645802322608[/C][/ROW]
[ROW][C]2[/C][C]113.6[/C][C]124.132690262528[/C][C]-10.5326902625276[/C][/ROW]
[ROW][C]3[/C][C]112.9[/C][C]111.118990161632[/C][C]1.7810098383677[/C][/ROW]
[ROW][C]4[/C][C]104[/C][C]111.037711237067[/C][C]-7.03771123706654[/C][/ROW]
[ROW][C]5[/C][C]109.9[/C][C]126.867644930460[/C][C]-16.9676449304596[/C][/ROW]
[ROW][C]6[/C][C]99[/C][C]97.9539800126619[/C][C]1.04601998733814[/C][/ROW]
[ROW][C]7[/C][C]106.3[/C][C]101.897749126556[/C][C]4.40225087344379[/C][/ROW]
[ROW][C]8[/C][C]128.9[/C][C]121.102740330782[/C][C]7.79725966921819[/C][/ROW]
[ROW][C]9[/C][C]111.1[/C][C]109.257724769027[/C][C]1.84227523097287[/C][/ROW]
[ROW][C]10[/C][C]102.9[/C][C]109.631470878588[/C][C]-6.73147087858845[/C][/ROW]
[ROW][C]11[/C][C]130[/C][C]130.338973923280[/C][C]-0.338973923279582[/C][/ROW]
[ROW][C]12[/C][C]87[/C][C]79.5802744989823[/C][C]7.41972550101768[/C][/ROW]
[ROW][C]13[/C][C]87.5[/C][C]88.0382418669755[/C][C]-0.538241866975468[/C][/ROW]
[ROW][C]14[/C][C]117.6[/C][C]123.604474106277[/C][C]-6.00447410627726[/C][/ROW]
[ROW][C]15[/C][C]103.4[/C][C]105.515797686313[/C][C]-2.11579768631297[/C][/ROW]
[ROW][C]16[/C][C]110.8[/C][C]113.046983240351[/C][C]-2.24698324035063[/C][/ROW]
[ROW][C]17[/C][C]112.6[/C][C]105.677025189428[/C][C]6.92297481057151[/C][/ROW]
[ROW][C]18[/C][C]102.5[/C][C]103.588235100995[/C][C]-1.08823510099521[/C][/ROW]
[ROW][C]19[/C][C]112.4[/C][C]115.869465310503[/C][C]-3.46946531050285[/C][/ROW]
[ROW][C]20[/C][C]135.6[/C][C]142.143173530575[/C][C]-6.54317353057452[/C][/ROW]
[ROW][C]21[/C][C]105.1[/C][C]106.735767916000[/C][C]-1.63576791599965[/C][/ROW]
[ROW][C]22[/C][C]127.7[/C][C]125.959426067817[/C][C]1.74057393218288[/C][/ROW]
[ROW][C]23[/C][C]137[/C][C]138.6919663254[/C][C]-1.6919663253999[/C][/ROW]
[ROW][C]24[/C][C]91[/C][C]88.47701436386[/C][C]2.52298563614[/C][/ROW]
[ROW][C]25[/C][C]90.5[/C][C]98.7474732743778[/C][C]-8.24747327437777[/C][/ROW]
[ROW][C]26[/C][C]122.4[/C][C]126.338742726571[/C][C]-3.93874272657119[/C][/ROW]
[ROW][C]27[/C][C]123.3[/C][C]129.456217354145[/C][C]-6.15621735414507[/C][/ROW]
[ROW][C]28[/C][C]124.3[/C][C]125.387457036025[/C][C]-1.08745703602511[/C][/ROW]
[ROW][C]29[/C][C]120[/C][C]113.123771820286[/C][C]6.87622817971354[/C][/ROW]
[ROW][C]30[/C][C]118.1[/C][C]113.572469891388[/C][C]4.52753010861231[/C][/ROW]
[ROW][C]31[/C][C]119[/C][C]119.509979702059[/C][C]-0.509979702059099[/C][/ROW]
[ROW][C]32[/C][C]142.7[/C][C]141.977455682829[/C][C]0.722544317170941[/C][/ROW]
[ROW][C]33[/C][C]123.6[/C][C]113.457517929848[/C][C]10.1424820701522[/C][/ROW]
[ROW][C]34[/C][C]129.6[/C][C]123.799967523295[/C][C]5.80003247670542[/C][/ROW]
[ROW][C]35[/C][C]151.6[/C][C]145.776214647753[/C][C]5.82378535224705[/C][/ROW]
[ROW][C]36[/C][C]110.4[/C][C]108.973700100895[/C][C]1.42629989910470[/C][/ROW]
[ROW][C]37[/C][C]99.2[/C][C]102.750485974439[/C][C]-3.55048597443897[/C][/ROW]
[ROW][C]38[/C][C]130.5[/C][C]115.298075623678[/C][C]15.2019243763221[/C][/ROW]
[ROW][C]39[/C][C]136.2[/C][C]134.546724979721[/C][C]1.65327502027895[/C][/ROW]
[ROW][C]40[/C][C]129.7[/C][C]125.402988342532[/C][C]4.29701165746787[/C][/ROW]
[ROW][C]41[/C][C]128[/C][C]116.220538749085[/C][C]11.7794612509147[/C][/ROW]
[ROW][C]42[/C][C]121.6[/C][C]118.662977516964[/C][C]2.93702248303635[/C][/ROW]
[ROW][C]43[/C][C]135.8[/C][C]128.044221258432[/C][C]7.75577874156814[/C][/ROW]
[ROW][C]44[/C][C]143.8[/C][C]126.949307186382[/C][C]16.8506928136184[/C][/ROW]
[ROW][C]45[/C][C]147.5[/C][C]143.016661379506[/C][C]4.48333862049376[/C][/ROW]
[ROW][C]46[/C][C]136.2[/C][C]117.109280122460[/C][C]19.0907198775395[/C][/ROW]
[ROW][C]47[/C][C]156.6[/C][C]142.710510331968[/C][C]13.8894896680319[/C][/ROW]
[ROW][C]48[/C][C]123.3[/C][C]116.057948423248[/C][C]7.24205157675162[/C][/ROW]
[ROW][C]49[/C][C]104.5[/C][C]86.9973408609817[/C][C]17.5026591390183[/C][/ROW]
[ROW][C]50[/C][C]139.8[/C][C]134.526017280946[/C][C]5.27398271905397[/C][/ROW]
[ROW][C]51[/C][C]136.5[/C][C]131.662269818189[/C][C]4.83773018181137[/C][/ROW]
[ROW][C]52[/C][C]112.1[/C][C]106.024860144026[/C][C]6.0751398559744[/C][/ROW]
[ROW][C]53[/C][C]118.5[/C][C]127.11101931074[/C][C]-8.6110193107401[/C][/ROW]
[ROW][C]54[/C][C]94.4[/C][C]101.822337477992[/C][C]-7.42233747799158[/C][/ROW]
[ROW][C]55[/C][C]102.3[/C][C]110.47858460245[/C][C]-8.17858460244998[/C][/ROW]
[ROW][C]56[/C][C]111.4[/C][C]130.227323269433[/C][C]-18.8273232694330[/C][/ROW]
[ROW][C]57[/C][C]99.2[/C][C]114.032328005619[/C][C]-14.8323280056192[/C][/ROW]
[ROW][C]58[/C][C]87.8[/C][C]107.699855407839[/C][C]-19.8998554078394[/C][/ROW]
[ROW][C]59[/C][C]115.8[/C][C]133.482334771599[/C][C]-17.6823347715995[/C][/ROW]
[ROW][C]60[/C][C]79.7[/C][C]98.311062613014[/C][C]-18.611062613014[/C][/ROW]
[/TABLE]
Source: https://freestatistics.org/blog/index.php?pk=58511&T=4

Globally Unique Identifier (entire table): ba.freestatistics.org/blog/index.php?pk=58511&T=4

As an alternative you can also use a QR Code:  

The GUIDs for individual cells are displayed in the table below:

Multiple Linear Regression - Actuals, Interpolation, and Residuals
Time or IndexActualsInterpolationForecastResidualsPrediction Error
183.488.5664580232261-5.16645802322608
2113.6124.132690262528-10.5326902625276
3112.9111.1189901616321.7810098383677
4104111.037711237067-7.03771123706654
5109.9126.867644930460-16.9676449304596
69997.95398001266191.04601998733814
7106.3101.8977491265564.40225087344379
8128.9121.1027403307827.79725966921819
9111.1109.2577247690271.84227523097287
10102.9109.631470878588-6.73147087858845
11130130.338973923280-0.338973923279582
128779.58027449898237.41972550101768
1387.588.0382418669755-0.538241866975468
14117.6123.604474106277-6.00447410627726
15103.4105.515797686313-2.11579768631297
16110.8113.046983240351-2.24698324035063
17112.6105.6770251894286.92297481057151
18102.5103.588235100995-1.08823510099521
19112.4115.869465310503-3.46946531050285
20135.6142.143173530575-6.54317353057452
21105.1106.735767916000-1.63576791599965
22127.7125.9594260678171.74057393218288
23137138.6919663254-1.6919663253999
249188.477014363862.52298563614
2590.598.7474732743778-8.24747327437777
26122.4126.338742726571-3.93874272657119
27123.3129.456217354145-6.15621735414507
28124.3125.387457036025-1.08745703602511
29120113.1237718202866.87622817971354
30118.1113.5724698913884.52753010861231
31119119.509979702059-0.509979702059099
32142.7141.9774556828290.722544317170941
33123.6113.45751792984810.1424820701522
34129.6123.7999675232955.80003247670542
35151.6145.7762146477535.82378535224705
36110.4108.9737001008951.42629989910470
3799.2102.750485974439-3.55048597443897
38130.5115.29807562367815.2019243763221
39136.2134.5467249797211.65327502027895
40129.7125.4029883425324.29701165746787
41128116.22053874908511.7794612509147
42121.6118.6629775169642.93702248303635
43135.8128.0442212584327.75577874156814
44143.8126.94930718638216.8506928136184
45147.5143.0166613795064.48333862049376
46136.2117.10928012246019.0907198775395
47156.6142.71051033196813.8894896680319
48123.3116.0579484232487.24205157675162
49104.586.997340860981717.5026591390183
50139.8134.5260172809465.27398271905397
51136.5131.6622698181894.83773018181137
52112.1106.0248601440266.0751398559744
53118.5127.11101931074-8.6110193107401
5494.4101.822337477992-7.42233747799158
55102.3110.47858460245-8.17858460244998
56111.4130.227323269433-18.8273232694330
5799.2114.032328005619-14.8323280056192
5887.8107.699855407839-19.8998554078394
59115.8133.482334771599-17.6823347715995
6079.798.311062613014-18.611062613014


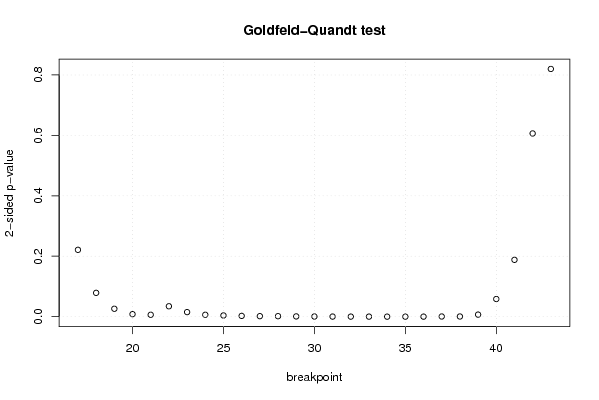
Goldfeld-Quandt test for Heteroskedasticity
p-valuesAlternative Hypothesis
breakpoint indexgreater2-sidedless
170.1105989952040150.2211979904080310.889401004795985
180.03940885648739290.07881771297478580.960591143512607
190.01306721672307930.02613443344615860.98693278327692
200.004124957304581850.00824991460916370.995875042695418
210.003121903834058960.006243807668117920.99687809616594
220.01719375782538760.03438751565077520.982806242174612
230.007551963252635730.01510392650527150.992448036747364
240.003093725043500470.006187450087000950.9969062749565
250.001976741207177980.003953482414355970.998023258792822
260.001290960280399290.002581920560798590.9987090397196
270.0008100876601933260.001620175320386650.999189912339807
280.0007965984874669470.001593196974933890.999203401512533
290.0004115496871912790.0008230993743825580.999588450312809
300.0002468413086314140.0004936826172628280.999753158691369
310.0001322822200333310.0002645644400666630.999867717779967
326.61612990178008e-050.0001323225980356020.999933838700982
334.02360403236123e-058.04720806472245e-050.999959763959676
342.34080956225199e-054.68161912450399e-050.999976591904377
351.68394153099284e-053.36788306198569e-050.99998316058469
361.20754593279287e-052.41509186558574e-050.999987924540672
370.0002576666593854390.0005153333187708790.999742333340615
380.0002726086504483510.0005452173008967020.999727391349552
390.003378923496030560.006757846992061120.99662107650397
400.02921905634714650.0584381126942930.970780943652854
410.0940707118549130.1881414237098260.905929288145087
420.3032377902617060.6064755805234130.696762209738294
430.5899933263100430.8200133473799140.410006673689957

\begin{tabular}{lllllllll}
\hline
Goldfeld-Quandt test for Heteroskedasticity \tabularnewline
p-values & Alternative Hypothesis \tabularnewline
breakpoint index & greater & 2-sided & less \tabularnewline
17 & 0.110598995204015 & 0.221197990408031 & 0.889401004795985 \tabularnewline
18 & 0.0394088564873929 & 0.0788177129747858 & 0.960591143512607 \tabularnewline
19 & 0.0130672167230793 & 0.0261344334461586 & 0.98693278327692 \tabularnewline
20 & 0.00412495730458185 & 0.0082499146091637 & 0.995875042695418 \tabularnewline
21 & 0.00312190383405896 & 0.00624380766811792 & 0.99687809616594 \tabularnewline
22 & 0.0171937578253876 & 0.0343875156507752 & 0.982806242174612 \tabularnewline
23 & 0.00755196325263573 & 0.0151039265052715 & 0.992448036747364 \tabularnewline
24 & 0.00309372504350047 & 0.00618745008700095 & 0.9969062749565 \tabularnewline
25 & 0.00197674120717798 & 0.00395348241435597 & 0.998023258792822 \tabularnewline
26 & 0.00129096028039929 & 0.00258192056079859 & 0.9987090397196 \tabularnewline
27 & 0.000810087660193326 & 0.00162017532038665 & 0.999189912339807 \tabularnewline
28 & 0.000796598487466947 & 0.00159319697493389 & 0.999203401512533 \tabularnewline
29 & 0.000411549687191279 & 0.000823099374382558 & 0.999588450312809 \tabularnewline
30 & 0.000246841308631414 & 0.000493682617262828 & 0.999753158691369 \tabularnewline
31 & 0.000132282220033331 & 0.000264564440066663 & 0.999867717779967 \tabularnewline
32 & 6.61612990178008e-05 & 0.000132322598035602 & 0.999933838700982 \tabularnewline
33 & 4.02360403236123e-05 & 8.04720806472245e-05 & 0.999959763959676 \tabularnewline
34 & 2.34080956225199e-05 & 4.68161912450399e-05 & 0.999976591904377 \tabularnewline
35 & 1.68394153099284e-05 & 3.36788306198569e-05 & 0.99998316058469 \tabularnewline
36 & 1.20754593279287e-05 & 2.41509186558574e-05 & 0.999987924540672 \tabularnewline
37 & 0.000257666659385439 & 0.000515333318770879 & 0.999742333340615 \tabularnewline
38 & 0.000272608650448351 & 0.000545217300896702 & 0.999727391349552 \tabularnewline
39 & 0.00337892349603056 & 0.00675784699206112 & 0.99662107650397 \tabularnewline
40 & 0.0292190563471465 & 0.058438112694293 & 0.970780943652854 \tabularnewline
41 & 0.094070711854913 & 0.188141423709826 & 0.905929288145087 \tabularnewline
42 & 0.303237790261706 & 0.606475580523413 & 0.696762209738294 \tabularnewline
43 & 0.589993326310043 & 0.820013347379914 & 0.410006673689957 \tabularnewline
\hline
\end{tabular}
%Source: https://freestatistics.org/blog/index.php?pk=58511&T=5

[TABLE]
[ROW][C]Goldfeld-Quandt test for Heteroskedasticity[/C][/ROW]
[ROW][C]p-values[/C][C]Alternative Hypothesis[/C][/ROW]
[ROW][C]breakpoint index[/C][C]greater[/C][C]2-sided[/C][C]less[/C][/ROW]
[ROW][C]17[/C][C]0.110598995204015[/C][C]0.221197990408031[/C][C]0.889401004795985[/C][/ROW]
[ROW][C]18[/C][C]0.0394088564873929[/C][C]0.0788177129747858[/C][C]0.960591143512607[/C][/ROW]
[ROW][C]19[/C][C]0.0130672167230793[/C][C]0.0261344334461586[/C][C]0.98693278327692[/C][/ROW]
[ROW][C]20[/C][C]0.00412495730458185[/C][C]0.0082499146091637[/C][C]0.995875042695418[/C][/ROW]
[ROW][C]21[/C][C]0.00312190383405896[/C][C]0.00624380766811792[/C][C]0.99687809616594[/C][/ROW]
[ROW][C]22[/C][C]0.0171937578253876[/C][C]0.0343875156507752[/C][C]0.982806242174612[/C][/ROW]
[ROW][C]23[/C][C]0.00755196325263573[/C][C]0.0151039265052715[/C][C]0.992448036747364[/C][/ROW]
[ROW][C]24[/C][C]0.00309372504350047[/C][C]0.00618745008700095[/C][C]0.9969062749565[/C][/ROW]
[ROW][C]25[/C][C]0.00197674120717798[/C][C]0.00395348241435597[/C][C]0.998023258792822[/C][/ROW]
[ROW][C]26[/C][C]0.00129096028039929[/C][C]0.00258192056079859[/C][C]0.9987090397196[/C][/ROW]
[ROW][C]27[/C][C]0.000810087660193326[/C][C]0.00162017532038665[/C][C]0.999189912339807[/C][/ROW]
[ROW][C]28[/C][C]0.000796598487466947[/C][C]0.00159319697493389[/C][C]0.999203401512533[/C][/ROW]
[ROW][C]29[/C][C]0.000411549687191279[/C][C]0.000823099374382558[/C][C]0.999588450312809[/C][/ROW]
[ROW][C]30[/C][C]0.000246841308631414[/C][C]0.000493682617262828[/C][C]0.999753158691369[/C][/ROW]
[ROW][C]31[/C][C]0.000132282220033331[/C][C]0.000264564440066663[/C][C]0.999867717779967[/C][/ROW]
[ROW][C]32[/C][C]6.61612990178008e-05[/C][C]0.000132322598035602[/C][C]0.999933838700982[/C][/ROW]
[ROW][C]33[/C][C]4.02360403236123e-05[/C][C]8.04720806472245e-05[/C][C]0.999959763959676[/C][/ROW]
[ROW][C]34[/C][C]2.34080956225199e-05[/C][C]4.68161912450399e-05[/C][C]0.999976591904377[/C][/ROW]
[ROW][C]35[/C][C]1.68394153099284e-05[/C][C]3.36788306198569e-05[/C][C]0.99998316058469[/C][/ROW]
[ROW][C]36[/C][C]1.20754593279287e-05[/C][C]2.41509186558574e-05[/C][C]0.999987924540672[/C][/ROW]
[ROW][C]37[/C][C]0.000257666659385439[/C][C]0.000515333318770879[/C][C]0.999742333340615[/C][/ROW]
[ROW][C]38[/C][C]0.000272608650448351[/C][C]0.000545217300896702[/C][C]0.999727391349552[/C][/ROW]
[ROW][C]39[/C][C]0.00337892349603056[/C][C]0.00675784699206112[/C][C]0.99662107650397[/C][/ROW]
[ROW][C]40[/C][C]0.0292190563471465[/C][C]0.058438112694293[/C][C]0.970780943652854[/C][/ROW]
[ROW][C]41[/C][C]0.094070711854913[/C][C]0.188141423709826[/C][C]0.905929288145087[/C][/ROW]
[ROW][C]42[/C][C]0.303237790261706[/C][C]0.606475580523413[/C][C]0.696762209738294[/C][/ROW]
[ROW][C]43[/C][C]0.589993326310043[/C][C]0.820013347379914[/C][C]0.410006673689957[/C][/ROW]
[/TABLE]
Source: https://freestatistics.org/blog/index.php?pk=58511&T=5

Globally Unique Identifier (entire table): ba.freestatistics.org/blog/index.php?pk=58511&T=5

As an alternative you can also use a QR Code:  

The GUIDs for individual cells are displayed in the table below:

Goldfeld-Quandt test for Heteroskedasticity
p-valuesAlternative Hypothesis
breakpoint indexgreater2-sidedless
170.1105989952040150.2211979904080310.889401004795985
180.03940885648739290.07881771297478580.960591143512607
190.01306721672307930.02613443344615860.98693278327692
200.004124957304581850.00824991460916370.995875042695418
210.003121903834058960.006243807668117920.99687809616594
220.01719375782538760.03438751565077520.982806242174612
230.007551963252635730.01510392650527150.992448036747364
240.003093725043500470.006187450087000950.9969062749565
250.001976741207177980.003953482414355970.998023258792822
260.001290960280399290.002581920560798590.9987090397196
270.0008100876601933260.001620175320386650.999189912339807
280.0007965984874669470.001593196974933890.999203401512533
290.0004115496871912790.0008230993743825580.999588450312809
300.0002468413086314140.0004936826172628280.999753158691369
310.0001322822200333310.0002645644400666630.999867717779967
326.61612990178008e-050.0001323225980356020.999933838700982
334.02360403236123e-058.04720806472245e-050.999959763959676
342.34080956225199e-054.68161912450399e-050.999976591904377
351.68394153099284e-053.36788306198569e-050.99998316058469
361.20754593279287e-052.41509186558574e-050.999987924540672
370.0002576666593854390.0005153333187708790.999742333340615
380.0002726086504483510.0005452173008967020.999727391349552
390.003378923496030560.006757846992061120.99662107650397
400.02921905634714650.0584381126942930.970780943652854
410.0940707118549130.1881414237098260.905929288145087
420.3032377902617060.6064755805234130.696762209738294
430.5899933263100430.8200133473799140.410006673689957


Meta Analysis of Goldfeld-Quandt test for Heteroskedasticity
Description# significant tests% significant testsOK/NOK
1% type I error level180.666666666666667NOK
5% type I error level210.777777777777778NOK
10% type I error level230.851851851851852NOK

\begin{tabular}{lllllllll}
\hline
Meta Analysis of Goldfeld-Quandt test for Heteroskedasticity \tabularnewline
Description & # significant tests & % significant tests & OK/NOK \tabularnewline
1% type I error level & 18 & 0.666666666666667 & NOK \tabularnewline
5% type I error level & 21 & 0.777777777777778 & NOK \tabularnewline
10% type I error level & 23 & 0.851851851851852 & NOK \tabularnewline
\hline
\end{tabular}
%Source: https://freestatistics.org/blog/index.php?pk=58511&T=6

[TABLE]
[ROW][C]Meta Analysis of Goldfeld-Quandt test for Heteroskedasticity[/C][/ROW]
[ROW][C]Description[/C][C]# significant tests[/C][C]% significant tests[/C][C]OK/NOK[/C][/ROW]
[ROW][C]1% type I error level[/C][C]18[/C][C]0.666666666666667[/C][C]NOK[/C][/ROW]
[ROW][C]5% type I error level[/C][C]21[/C][C]0.777777777777778[/C][C]NOK[/C][/ROW]
[ROW][C]10% type I error level[/C][C]23[/C][C]0.851851851851852[/C][C]NOK[/C][/ROW]
[/TABLE]
Source: https://freestatistics.org/blog/index.php?pk=58511&T=6

Globally Unique Identifier (entire table): ba.freestatistics.org/blog/index.php?pk=58511&T=6

As an alternative you can also use a QR Code:  

The GUIDs for individual cells are displayed in the table below:

Meta Analysis of Goldfeld-Quandt test for Heteroskedasticity
Description# significant tests% significant testsOK/NOK
1% type I error level180.666666666666667NOK
5% type I error level210.777777777777778NOK
10% type I error level230.851851851851852NOK


Parameters (Session):
par1 = 1 ; par2 = Include Monthly Dummies ; par3 = Linear Trend ;
Parameters (R input):
par1 = 1 ; par2 = Include Monthly Dummies ; par3 = Linear Trend ;
R code (references can be found in the software module):
library(lattice)
library(lmtest)
n25 <- 25 #minimum number of obs. for Goldfeld-Quandt test
par1 <- as.numeric(par1)
x <- t(y)
k <- length(x[1,])
n <- length(x[,1])
x1 <- cbind(x[,par1], x[,1:k!=par1])
mycolnames <- c(colnames(x)[par1], colnames(x)[1:k!=par1])
colnames(x1) <- mycolnames #colnames(x)[par1]
x <- x1
if (par3 == 'First Differences'){
x2 <- array(0, dim=c(n-1,k), dimnames=list(1:(n-1), paste('(1-B)',colnames(x),sep='')))
for (i in 1:n-1) {
for (j in 1:k) {
x2[i,j] <- x[i+1,j] - x[i,j]
}
}
x <- x2
}
if (par2 == 'Include Monthly Dummies'){
x2 <- array(0, dim=c(n,11), dimnames=list(1:n, paste('M', seq(1:11), sep ='')))
for (i in 1:11){
x2[seq(i,n,12),i] <- 1
}
x <- cbind(x, x2)
}
if (par2 == 'Include Quarterly Dummies'){
x2 <- array(0, dim=c(n,3), dimnames=list(1:n, paste('Q', seq(1:3), sep ='')))
for (i in 1:3){
x2[seq(i,n,4),i] <- 1
}
x <- cbind(x, x2)
}
k <- length(x[1,])
if (par3 == 'Linear Trend'){
x <- cbind(x, c(1:n))
colnames(x)[k+1] <- 't'
}
x
k <- length(x[1,])
df <- as.data.frame(x)
(mylm <- lm(df))
(mysum <- summary(mylm))
if (n > n25) {
kp3 <- k + 3
nmkm3 <- n - k - 3
gqarr <- array(NA, dim=c(nmkm3-kp3+1,3))
numgqtests <- 0
numsignificant1 <- 0
numsignificant5 <- 0
numsignificant10 <- 0
for (mypoint in kp3:nmkm3) {
j <- 0
numgqtests <- numgqtests + 1
for (myalt in c('greater', 'two.sided', 'less')) {
j <- j + 1
gqarr[mypoint-kp3+1,j] <- gqtest(mylm, point=mypoint, alternative=myalt)$p.value
}
if (gqarr[mypoint-kp3+1,2] < 0.01) numsignificant1 <- numsignificant1 + 1
if (gqarr[mypoint-kp3+1,2] < 0.05) numsignificant5 <- numsignificant5 + 1
if (gqarr[mypoint-kp3+1,2] < 0.10) numsignificant10 <- numsignificant10 + 1
}
gqarr
}
bitmap(file='test0.png')
plot(x[,1], type='l', main='Actuals and Interpolation', ylab='value of Actuals and Interpolation (dots)', xlab='time or index')
points(x[,1]-mysum$resid)
grid()
dev.off()
bitmap(file='test1.png')
plot(mysum$resid, type='b', pch=19, main='Residuals', ylab='value of Residuals', xlab='time or index')
grid()
dev.off()
bitmap(file='test2.png')
hist(mysum$resid, main='Residual Histogram', xlab='values of Residuals')
grid()
dev.off()
bitmap(file='test3.png')
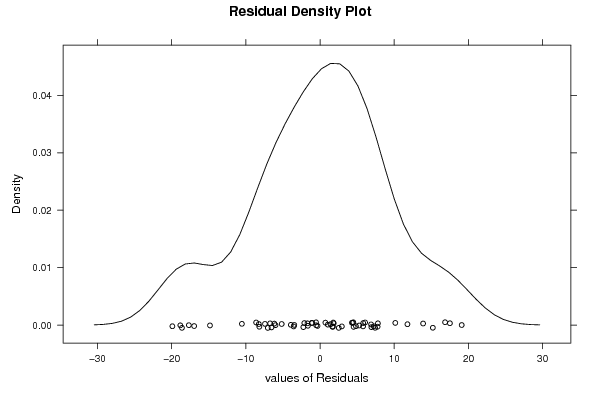
densityplot(~mysum$resid,col='black',main='Residual Density Plot', xlab='values of Residuals')
dev.off()
bitmap(file='test4.png')
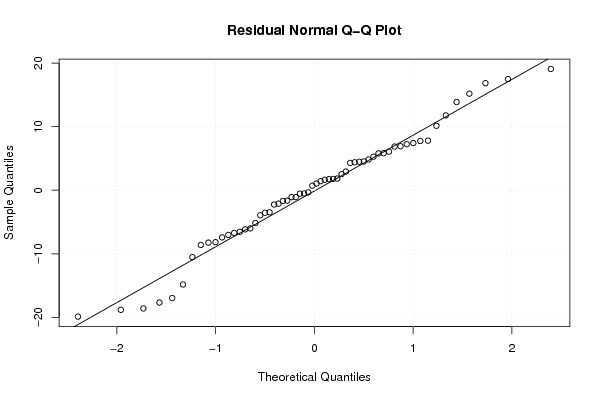
qqnorm(mysum$resid, main='Residual Normal Q-Q Plot')
qqline(mysum$resid)
grid()
dev.off()
(myerror <- as.ts(mysum$resid))
bitmap(file='test5.png')
dum <- cbind(lag(myerror,k=1),myerror)
dum
dum1 <- dum[2:length(myerror),]
dum1
z <- as.data.frame(dum1)
z
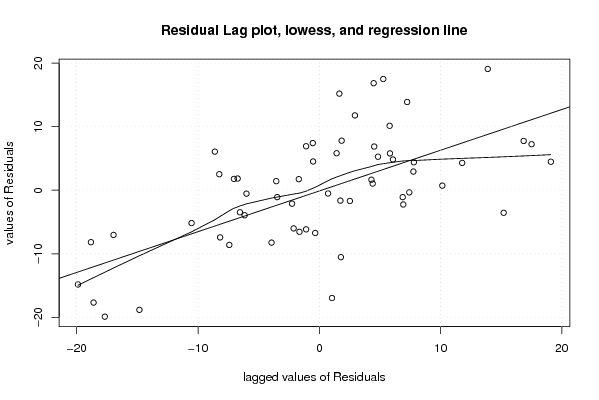
plot(z,main=paste('Residual Lag plot, lowess, and regression line'), ylab='values of Residuals', xlab='lagged values of Residuals')
lines(lowess(z))
abline(lm(z))
grid()
dev.off()
bitmap(file='test6.png')
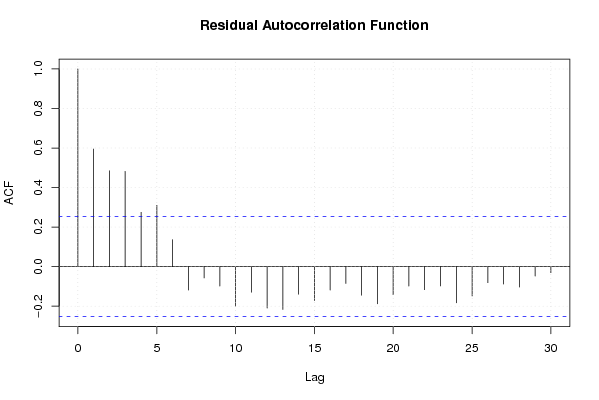
acf(mysum$resid, lag.max=length(mysum$resid)/2, main='Residual Autocorrelation Function')
grid()
dev.off()
bitmap(file='test7.png')
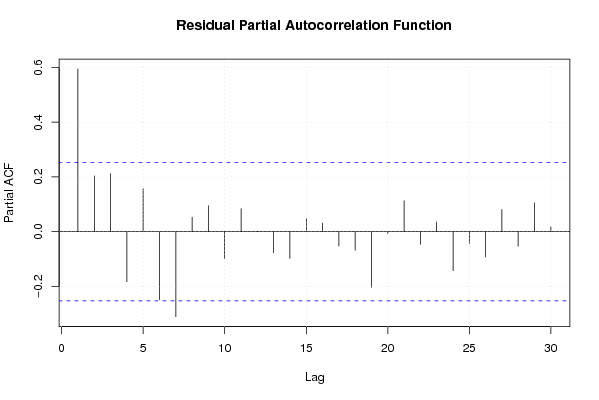
pacf(mysum$resid, lag.max=length(mysum$resid)/2, main='Residual Partial Autocorrelation Function')
grid()
dev.off()
bitmap(file='test8.png')
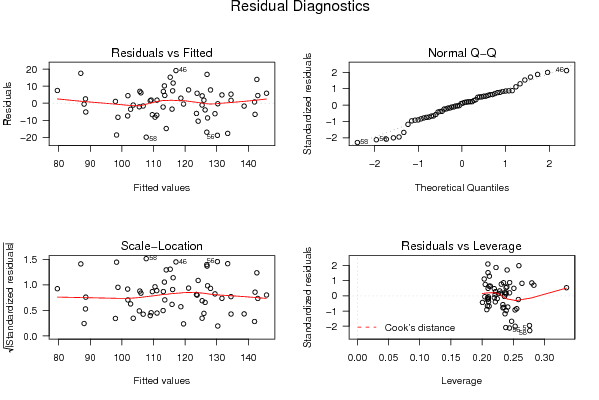
opar <- par(mfrow = c(2,2), oma = c(0, 0, 1.1, 0))
plot(mylm, las = 1, sub='Residual Diagnostics')
par(opar)
dev.off()
if (n > n25) {
bitmap(file='test9.png')
plot(kp3:nmkm3,gqarr[,2], main='Goldfeld-Quandt test',ylab='2-sided p-value',xlab='breakpoint')
grid()
dev.off()
}
load(file='createtable')
a<-table.start()
a<-table.row.start(a)
a<-table.element(a, 'Multiple Linear Regression - Estimated Regression Equation', 1, TRUE)
a<-table.row.end(a)
myeq <- colnames(x)[1]
myeq <- paste(myeq, '[t] = ', sep='')
for (i in 1:k){
if (mysum$coefficients[i,1] > 0) myeq <- paste(myeq, '+', '')
myeq <- paste(myeq, mysum$coefficients[i,1], sep=' ')
if (rownames(mysum$coefficients)[i] != '(Intercept)') {
myeq <- paste(myeq, rownames(mysum$coefficients)[i], sep='')
if (rownames(mysum$coefficients)[i] != 't') myeq <- paste(myeq, '[t]', sep='')
}
}
myeq <- paste(myeq, ' + e[t]')
a<-table.row.start(a)
a<-table.element(a, myeq)
a<-table.row.end(a)
a<-table.end(a)
table.save(a,file='mytable1.tab')
a<-table.start()
a<-table.row.start(a)
a<-table.element(a,hyperlink('ols1.htm','Multiple Linear Regression - Ordinary Least Squares',''), 6, TRUE)
a<-table.row.end(a)
a<-table.row.start(a)
a<-table.element(a,'Variable',header=TRUE)
a<-table.element(a,'Parameter',header=TRUE)
a<-table.element(a,'S.D.',header=TRUE)
a<-table.element(a,'T-STAT
H0: parameter = 0',header=TRUE)
a<-table.element(a,'2-tail p-value',header=TRUE)
a<-table.element(a,'1-tail p-value',header=TRUE)
a<-table.row.end(a)
for (i in 1:k){
a<-table.row.start(a)
a<-table.element(a,rownames(mysum$coefficients)[i],header=TRUE)
a<-table.element(a,mysum$coefficients[i,1])
a<-table.element(a, round(mysum$coefficients[i,2],6))
a<-table.element(a, round(mysum$coefficients[i,3],4))
a<-table.element(a, round(mysum$coefficients[i,4],6))
a<-table.element(a, round(mysum$coefficients[i,4]/2,6))
a<-table.row.end(a)
}
a<-table.end(a)
table.save(a,file='mytable2.tab')
a<-table.start()
a<-table.row.start(a)
a<-table.element(a, 'Multiple Linear Regression - Regression Statistics', 2, TRUE)
a<-table.row.end(a)
a<-table.row.start(a)
a<-table.element(a, 'Multiple R',1,TRUE)
a<-table.element(a, sqrt(mysum$r.squared))
a<-table.row.end(a)
a<-table.row.start(a)
a<-table.element(a, 'R-squared',1,TRUE)
a<-table.element(a, mysum$r.squared)
a<-table.row.end(a)
a<-table.row.start(a)
a<-table.element(a, 'Adjusted R-squared',1,TRUE)
a<-table.element(a, mysum$adj.r.squared)
a<-table.row.end(a)
a<-table.row.start(a)
a<-table.element(a, 'F-TEST (value)',1,TRUE)
a<-table.element(a, mysum$fstatistic[1])
a<-table.row.end(a)
a<-table.row.start(a)
a<-table.element(a, 'F-TEST (DF numerator)',1,TRUE)
a<-table.element(a, mysum$fstatistic[2])
a<-table.row.end(a)
a<-table.row.start(a)
a<-table.element(a, 'F-TEST (DF denominator)',1,TRUE)
a<-table.element(a, mysum$fstatistic[3])
a<-table.row.end(a)
a<-table.row.start(a)
a<-table.element(a, 'p-value',1,TRUE)
a<-table.element(a, 1-pf(mysum$fstatistic[1],mysum$fstatistic[2],mysum$fstatistic[3]))
a<-table.row.end(a)
a<-table.row.start(a)
a<-table.element(a, 'Multiple Linear Regression - Residual Statistics', 2, TRUE)
a<-table.row.end(a)
a<-table.row.start(a)
a<-table.element(a, 'Residual Standard Deviation',1,TRUE)
a<-table.element(a, mysum$sigma)
a<-table.row.end(a)
a<-table.row.start(a)
a<-table.element(a, 'Sum Squared Residuals',1,TRUE)
a<-table.element(a, sum(myerror*myerror))
a<-table.row.end(a)
a<-table.end(a)
table.save(a,file='mytable3.tab')
a<-table.start()
a<-table.row.start(a)
a<-table.element(a, 'Multiple Linear Regression - Actuals, Interpolation, and Residuals', 4, TRUE)
a<-table.row.end(a)
a<-table.row.start(a)
a<-table.element(a, 'Time or Index', 1, TRUE)
a<-table.element(a, 'Actuals', 1, TRUE)
a<-table.element(a, 'Interpolation
Forecast', 1, TRUE)
a<-table.element(a, 'Residuals
Prediction Error', 1, TRUE)
a<-table.row.end(a)
for (i in 1:n) {
a<-table.row.start(a)
a<-table.element(a,i, 1, TRUE)
a<-table.element(a,x[i])
a<-table.element(a,x[i]-mysum$resid[i])
a<-table.element(a,mysum$resid[i])
a<-table.row.end(a)
}
a<-table.end(a)
table.save(a,file='mytable4.tab')
if (n > n25) {
a<-table.start()
a<-table.row.start(a)
a<-table.element(a,'Goldfeld-Quandt test for Heteroskedasticity',4,TRUE)
a<-table.row.end(a)
a<-table.row.start(a)
a<-table.element(a,'p-values',header=TRUE)
a<-table.element(a,'Alternative Hypothesis',3,header=TRUE)
a<-table.row.end(a)
a<-table.row.start(a)
a<-table.element(a,'breakpoint index',header=TRUE)
a<-table.element(a,'greater',header=TRUE)
a<-table.element(a,'2-sided',header=TRUE)
a<-table.element(a,'less',header=TRUE)
a<-table.row.end(a)
for (mypoint in kp3:nmkm3) {
a<-table.row.start(a)
a<-table.element(a,mypoint,header=TRUE)
a<-table.element(a,gqarr[mypoint-kp3+1,1])
a<-table.element(a,gqarr[mypoint-kp3+1,2])
a<-table.element(a,gqarr[mypoint-kp3+1,3])
a<-table.row.end(a)
}
a<-table.end(a)
table.save(a,file='mytable5.tab')
a<-table.start()
a<-table.row.start(a)
a<-table.element(a,'Meta Analysis of Goldfeld-Quandt test for Heteroskedasticity',4,TRUE)
a<-table.row.end(a)
a<-table.row.start(a)
a<-table.element(a,'Description',header=TRUE)
a<-table.element(a,'# significant tests',header=TRUE)
a<-table.element(a,'% significant tests',header=TRUE)
a<-table.element(a,'OK/NOK',header=TRUE)
a<-table.row.end(a)
a<-table.row.start(a)
a<-table.element(a,'1% type I error level',header=TRUE)
a<-table.element(a,numsignificant1)
a<-table.element(a,numsignificant1/numgqtests)
if (numsignificant1/numgqtests < 0.01) dum <- 'OK' else dum <- 'NOK'
a<-table.element(a,dum)
a<-table.row.end(a)
a<-table.row.start(a)
a<-table.element(a,'5% type I error level',header=TRUE)
a<-table.element(a,numsignificant5)
a<-table.element(a,numsignificant5/numgqtests)
if (numsignificant5/numgqtests < 0.05) dum <- 'OK' else dum <- 'NOK'
a<-table.element(a,dum)
a<-table.row.end(a)
a<-table.row.start(a)
a<-table.element(a,'10% type I error level',header=TRUE)
a<-table.element(a,numsignificant10)
a<-table.element(a,numsignificant10/numgqtests)
if (numsignificant10/numgqtests < 0.1) dum <- 'OK' else dum <- 'NOK'
a<-table.element(a,dum)
a<-table.row.end(a)
a<-table.end(a)
table.save(a,file='mytable6.tab')
}