Free Statistics

of Irreproducible Research!

Author's title

Author*Unverified author*
R Software Modulerwasp_multipleregression.wasp
Title produced by softwareMultiple Regression
Date of computationSat, 21 Nov 2009 02:08:37 -0700
Cite this page as followsStatistical Computations at FreeStatistics.org, Office for Research Development and Education, URL https://freestatistics.org/blog/index.php?v=date/2009/Nov/21/t1258794634zunto5jek90ukt1.htm/, Retrieved Sat, 27 Apr 2024 22:20:26 +0000
Statistical Computations at FreeStatistics.org, Office for Research Development and Education, URL https://freestatistics.org/blog/index.php?pk=58515, Retrieved Sat, 27 Apr 2024 22:20:26 +0000
QR Codes:

Original text written by user:
IsPrivate?No (this computation is public)
User-defined keywords
Estimated Impact180
Family? (F = Feedback message, R = changed R code, M = changed R Module, P = changed Parameters, D = changed Data)
-     [Multiple Regression] [Q1 The Seatbeltlaw] [2007-11-14 19:27:43] [8cd6641b921d30ebe00b648d1481bba0]
- RM D  [Multiple Regression] [Seatbelt] [2009-11-12 14:10:54] [b98453cac15ba1066b407e146608df68]
-    D    [Multiple Regression] [SHW WS7] [2009-11-20 12:32:24] [253127ae8da904b75450fbd69fe4eb21]
-    D        [Multiple Regression] [SHW WS7 - Model 4] [2009-11-21 09:08:37] [b7e46d23597387652ca7420fdeb9acca] [Current]
Feedback Forum

Post a new message
Dataseries X:
357	15.5	358	363	364	363
357	15.1	357	358	363	364
380	15	357	357	358	363
378	12.1	380	357	357	358
376	15.8	378	380	357	357
380	16.9	376	378	380	357
379	15.1	380	376	378	380
384	13.7	379	380	376	378
392	14.8	384	379	380	376
394	14.7	392	384	379	380
392	16	394	392	384	379
396	15.4	392	394	392	384
392	15	396	392	394	392
396	15.5	392	396	392	394
419	15.1	396	392	396	392
421	11.7	419	396	392	396
420	16.3	421	419	396	392
418	16.7	420	421	419	396
410	15	418	420	421	419
418	14.9	410	418	420	421
426	14.6	418	410	418	420
428	15.3	426	418	410	418
430	17.9	428	426	418	410
424	16.4	430	428	426	418
423	15.4	424	430	428	426
427	17.9	423	424	430	428
441	15.9	427	423	424	430
449	13.9	441	427	423	424
452	17.8	449	441	427	423
462	17.9	452	449	441	427
455	17.4	462	452	449	441
461	16.7	455	462	452	449
461	16	461	455	462	452
463	16.6	461	461	455	462
462	19.1	463	461	461	455
456	17.8	462	463	461	461
455	17.2	456	462	463	461
456	18.6	455	456	462	463
472	16.3	456	455	456	462
472	15.1	472	456	455	456
471	19.2	472	472	456	455
465	17.7	471	472	472	456
459	19.1	465	471	472	472
465	18	459	465	471	472
468	17.5	465	459	465	471
467	17.8	468	465	459	465
463	21.1	467	468	465	459
460	17.2	463	467	468	465
462	19.4	460	463	467	468
461	19.8	462	460	463	467
476	17.6	461	462	460	463
476	16.2	476	461	462	460
471	19.5	476	476	461	462
453	19.9	471	476	476	461
443	20	453	471	476	476
442	17.3	443	453	471	476


Summary of computational transaction
Raw Inputview raw input (R code)
Raw Outputview raw output of R engine
Computing time3 seconds
R Server'Gwilym Jenkins' @ 72.249.127.135

\begin{tabular}{lllllllll}
\hline
Summary of computational transaction \tabularnewline
Raw Input & view raw input (R code)  \tabularnewline
Raw Output & view raw output of R engine  \tabularnewline
Computing time & 3 seconds \tabularnewline
R Server & 'Gwilym Jenkins' @ 72.249.127.135 \tabularnewline
\hline
\end{tabular}
%Source: https://freestatistics.org/blog/index.php?pk=58515&T=0

[TABLE]
[ROW][C]Summary of computational transaction[/C][/ROW]
[ROW][C]Raw Input[/C][C]view raw input (R code) [/C][/ROW]
[ROW][C]Raw Output[/C][C]view raw output of R engine [/C][/ROW]
[ROW][C]Computing time[/C][C]3 seconds[/C][/ROW]
[ROW][C]R Server[/C][C]'Gwilym Jenkins' @ 72.249.127.135[/C][/ROW]
[/TABLE]
Source: https://freestatistics.org/blog/index.php?pk=58515&T=0

Globally Unique Identifier (entire table): ba.freestatistics.org/blog/index.php?pk=58515&T=0

As an alternative you can also use a QR Code:  

The GUIDs for individual cells are displayed in the table below:

Summary of computational transaction
Raw Inputview raw input (R code)
Raw Outputview raw output of R engine
Computing time3 seconds
R Server'Gwilym Jenkins' @ 72.249.127.135


Multiple Linear Regression - Estimated Regression Equation
Y[t] = -50.7689952169571 + 1.50143938683308X[t] + 1.02889891057449`Y-1`[t] + 0.0692970396801225`Y-2`[t] -0.096239969622125`Y-3`[t] + 0.0796070883968342`Y-4`[t] + 1.10542849074488M1[t] + 2.83666815064074M2[t] + 21.7621760306343M3[t] + 8.36985452361509M4[t] -0.976767859694887M5[t] -0.366038911108393M6[t] -4.34479708974304M7[t] + 9.17821014476506M8[t] + 8.36123802230115M9[t] + 3.49196481587309M10[t] -1.56209812519408M11[t] -0.412873352380871t + e[t]

\begin{tabular}{lllllllll}
\hline
Multiple Linear Regression - Estimated Regression Equation \tabularnewline
Y[t] =  -50.7689952169571 +  1.50143938683308X[t] +  1.02889891057449`Y-1`[t] +  0.0692970396801225`Y-2`[t] -0.096239969622125`Y-3`[t] +  0.0796070883968342`Y-4`[t] +  1.10542849074488M1[t] +  2.83666815064074M2[t] +  21.7621760306343M3[t] +  8.36985452361509M4[t] -0.976767859694887M5[t] -0.366038911108393M6[t] -4.34479708974304M7[t] +  9.17821014476506M8[t] +  8.36123802230115M9[t] +  3.49196481587309M10[t] -1.56209812519408M11[t] -0.412873352380871t  + e[t] \tabularnewline
\hline
\end{tabular}
%Source: https://freestatistics.org/blog/index.php?pk=58515&T=1

[TABLE]
[ROW][C]Multiple Linear Regression - Estimated Regression Equation[/C][/ROW]
[ROW][C]Y[t] =  -50.7689952169571 +  1.50143938683308X[t] +  1.02889891057449`Y-1`[t] +  0.0692970396801225`Y-2`[t] -0.096239969622125`Y-3`[t] +  0.0796070883968342`Y-4`[t] +  1.10542849074488M1[t] +  2.83666815064074M2[t] +  21.7621760306343M3[t] +  8.36985452361509M4[t] -0.976767859694887M5[t] -0.366038911108393M6[t] -4.34479708974304M7[t] +  9.17821014476506M8[t] +  8.36123802230115M9[t] +  3.49196481587309M10[t] -1.56209812519408M11[t] -0.412873352380871t  + e[t][/C][/ROW]
[/TABLE]
Source: https://freestatistics.org/blog/index.php?pk=58515&T=1

Globally Unique Identifier (entire table): ba.freestatistics.org/blog/index.php?pk=58515&T=1

As an alternative you can also use a QR Code:  

The GUIDs for individual cells are displayed in the table below:

Multiple Linear Regression - Estimated Regression Equation
Y[t] = -50.7689952169571 + 1.50143938683308X[t] + 1.02889891057449`Y-1`[t] + 0.0692970396801225`Y-2`[t] -0.096239969622125`Y-3`[t] + 0.0796070883968342`Y-4`[t] + 1.10542849074488M1[t] + 2.83666815064074M2[t] + 21.7621760306343M3[t] + 8.36985452361509M4[t] -0.976767859694887M5[t] -0.366038911108393M6[t] -4.34479708974304M7[t] + 9.17821014476506M8[t] + 8.36123802230115M9[t] + 3.49196481587309M10[t] -1.56209812519408M11[t] -0.412873352380871t + e[t]


Multiple Linear Regression - Ordinary Least Squares
VariableParameterS.D.T-STATH0: parameter = 02-tail p-value1-tail p-value
(Intercept)-50.768995216957127.791734-1.82680.0755980.037799
X1.501439386833080.9426261.59280.1194850.059742
`Y-1`1.028898910574490.1566496.568200
`Y-2`0.06929703968012250.2203740.31450.7548980.377449
`Y-3`-0.0962399696221250.246883-0.38980.6988460.349423
`Y-4`0.07960708839683420.1997320.39860.6924410.346221
M11.105428490744882.9191080.37870.7070280.353514
M22.836668150640743.2829210.86410.3929720.196486
M321.76217603063433.2098256.779900
M48.369854523615094.8031.74260.0894870.044743
M5-0.9767678596948874.242871-0.23020.819160.40958
M6-0.3660389111083933.831906-0.09550.9244010.4622
M7-4.344797089743042.913872-1.49110.1441980.072099
M89.178210144765063.1597052.90480.0060950.003047
M98.361238022301153.40792.45350.0188460.009423
M103.491964815873093.701080.94350.3513860.175693
M11-1.562098125194083.503816-0.44580.6582520.329126
t-0.4128733523808710.1809-2.28230.0281560.014078

\begin{tabular}{lllllllll}
\hline
Multiple Linear Regression - Ordinary Least Squares \tabularnewline
Variable & Parameter & S.D. & T-STATH0: parameter = 0 & 2-tail p-value & 1-tail p-value \tabularnewline
(Intercept) & -50.7689952169571 & 27.791734 & -1.8268 & 0.075598 & 0.037799 \tabularnewline
X & 1.50143938683308 & 0.942626 & 1.5928 & 0.119485 & 0.059742 \tabularnewline
`Y-1` & 1.02889891057449 & 0.156649 & 6.5682 & 0 & 0 \tabularnewline
`Y-2` & 0.0692970396801225 & 0.220374 & 0.3145 & 0.754898 & 0.377449 \tabularnewline
`Y-3` & -0.096239969622125 & 0.246883 & -0.3898 & 0.698846 & 0.349423 \tabularnewline
`Y-4` & 0.0796070883968342 & 0.199732 & 0.3986 & 0.692441 & 0.346221 \tabularnewline
M1 & 1.10542849074488 & 2.919108 & 0.3787 & 0.707028 & 0.353514 \tabularnewline
M2 & 2.83666815064074 & 3.282921 & 0.8641 & 0.392972 & 0.196486 \tabularnewline
M3 & 21.7621760306343 & 3.209825 & 6.7799 & 0 & 0 \tabularnewline
M4 & 8.36985452361509 & 4.803 & 1.7426 & 0.089487 & 0.044743 \tabularnewline
M5 & -0.976767859694887 & 4.242871 & -0.2302 & 0.81916 & 0.40958 \tabularnewline
M6 & -0.366038911108393 & 3.831906 & -0.0955 & 0.924401 & 0.4622 \tabularnewline
M7 & -4.34479708974304 & 2.913872 & -1.4911 & 0.144198 & 0.072099 \tabularnewline
M8 & 9.17821014476506 & 3.159705 & 2.9048 & 0.006095 & 0.003047 \tabularnewline
M9 & 8.36123802230115 & 3.4079 & 2.4535 & 0.018846 & 0.009423 \tabularnewline
M10 & 3.49196481587309 & 3.70108 & 0.9435 & 0.351386 & 0.175693 \tabularnewline
M11 & -1.56209812519408 & 3.503816 & -0.4458 & 0.658252 & 0.329126 \tabularnewline
t & -0.412873352380871 & 0.1809 & -2.2823 & 0.028156 & 0.014078 \tabularnewline
\hline
\end{tabular}
%Source: https://freestatistics.org/blog/index.php?pk=58515&T=2

[TABLE]
[ROW][C]Multiple Linear Regression - Ordinary Least Squares[/C][/ROW]
[ROW][C]Variable[/C][C]Parameter[/C][C]S.D.[/C][C]T-STATH0: parameter = 0[/C][C]2-tail p-value[/C][C]1-tail p-value[/C][/ROW]
[ROW][C](Intercept)[/C][C]-50.7689952169571[/C][C]27.791734[/C][C]-1.8268[/C][C]0.075598[/C][C]0.037799[/C][/ROW]
[ROW][C]X[/C][C]1.50143938683308[/C][C]0.942626[/C][C]1.5928[/C][C]0.119485[/C][C]0.059742[/C][/ROW]
[ROW][C]`Y-1`[/C][C]1.02889891057449[/C][C]0.156649[/C][C]6.5682[/C][C]0[/C][C]0[/C][/ROW]
[ROW][C]`Y-2`[/C][C]0.0692970396801225[/C][C]0.220374[/C][C]0.3145[/C][C]0.754898[/C][C]0.377449[/C][/ROW]
[ROW][C]`Y-3`[/C][C]-0.096239969622125[/C][C]0.246883[/C][C]-0.3898[/C][C]0.698846[/C][C]0.349423[/C][/ROW]
[ROW][C]`Y-4`[/C][C]0.0796070883968342[/C][C]0.199732[/C][C]0.3986[/C][C]0.692441[/C][C]0.346221[/C][/ROW]
[ROW][C]M1[/C][C]1.10542849074488[/C][C]2.919108[/C][C]0.3787[/C][C]0.707028[/C][C]0.353514[/C][/ROW]
[ROW][C]M2[/C][C]2.83666815064074[/C][C]3.282921[/C][C]0.8641[/C][C]0.392972[/C][C]0.196486[/C][/ROW]
[ROW][C]M3[/C][C]21.7621760306343[/C][C]3.209825[/C][C]6.7799[/C][C]0[/C][C]0[/C][/ROW]
[ROW][C]M4[/C][C]8.36985452361509[/C][C]4.803[/C][C]1.7426[/C][C]0.089487[/C][C]0.044743[/C][/ROW]
[ROW][C]M5[/C][C]-0.976767859694887[/C][C]4.242871[/C][C]-0.2302[/C][C]0.81916[/C][C]0.40958[/C][/ROW]
[ROW][C]M6[/C][C]-0.366038911108393[/C][C]3.831906[/C][C]-0.0955[/C][C]0.924401[/C][C]0.4622[/C][/ROW]
[ROW][C]M7[/C][C]-4.34479708974304[/C][C]2.913872[/C][C]-1.4911[/C][C]0.144198[/C][C]0.072099[/C][/ROW]
[ROW][C]M8[/C][C]9.17821014476506[/C][C]3.159705[/C][C]2.9048[/C][C]0.006095[/C][C]0.003047[/C][/ROW]
[ROW][C]M9[/C][C]8.36123802230115[/C][C]3.4079[/C][C]2.4535[/C][C]0.018846[/C][C]0.009423[/C][/ROW]
[ROW][C]M10[/C][C]3.49196481587309[/C][C]3.70108[/C][C]0.9435[/C][C]0.351386[/C][C]0.175693[/C][/ROW]
[ROW][C]M11[/C][C]-1.56209812519408[/C][C]3.503816[/C][C]-0.4458[/C][C]0.658252[/C][C]0.329126[/C][/ROW]
[ROW][C]t[/C][C]-0.412873352380871[/C][C]0.1809[/C][C]-2.2823[/C][C]0.028156[/C][C]0.014078[/C][/ROW]
[/TABLE]
Source: https://freestatistics.org/blog/index.php?pk=58515&T=2

Globally Unique Identifier (entire table): ba.freestatistics.org/blog/index.php?pk=58515&T=2

As an alternative you can also use a QR Code:  

The GUIDs for individual cells are displayed in the table below:

Multiple Linear Regression - Ordinary Least Squares
VariableParameterS.D.T-STATH0: parameter = 02-tail p-value1-tail p-value
(Intercept)-50.768995216957127.791734-1.82680.0755980.037799
X1.501439386833080.9426261.59280.1194850.059742
`Y-1`1.028898910574490.1566496.568200
`Y-2`0.06929703968012250.2203740.31450.7548980.377449
`Y-3`-0.0962399696221250.246883-0.38980.6988460.349423
`Y-4`0.07960708839683420.1997320.39860.6924410.346221
M11.105428490744882.9191080.37870.7070280.353514
M22.836668150640743.2829210.86410.3929720.196486
M321.76217603063433.2098256.779900
M48.369854523615094.8031.74260.0894870.044743
M5-0.9767678596948874.242871-0.23020.819160.40958
M6-0.3660389111083933.831906-0.09550.9244010.4622
M7-4.344797089743042.913872-1.49110.1441980.072099
M89.178210144765063.1597052.90480.0060950.003047
M98.361238022301153.40792.45350.0188460.009423
M103.491964815873093.701080.94350.3513860.175693
M11-1.562098125194083.503816-0.44580.6582520.329126
t-0.4128733523808710.1809-2.28230.0281560.014078


Multiple Linear Regression - Regression Statistics
Multiple R0.995084348560634
R-squared0.990192860750342
Adjusted R-squared0.98580545634918
F-TEST (value)225.689900043838
F-TEST (DF numerator)17
F-TEST (DF denominator)38
p-value0
Multiple Linear Regression - Residual Statistics
Residual Standard Deviation4.10438021253102
Sum Squared Residuals640.145603302616

\begin{tabular}{lllllllll}
\hline
Multiple Linear Regression - Regression Statistics \tabularnewline
Multiple R & 0.995084348560634 \tabularnewline
R-squared & 0.990192860750342 \tabularnewline
Adjusted R-squared & 0.98580545634918 \tabularnewline
F-TEST (value) & 225.689900043838 \tabularnewline
F-TEST (DF numerator) & 17 \tabularnewline
F-TEST (DF denominator) & 38 \tabularnewline
p-value & 0 \tabularnewline
Multiple Linear Regression - Residual Statistics \tabularnewline
Residual Standard Deviation & 4.10438021253102 \tabularnewline
Sum Squared Residuals & 640.145603302616 \tabularnewline
\hline
\end{tabular}
%Source: https://freestatistics.org/blog/index.php?pk=58515&T=3

[TABLE]
[ROW][C]Multiple Linear Regression - Regression Statistics[/C][/ROW]
[ROW][C]Multiple R[/C][C]0.995084348560634[/C][/ROW]
[ROW][C]R-squared[/C][C]0.990192860750342[/C][/ROW]
[ROW][C]Adjusted R-squared[/C][C]0.98580545634918[/C][/ROW]
[ROW][C]F-TEST (value)[/C][C]225.689900043838[/C][/ROW]
[ROW][C]F-TEST (DF numerator)[/C][C]17[/C][/ROW]
[ROW][C]F-TEST (DF denominator)[/C][C]38[/C][/ROW]
[ROW][C]p-value[/C][C]0[/C][/ROW]
[ROW][C]Multiple Linear Regression - Residual Statistics[/C][/ROW]
[ROW][C]Residual Standard Deviation[/C][C]4.10438021253102[/C][/ROW]
[ROW][C]Sum Squared Residuals[/C][C]640.145603302616[/C][/ROW]
[/TABLE]
Source: https://freestatistics.org/blog/index.php?pk=58515&T=3

Globally Unique Identifier (entire table): ba.freestatistics.org/blog/index.php?pk=58515&T=3

As an alternative you can also use a QR Code:  

The GUIDs for individual cells are displayed in the table below:

Multiple Linear Regression - Regression Statistics
Multiple R0.995084348560634
R-squared0.990192860750342
Adjusted R-squared0.98580545634918
F-TEST (value)225.689900043838
F-TEST (DF numerator)17
F-TEST (DF denominator)38
p-value0
Multiple Linear Regression - Residual Statistics
Residual Standard Deviation4.10438021253102
Sum Squared Residuals640.145603302616


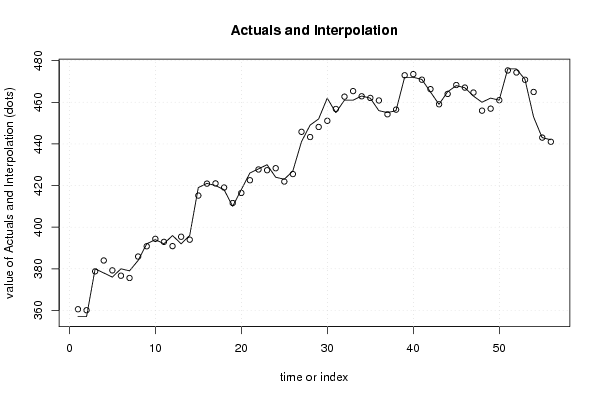
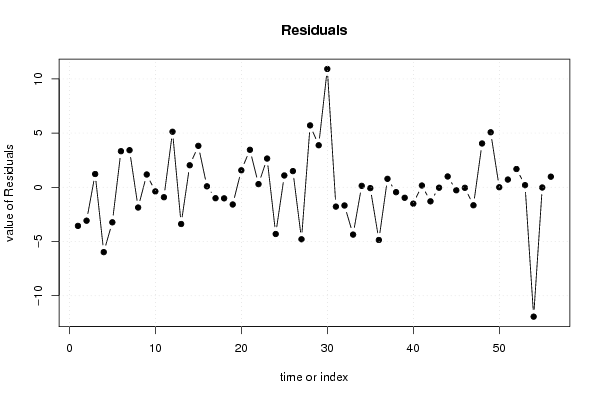
Multiple Linear Regression - Actuals, Interpolation, and Residuals
Time or IndexActualsInterpolationForecastResidualsPrediction Error
1357360.562529952468-3.5625299524681
2357360.080783454294-3.08078345429388
3380378.7755697632571.22443023674308
4378383.979080152892-5.97908015289216
5376379.231337151581-3.23133715158071
6380376.6708648714853.32913512851537
7379375.5770869794793.42291302052129
8384385.866760730636-1.86676073063622
9392390.8195220392181.18047796078205
10394394.379576347932-0.379576347931704
11392392.915878459449-0.915878459449176
12396390.8731515433815.12684845661903
13392395.38650925788-3.38650925787988
14396393.9688818912722.03111810872814
15419415.1751740924473.82482590755343
16421420.9103366518240.0896633481763578
17420421.005703597281-1.00570359728091
18418419.018739169284-1.01873916928398
19410411.586048913706-1.58604891370606
20418416.431707639611.56829236039037
21426422.5411181667173.45888183328273
22428427.7062523609120.293747639088286
23430427.3484561476682.65154385233204
24424428.308850690938-4.30885069093845
25423421.9095438263131.09045617368688
26427425.5035616898051.49643831019501
27441445.796270040896-4.79627004089573
28449443.2885667538345.71143324616601
29452448.1214675000243.87853249997556
30462451.08160886295510.9183911370446
31455456.780717343887-1.78071734388728
32461462.678658476319-1.67865847631945
33461465.362541185347-4.36254118534685
34463462.8667911680420.133208831958288
35462462.076561726315-0.0765617263147584
36456460.861252995412-4.86125299541173
37455454.2177740593050.782225940695417
38456456.448928506146-0.448928506146453
39472472.965687044273-0.965687044273305
40472473.509041968787-1.50904196878662
41471470.8383532959740.161646704025597
42465466.294918475799-1.29491847579875
43459459.036324997572-0.0363249975718326
44465464.0019398222770.998060177722865
45468468.276818608718-0.276818608717929
46467467.047380123115-0.0473801231148656
47463464.659103666568-1.65910366656811
48460455.9567447702694.04325522973114
49462456.9236429040345.07635709596568
50461460.9978444584830.002155541517185
51476475.2872990591270.712700940872513
52476474.3129744726641.68702552733641
53471470.803138455140.196861544860468
54453464.933868620477-11.9338686204772
55443443.019821765356-0.0198217653561182
56442441.0209333311580.979066668842426

\begin{tabular}{lllllllll}
\hline
Multiple Linear Regression - Actuals, Interpolation, and Residuals \tabularnewline
Time or Index & Actuals & InterpolationForecast & ResidualsPrediction Error \tabularnewline
1 & 357 & 360.562529952468 & -3.5625299524681 \tabularnewline
2 & 357 & 360.080783454294 & -3.08078345429388 \tabularnewline
3 & 380 & 378.775569763257 & 1.22443023674308 \tabularnewline
4 & 378 & 383.979080152892 & -5.97908015289216 \tabularnewline
5 & 376 & 379.231337151581 & -3.23133715158071 \tabularnewline
6 & 380 & 376.670864871485 & 3.32913512851537 \tabularnewline
7 & 379 & 375.577086979479 & 3.42291302052129 \tabularnewline
8 & 384 & 385.866760730636 & -1.86676073063622 \tabularnewline
9 & 392 & 390.819522039218 & 1.18047796078205 \tabularnewline
10 & 394 & 394.379576347932 & -0.379576347931704 \tabularnewline
11 & 392 & 392.915878459449 & -0.915878459449176 \tabularnewline
12 & 396 & 390.873151543381 & 5.12684845661903 \tabularnewline
13 & 392 & 395.38650925788 & -3.38650925787988 \tabularnewline
14 & 396 & 393.968881891272 & 2.03111810872814 \tabularnewline
15 & 419 & 415.175174092447 & 3.82482590755343 \tabularnewline
16 & 421 & 420.910336651824 & 0.0896633481763578 \tabularnewline
17 & 420 & 421.005703597281 & -1.00570359728091 \tabularnewline
18 & 418 & 419.018739169284 & -1.01873916928398 \tabularnewline
19 & 410 & 411.586048913706 & -1.58604891370606 \tabularnewline
20 & 418 & 416.43170763961 & 1.56829236039037 \tabularnewline
21 & 426 & 422.541118166717 & 3.45888183328273 \tabularnewline
22 & 428 & 427.706252360912 & 0.293747639088286 \tabularnewline
23 & 430 & 427.348456147668 & 2.65154385233204 \tabularnewline
24 & 424 & 428.308850690938 & -4.30885069093845 \tabularnewline
25 & 423 & 421.909543826313 & 1.09045617368688 \tabularnewline
26 & 427 & 425.503561689805 & 1.49643831019501 \tabularnewline
27 & 441 & 445.796270040896 & -4.79627004089573 \tabularnewline
28 & 449 & 443.288566753834 & 5.71143324616601 \tabularnewline
29 & 452 & 448.121467500024 & 3.87853249997556 \tabularnewline
30 & 462 & 451.081608862955 & 10.9183911370446 \tabularnewline
31 & 455 & 456.780717343887 & -1.78071734388728 \tabularnewline
32 & 461 & 462.678658476319 & -1.67865847631945 \tabularnewline
33 & 461 & 465.362541185347 & -4.36254118534685 \tabularnewline
34 & 463 & 462.866791168042 & 0.133208831958288 \tabularnewline
35 & 462 & 462.076561726315 & -0.0765617263147584 \tabularnewline
36 & 456 & 460.861252995412 & -4.86125299541173 \tabularnewline
37 & 455 & 454.217774059305 & 0.782225940695417 \tabularnewline
38 & 456 & 456.448928506146 & -0.448928506146453 \tabularnewline
39 & 472 & 472.965687044273 & -0.965687044273305 \tabularnewline
40 & 472 & 473.509041968787 & -1.50904196878662 \tabularnewline
41 & 471 & 470.838353295974 & 0.161646704025597 \tabularnewline
42 & 465 & 466.294918475799 & -1.29491847579875 \tabularnewline
43 & 459 & 459.036324997572 & -0.0363249975718326 \tabularnewline
44 & 465 & 464.001939822277 & 0.998060177722865 \tabularnewline
45 & 468 & 468.276818608718 & -0.276818608717929 \tabularnewline
46 & 467 & 467.047380123115 & -0.0473801231148656 \tabularnewline
47 & 463 & 464.659103666568 & -1.65910366656811 \tabularnewline
48 & 460 & 455.956744770269 & 4.04325522973114 \tabularnewline
49 & 462 & 456.923642904034 & 5.07635709596568 \tabularnewline
50 & 461 & 460.997844458483 & 0.002155541517185 \tabularnewline
51 & 476 & 475.287299059127 & 0.712700940872513 \tabularnewline
52 & 476 & 474.312974472664 & 1.68702552733641 \tabularnewline
53 & 471 & 470.80313845514 & 0.196861544860468 \tabularnewline
54 & 453 & 464.933868620477 & -11.9338686204772 \tabularnewline
55 & 443 & 443.019821765356 & -0.0198217653561182 \tabularnewline
56 & 442 & 441.020933331158 & 0.979066668842426 \tabularnewline
\hline
\end{tabular}
%Source: https://freestatistics.org/blog/index.php?pk=58515&T=4

[TABLE]
[ROW][C]Multiple Linear Regression - Actuals, Interpolation, and Residuals[/C][/ROW]
[ROW][C]Time or Index[/C][C]Actuals[/C][C]InterpolationForecast[/C][C]ResidualsPrediction Error[/C][/ROW]
[ROW][C]1[/C][C]357[/C][C]360.562529952468[/C][C]-3.5625299524681[/C][/ROW]
[ROW][C]2[/C][C]357[/C][C]360.080783454294[/C][C]-3.08078345429388[/C][/ROW]
[ROW][C]3[/C][C]380[/C][C]378.775569763257[/C][C]1.22443023674308[/C][/ROW]
[ROW][C]4[/C][C]378[/C][C]383.979080152892[/C][C]-5.97908015289216[/C][/ROW]
[ROW][C]5[/C][C]376[/C][C]379.231337151581[/C][C]-3.23133715158071[/C][/ROW]
[ROW][C]6[/C][C]380[/C][C]376.670864871485[/C][C]3.32913512851537[/C][/ROW]
[ROW][C]7[/C][C]379[/C][C]375.577086979479[/C][C]3.42291302052129[/C][/ROW]
[ROW][C]8[/C][C]384[/C][C]385.866760730636[/C][C]-1.86676073063622[/C][/ROW]
[ROW][C]9[/C][C]392[/C][C]390.819522039218[/C][C]1.18047796078205[/C][/ROW]
[ROW][C]10[/C][C]394[/C][C]394.379576347932[/C][C]-0.379576347931704[/C][/ROW]
[ROW][C]11[/C][C]392[/C][C]392.915878459449[/C][C]-0.915878459449176[/C][/ROW]
[ROW][C]12[/C][C]396[/C][C]390.873151543381[/C][C]5.12684845661903[/C][/ROW]
[ROW][C]13[/C][C]392[/C][C]395.38650925788[/C][C]-3.38650925787988[/C][/ROW]
[ROW][C]14[/C][C]396[/C][C]393.968881891272[/C][C]2.03111810872814[/C][/ROW]
[ROW][C]15[/C][C]419[/C][C]415.175174092447[/C][C]3.82482590755343[/C][/ROW]
[ROW][C]16[/C][C]421[/C][C]420.910336651824[/C][C]0.0896633481763578[/C][/ROW]
[ROW][C]17[/C][C]420[/C][C]421.005703597281[/C][C]-1.00570359728091[/C][/ROW]
[ROW][C]18[/C][C]418[/C][C]419.018739169284[/C][C]-1.01873916928398[/C][/ROW]
[ROW][C]19[/C][C]410[/C][C]411.586048913706[/C][C]-1.58604891370606[/C][/ROW]
[ROW][C]20[/C][C]418[/C][C]416.43170763961[/C][C]1.56829236039037[/C][/ROW]
[ROW][C]21[/C][C]426[/C][C]422.541118166717[/C][C]3.45888183328273[/C][/ROW]
[ROW][C]22[/C][C]428[/C][C]427.706252360912[/C][C]0.293747639088286[/C][/ROW]
[ROW][C]23[/C][C]430[/C][C]427.348456147668[/C][C]2.65154385233204[/C][/ROW]
[ROW][C]24[/C][C]424[/C][C]428.308850690938[/C][C]-4.30885069093845[/C][/ROW]
[ROW][C]25[/C][C]423[/C][C]421.909543826313[/C][C]1.09045617368688[/C][/ROW]
[ROW][C]26[/C][C]427[/C][C]425.503561689805[/C][C]1.49643831019501[/C][/ROW]
[ROW][C]27[/C][C]441[/C][C]445.796270040896[/C][C]-4.79627004089573[/C][/ROW]
[ROW][C]28[/C][C]449[/C][C]443.288566753834[/C][C]5.71143324616601[/C][/ROW]
[ROW][C]29[/C][C]452[/C][C]448.121467500024[/C][C]3.87853249997556[/C][/ROW]
[ROW][C]30[/C][C]462[/C][C]451.081608862955[/C][C]10.9183911370446[/C][/ROW]
[ROW][C]31[/C][C]455[/C][C]456.780717343887[/C][C]-1.78071734388728[/C][/ROW]
[ROW][C]32[/C][C]461[/C][C]462.678658476319[/C][C]-1.67865847631945[/C][/ROW]
[ROW][C]33[/C][C]461[/C][C]465.362541185347[/C][C]-4.36254118534685[/C][/ROW]
[ROW][C]34[/C][C]463[/C][C]462.866791168042[/C][C]0.133208831958288[/C][/ROW]
[ROW][C]35[/C][C]462[/C][C]462.076561726315[/C][C]-0.0765617263147584[/C][/ROW]
[ROW][C]36[/C][C]456[/C][C]460.861252995412[/C][C]-4.86125299541173[/C][/ROW]
[ROW][C]37[/C][C]455[/C][C]454.217774059305[/C][C]0.782225940695417[/C][/ROW]
[ROW][C]38[/C][C]456[/C][C]456.448928506146[/C][C]-0.448928506146453[/C][/ROW]
[ROW][C]39[/C][C]472[/C][C]472.965687044273[/C][C]-0.965687044273305[/C][/ROW]
[ROW][C]40[/C][C]472[/C][C]473.509041968787[/C][C]-1.50904196878662[/C][/ROW]
[ROW][C]41[/C][C]471[/C][C]470.838353295974[/C][C]0.161646704025597[/C][/ROW]
[ROW][C]42[/C][C]465[/C][C]466.294918475799[/C][C]-1.29491847579875[/C][/ROW]
[ROW][C]43[/C][C]459[/C][C]459.036324997572[/C][C]-0.0363249975718326[/C][/ROW]
[ROW][C]44[/C][C]465[/C][C]464.001939822277[/C][C]0.998060177722865[/C][/ROW]
[ROW][C]45[/C][C]468[/C][C]468.276818608718[/C][C]-0.276818608717929[/C][/ROW]
[ROW][C]46[/C][C]467[/C][C]467.047380123115[/C][C]-0.0473801231148656[/C][/ROW]
[ROW][C]47[/C][C]463[/C][C]464.659103666568[/C][C]-1.65910366656811[/C][/ROW]
[ROW][C]48[/C][C]460[/C][C]455.956744770269[/C][C]4.04325522973114[/C][/ROW]
[ROW][C]49[/C][C]462[/C][C]456.923642904034[/C][C]5.07635709596568[/C][/ROW]
[ROW][C]50[/C][C]461[/C][C]460.997844458483[/C][C]0.002155541517185[/C][/ROW]
[ROW][C]51[/C][C]476[/C][C]475.287299059127[/C][C]0.712700940872513[/C][/ROW]
[ROW][C]52[/C][C]476[/C][C]474.312974472664[/C][C]1.68702552733641[/C][/ROW]
[ROW][C]53[/C][C]471[/C][C]470.80313845514[/C][C]0.196861544860468[/C][/ROW]
[ROW][C]54[/C][C]453[/C][C]464.933868620477[/C][C]-11.9338686204772[/C][/ROW]
[ROW][C]55[/C][C]443[/C][C]443.019821765356[/C][C]-0.0198217653561182[/C][/ROW]
[ROW][C]56[/C][C]442[/C][C]441.020933331158[/C][C]0.979066668842426[/C][/ROW]
[/TABLE]
Source: https://freestatistics.org/blog/index.php?pk=58515&T=4

Globally Unique Identifier (entire table): ba.freestatistics.org/blog/index.php?pk=58515&T=4

As an alternative you can also use a QR Code:  

The GUIDs for individual cells are displayed in the table below:

Multiple Linear Regression - Actuals, Interpolation, and Residuals
Time or IndexActualsInterpolationForecastResidualsPrediction Error
1357360.562529952468-3.5625299524681
2357360.080783454294-3.08078345429388
3380378.7755697632571.22443023674308
4378383.979080152892-5.97908015289216
5376379.231337151581-3.23133715158071
6380376.6708648714853.32913512851537
7379375.5770869794793.42291302052129
8384385.866760730636-1.86676073063622
9392390.8195220392181.18047796078205
10394394.379576347932-0.379576347931704
11392392.915878459449-0.915878459449176
12396390.8731515433815.12684845661903
13392395.38650925788-3.38650925787988
14396393.9688818912722.03111810872814
15419415.1751740924473.82482590755343
16421420.9103366518240.0896633481763578
17420421.005703597281-1.00570359728091
18418419.018739169284-1.01873916928398
19410411.586048913706-1.58604891370606
20418416.431707639611.56829236039037
21426422.5411181667173.45888183328273
22428427.7062523609120.293747639088286
23430427.3484561476682.65154385233204
24424428.308850690938-4.30885069093845
25423421.9095438263131.09045617368688
26427425.5035616898051.49643831019501
27441445.796270040896-4.79627004089573
28449443.2885667538345.71143324616601
29452448.1214675000243.87853249997556
30462451.08160886295510.9183911370446
31455456.780717343887-1.78071734388728
32461462.678658476319-1.67865847631945
33461465.362541185347-4.36254118534685
34463462.8667911680420.133208831958288
35462462.076561726315-0.0765617263147584
36456460.861252995412-4.86125299541173
37455454.2177740593050.782225940695417
38456456.448928506146-0.448928506146453
39472472.965687044273-0.965687044273305
40472473.509041968787-1.50904196878662
41471470.8383532959740.161646704025597
42465466.294918475799-1.29491847579875
43459459.036324997572-0.0363249975718326
44465464.0019398222770.998060177722865
45468468.276818608718-0.276818608717929
46467467.047380123115-0.0473801231148656
47463464.659103666568-1.65910366656811
48460455.9567447702694.04325522973114
49462456.9236429040345.07635709596568
50461460.9978444584830.002155541517185
51476475.2872990591270.712700940872513
52476474.3129744726641.68702552733641
53471470.803138455140.196861544860468
54453464.933868620477-11.9338686204772
55443443.019821765356-0.0198217653561182
56442441.0209333311580.979066668842426


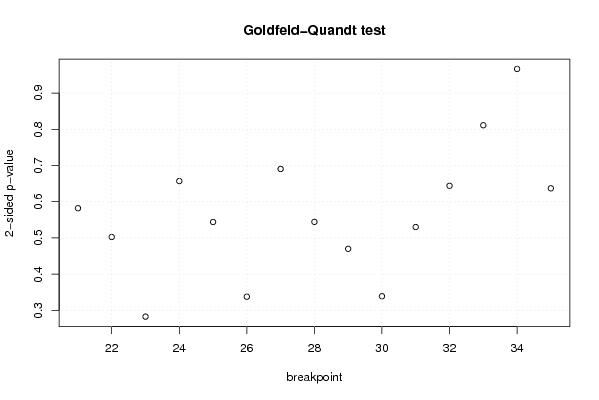
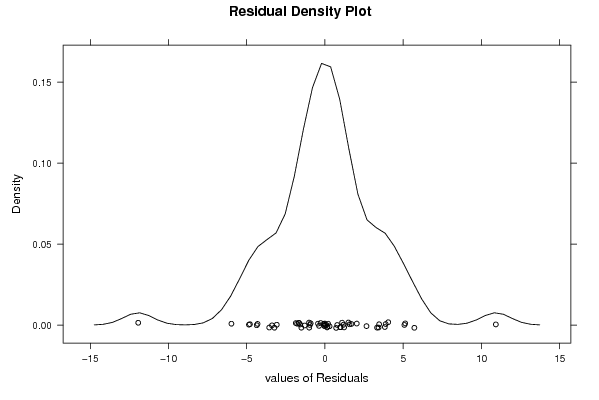
Goldfeld-Quandt test for Heteroskedasticity
p-valuesAlternative Hypothesis
breakpoint indexgreater2-sidedless
210.2910246986560970.5820493973121950.708975301343903
220.2513235951429640.5026471902859290.748676404857036
230.1413651576089570.2827303152179150.858634842391043
240.3285210613346680.6570421226693360.671478938665332
250.2720425100557420.5440850201114840.727957489944258
260.1688771514797020.3377543029594040.831122848520298
270.3452780979987370.6905561959974740.654721902001263
280.2722053914783250.544410782956650.727794608521675
290.2350097432779310.4700194865558620.764990256722069
300.8304527937866380.3390944124267240.169547206213362
310.7349248347503140.5301503304993720.265075165249686
320.6779455621720840.6441088756558320.322054437827916
330.5944120099286020.8111759801427960.405587990071398
340.4833131135560760.9666262271121530.516686886443924
350.3185381597966840.6370763195933690.681461840203316

\begin{tabular}{lllllllll}
\hline
Goldfeld-Quandt test for Heteroskedasticity \tabularnewline
p-values & Alternative Hypothesis \tabularnewline
breakpoint index & greater & 2-sided & less \tabularnewline
21 & 0.291024698656097 & 0.582049397312195 & 0.708975301343903 \tabularnewline
22 & 0.251323595142964 & 0.502647190285929 & 0.748676404857036 \tabularnewline
23 & 0.141365157608957 & 0.282730315217915 & 0.858634842391043 \tabularnewline
24 & 0.328521061334668 & 0.657042122669336 & 0.671478938665332 \tabularnewline
25 & 0.272042510055742 & 0.544085020111484 & 0.727957489944258 \tabularnewline
26 & 0.168877151479702 & 0.337754302959404 & 0.831122848520298 \tabularnewline
27 & 0.345278097998737 & 0.690556195997474 & 0.654721902001263 \tabularnewline
28 & 0.272205391478325 & 0.54441078295665 & 0.727794608521675 \tabularnewline
29 & 0.235009743277931 & 0.470019486555862 & 0.764990256722069 \tabularnewline
30 & 0.830452793786638 & 0.339094412426724 & 0.169547206213362 \tabularnewline
31 & 0.734924834750314 & 0.530150330499372 & 0.265075165249686 \tabularnewline
32 & 0.677945562172084 & 0.644108875655832 & 0.322054437827916 \tabularnewline
33 & 0.594412009928602 & 0.811175980142796 & 0.405587990071398 \tabularnewline
34 & 0.483313113556076 & 0.966626227112153 & 0.516686886443924 \tabularnewline
35 & 0.318538159796684 & 0.637076319593369 & 0.681461840203316 \tabularnewline
\hline
\end{tabular}
%Source: https://freestatistics.org/blog/index.php?pk=58515&T=5

[TABLE]
[ROW][C]Goldfeld-Quandt test for Heteroskedasticity[/C][/ROW]
[ROW][C]p-values[/C][C]Alternative Hypothesis[/C][/ROW]
[ROW][C]breakpoint index[/C][C]greater[/C][C]2-sided[/C][C]less[/C][/ROW]
[ROW][C]21[/C][C]0.291024698656097[/C][C]0.582049397312195[/C][C]0.708975301343903[/C][/ROW]
[ROW][C]22[/C][C]0.251323595142964[/C][C]0.502647190285929[/C][C]0.748676404857036[/C][/ROW]
[ROW][C]23[/C][C]0.141365157608957[/C][C]0.282730315217915[/C][C]0.858634842391043[/C][/ROW]
[ROW][C]24[/C][C]0.328521061334668[/C][C]0.657042122669336[/C][C]0.671478938665332[/C][/ROW]
[ROW][C]25[/C][C]0.272042510055742[/C][C]0.544085020111484[/C][C]0.727957489944258[/C][/ROW]
[ROW][C]26[/C][C]0.168877151479702[/C][C]0.337754302959404[/C][C]0.831122848520298[/C][/ROW]
[ROW][C]27[/C][C]0.345278097998737[/C][C]0.690556195997474[/C][C]0.654721902001263[/C][/ROW]
[ROW][C]28[/C][C]0.272205391478325[/C][C]0.54441078295665[/C][C]0.727794608521675[/C][/ROW]
[ROW][C]29[/C][C]0.235009743277931[/C][C]0.470019486555862[/C][C]0.764990256722069[/C][/ROW]
[ROW][C]30[/C][C]0.830452793786638[/C][C]0.339094412426724[/C][C]0.169547206213362[/C][/ROW]
[ROW][C]31[/C][C]0.734924834750314[/C][C]0.530150330499372[/C][C]0.265075165249686[/C][/ROW]
[ROW][C]32[/C][C]0.677945562172084[/C][C]0.644108875655832[/C][C]0.322054437827916[/C][/ROW]
[ROW][C]33[/C][C]0.594412009928602[/C][C]0.811175980142796[/C][C]0.405587990071398[/C][/ROW]
[ROW][C]34[/C][C]0.483313113556076[/C][C]0.966626227112153[/C][C]0.516686886443924[/C][/ROW]
[ROW][C]35[/C][C]0.318538159796684[/C][C]0.637076319593369[/C][C]0.681461840203316[/C][/ROW]
[/TABLE]
Source: https://freestatistics.org/blog/index.php?pk=58515&T=5

Globally Unique Identifier (entire table): ba.freestatistics.org/blog/index.php?pk=58515&T=5

As an alternative you can also use a QR Code:  

The GUIDs for individual cells are displayed in the table below:

Goldfeld-Quandt test for Heteroskedasticity
p-valuesAlternative Hypothesis
breakpoint indexgreater2-sidedless
210.2910246986560970.5820493973121950.708975301343903
220.2513235951429640.5026471902859290.748676404857036
230.1413651576089570.2827303152179150.858634842391043
240.3285210613346680.6570421226693360.671478938665332
250.2720425100557420.5440850201114840.727957489944258
260.1688771514797020.3377543029594040.831122848520298
270.3452780979987370.6905561959974740.654721902001263
280.2722053914783250.544410782956650.727794608521675
290.2350097432779310.4700194865558620.764990256722069
300.8304527937866380.3390944124267240.169547206213362
310.7349248347503140.5301503304993720.265075165249686
320.6779455621720840.6441088756558320.322054437827916
330.5944120099286020.8111759801427960.405587990071398
340.4833131135560760.9666262271121530.516686886443924
350.3185381597966840.6370763195933690.681461840203316


Meta Analysis of Goldfeld-Quandt test for Heteroskedasticity
Description# significant tests% significant testsOK/NOK
1% type I error level00OK
5% type I error level00OK
10% type I error level00OK

\begin{tabular}{lllllllll}
\hline
Meta Analysis of Goldfeld-Quandt test for Heteroskedasticity \tabularnewline
Description & # significant tests & % significant tests & OK/NOK \tabularnewline
1% type I error level & 0 & 0 & OK \tabularnewline
5% type I error level & 0 & 0 & OK \tabularnewline
10% type I error level & 0 & 0 & OK \tabularnewline
\hline
\end{tabular}
%Source: https://freestatistics.org/blog/index.php?pk=58515&T=6

[TABLE]
[ROW][C]Meta Analysis of Goldfeld-Quandt test for Heteroskedasticity[/C][/ROW]
[ROW][C]Description[/C][C]# significant tests[/C][C]% significant tests[/C][C]OK/NOK[/C][/ROW]
[ROW][C]1% type I error level[/C][C]0[/C][C]0[/C][C]OK[/C][/ROW]
[ROW][C]5% type I error level[/C][C]0[/C][C]0[/C][C]OK[/C][/ROW]
[ROW][C]10% type I error level[/C][C]0[/C][C]0[/C][C]OK[/C][/ROW]
[/TABLE]
Source: https://freestatistics.org/blog/index.php?pk=58515&T=6

Globally Unique Identifier (entire table): ba.freestatistics.org/blog/index.php?pk=58515&T=6

As an alternative you can also use a QR Code:  

The GUIDs for individual cells are displayed in the table below:

Meta Analysis of Goldfeld-Quandt test for Heteroskedasticity
Description# significant tests% significant testsOK/NOK
1% type I error level00OK
5% type I error level00OK
10% type I error level00OK


Parameters (Session):
par1 = 1 ; par2 = Include Monthly Dummies ; par3 = Linear Trend ;
Parameters (R input):
par1 = 1 ; par2 = Include Monthly Dummies ; par3 = Linear Trend ;
R code (references can be found in the software module):
library(lattice)
library(lmtest)
n25 <- 25 #minimum number of obs. for Goldfeld-Quandt test
par1 <- as.numeric(par1)
x <- t(y)
k <- length(x[1,])
n <- length(x[,1])
x1 <- cbind(x[,par1], x[,1:k!=par1])
mycolnames <- c(colnames(x)[par1], colnames(x)[1:k!=par1])
colnames(x1) <- mycolnames #colnames(x)[par1]
x <- x1
if (par3 == 'First Differences'){
x2 <- array(0, dim=c(n-1,k), dimnames=list(1:(n-1), paste('(1-B)',colnames(x),sep='')))
for (i in 1:n-1) {
for (j in 1:k) {
x2[i,j] <- x[i+1,j] - x[i,j]
}
}
x <- x2
}
if (par2 == 'Include Monthly Dummies'){
x2 <- array(0, dim=c(n,11), dimnames=list(1:n, paste('M', seq(1:11), sep ='')))
for (i in 1:11){
x2[seq(i,n,12),i] <- 1
}
x <- cbind(x, x2)
}
if (par2 == 'Include Quarterly Dummies'){
x2 <- array(0, dim=c(n,3), dimnames=list(1:n, paste('Q', seq(1:3), sep ='')))
for (i in 1:3){
x2[seq(i,n,4),i] <- 1
}
x <- cbind(x, x2)
}
k <- length(x[1,])
if (par3 == 'Linear Trend'){
x <- cbind(x, c(1:n))
colnames(x)[k+1] <- 't'
}
x
k <- length(x[1,])
df <- as.data.frame(x)
(mylm <- lm(df))
(mysum <- summary(mylm))
if (n > n25) {
kp3 <- k + 3
nmkm3 <- n - k - 3
gqarr <- array(NA, dim=c(nmkm3-kp3+1,3))
numgqtests <- 0
numsignificant1 <- 0
numsignificant5 <- 0
numsignificant10 <- 0
for (mypoint in kp3:nmkm3) {
j <- 0
numgqtests <- numgqtests + 1
for (myalt in c('greater', 'two.sided', 'less')) {
j <- j + 1
gqarr[mypoint-kp3+1,j] <- gqtest(mylm, point=mypoint, alternative=myalt)$p.value
}
if (gqarr[mypoint-kp3+1,2] < 0.01) numsignificant1 <- numsignificant1 + 1
if (gqarr[mypoint-kp3+1,2] < 0.05) numsignificant5 <- numsignificant5 + 1
if (gqarr[mypoint-kp3+1,2] < 0.10) numsignificant10 <- numsignificant10 + 1
}
gqarr
}
bitmap(file='test0.png')
plot(x[,1], type='l', main='Actuals and Interpolation', ylab='value of Actuals and Interpolation (dots)', xlab='time or index')
points(x[,1]-mysum$resid)
grid()
dev.off()
bitmap(file='test1.png')
plot(mysum$resid, type='b', pch=19, main='Residuals', ylab='value of Residuals', xlab='time or index')
grid()
dev.off()
bitmap(file='test2.png')
hist(mysum$resid, main='Residual Histogram', xlab='values of Residuals')
grid()
dev.off()
bitmap(file='test3.png')
densityplot(~mysum$resid,col='black',main='Residual Density Plot', xlab='values of Residuals')
dev.off()
bitmap(file='test4.png')
qqnorm(mysum$resid, main='Residual Normal Q-Q Plot')
qqline(mysum$resid)
grid()
dev.off()
(myerror <- as.ts(mysum$resid))
bitmap(file='test5.png')
dum <- cbind(lag(myerror,k=1),myerror)
dum
dum1 <- dum[2:length(myerror),]
dum1
z <- as.data.frame(dum1)
z
plot(z,main=paste('Residual Lag plot, lowess, and regression line'), ylab='values of Residuals', xlab='lagged values of Residuals')
lines(lowess(z))
abline(lm(z))
grid()
dev.off()
bitmap(file='test6.png')
acf(mysum$resid, lag.max=length(mysum$resid)/2, main='Residual Autocorrelation Function')
grid()
dev.off()
bitmap(file='test7.png')
pacf(mysum$resid, lag.max=length(mysum$resid)/2, main='Residual Partial Autocorrelation Function')
grid()
dev.off()
bitmap(file='test8.png')
opar <- par(mfrow = c(2,2), oma = c(0, 0, 1.1, 0))
plot(mylm, las = 1, sub='Residual Diagnostics')
par(opar)
dev.off()
if (n > n25) {
bitmap(file='test9.png')
plot(kp3:nmkm3,gqarr[,2], main='Goldfeld-Quandt test',ylab='2-sided p-value',xlab='breakpoint')
grid()
dev.off()
}
load(file='createtable')
a<-table.start()
a<-table.row.start(a)
a<-table.element(a, 'Multiple Linear Regression - Estimated Regression Equation', 1, TRUE)
a<-table.row.end(a)
myeq <- colnames(x)[1]
myeq <- paste(myeq, '[t] = ', sep='')
for (i in 1:k){
if (mysum$coefficients[i,1] > 0) myeq <- paste(myeq, '+', '')
myeq <- paste(myeq, mysum$coefficients[i,1], sep=' ')
if (rownames(mysum$coefficients)[i] != '(Intercept)') {
myeq <- paste(myeq, rownames(mysum$coefficients)[i], sep='')
if (rownames(mysum$coefficients)[i] != 't') myeq <- paste(myeq, '[t]', sep='')
}
}
myeq <- paste(myeq, ' + e[t]')
a<-table.row.start(a)
a<-table.element(a, myeq)
a<-table.row.end(a)
a<-table.end(a)
table.save(a,file='mytable1.tab')
a<-table.start()
a<-table.row.start(a)
a<-table.element(a,hyperlink('ols1.htm','Multiple Linear Regression - Ordinary Least Squares',''), 6, TRUE)
a<-table.row.end(a)
a<-table.row.start(a)
a<-table.element(a,'Variable',header=TRUE)
a<-table.element(a,'Parameter',header=TRUE)
a<-table.element(a,'S.D.',header=TRUE)
a<-table.element(a,'T-STAT
H0: parameter = 0',header=TRUE)
a<-table.element(a,'2-tail p-value',header=TRUE)
a<-table.element(a,'1-tail p-value',header=TRUE)
a<-table.row.end(a)
for (i in 1:k){
a<-table.row.start(a)
a<-table.element(a,rownames(mysum$coefficients)[i],header=TRUE)
a<-table.element(a,mysum$coefficients[i,1])
a<-table.element(a, round(mysum$coefficients[i,2],6))
a<-table.element(a, round(mysum$coefficients[i,3],4))
a<-table.element(a, round(mysum$coefficients[i,4],6))
a<-table.element(a, round(mysum$coefficients[i,4]/2,6))
a<-table.row.end(a)
}
a<-table.end(a)
table.save(a,file='mytable2.tab')
a<-table.start()
a<-table.row.start(a)
a<-table.element(a, 'Multiple Linear Regression - Regression Statistics', 2, TRUE)
a<-table.row.end(a)
a<-table.row.start(a)
a<-table.element(a, 'Multiple R',1,TRUE)
a<-table.element(a, sqrt(mysum$r.squared))
a<-table.row.end(a)
a<-table.row.start(a)
a<-table.element(a, 'R-squared',1,TRUE)
a<-table.element(a, mysum$r.squared)
a<-table.row.end(a)
a<-table.row.start(a)
a<-table.element(a, 'Adjusted R-squared',1,TRUE)
a<-table.element(a, mysum$adj.r.squared)
a<-table.row.end(a)
a<-table.row.start(a)
a<-table.element(a, 'F-TEST (value)',1,TRUE)
a<-table.element(a, mysum$fstatistic[1])
a<-table.row.end(a)
a<-table.row.start(a)
a<-table.element(a, 'F-TEST (DF numerator)',1,TRUE)
a<-table.element(a, mysum$fstatistic[2])
a<-table.row.end(a)
a<-table.row.start(a)
a<-table.element(a, 'F-TEST (DF denominator)',1,TRUE)
a<-table.element(a, mysum$fstatistic[3])
a<-table.row.end(a)
a<-table.row.start(a)
a<-table.element(a, 'p-value',1,TRUE)
a<-table.element(a, 1-pf(mysum$fstatistic[1],mysum$fstatistic[2],mysum$fstatistic[3]))
a<-table.row.end(a)
a<-table.row.start(a)
a<-table.element(a, 'Multiple Linear Regression - Residual Statistics', 2, TRUE)
a<-table.row.end(a)
a<-table.row.start(a)
a<-table.element(a, 'Residual Standard Deviation',1,TRUE)
a<-table.element(a, mysum$sigma)
a<-table.row.end(a)
a<-table.row.start(a)
a<-table.element(a, 'Sum Squared Residuals',1,TRUE)
a<-table.element(a, sum(myerror*myerror))
a<-table.row.end(a)
a<-table.end(a)
table.save(a,file='mytable3.tab')
a<-table.start()
a<-table.row.start(a)
a<-table.element(a, 'Multiple Linear Regression - Actuals, Interpolation, and Residuals', 4, TRUE)
a<-table.row.end(a)
a<-table.row.start(a)
a<-table.element(a, 'Time or Index', 1, TRUE)
a<-table.element(a, 'Actuals', 1, TRUE)
a<-table.element(a, 'Interpolation
Forecast', 1, TRUE)
a<-table.element(a, 'Residuals
Prediction Error', 1, TRUE)
a<-table.row.end(a)
for (i in 1:n) {
a<-table.row.start(a)
a<-table.element(a,i, 1, TRUE)
a<-table.element(a,x[i])
a<-table.element(a,x[i]-mysum$resid[i])
a<-table.element(a,mysum$resid[i])
a<-table.row.end(a)
}
a<-table.end(a)
table.save(a,file='mytable4.tab')
if (n > n25) {
a<-table.start()
a<-table.row.start(a)
a<-table.element(a,'Goldfeld-Quandt test for Heteroskedasticity',4,TRUE)
a<-table.row.end(a)
a<-table.row.start(a)
a<-table.element(a,'p-values',header=TRUE)
a<-table.element(a,'Alternative Hypothesis',3,header=TRUE)
a<-table.row.end(a)
a<-table.row.start(a)
a<-table.element(a,'breakpoint index',header=TRUE)
a<-table.element(a,'greater',header=TRUE)
a<-table.element(a,'2-sided',header=TRUE)
a<-table.element(a,'less',header=TRUE)
a<-table.row.end(a)
for (mypoint in kp3:nmkm3) {
a<-table.row.start(a)
a<-table.element(a,mypoint,header=TRUE)
a<-table.element(a,gqarr[mypoint-kp3+1,1])
a<-table.element(a,gqarr[mypoint-kp3+1,2])
a<-table.element(a,gqarr[mypoint-kp3+1,3])
a<-table.row.end(a)
}
a<-table.end(a)
table.save(a,file='mytable5.tab')
a<-table.start()
a<-table.row.start(a)
a<-table.element(a,'Meta Analysis of Goldfeld-Quandt test for Heteroskedasticity',4,TRUE)
a<-table.row.end(a)
a<-table.row.start(a)
a<-table.element(a,'Description',header=TRUE)
a<-table.element(a,'# significant tests',header=TRUE)
a<-table.element(a,'% significant tests',header=TRUE)
a<-table.element(a,'OK/NOK',header=TRUE)
a<-table.row.end(a)
a<-table.row.start(a)
a<-table.element(a,'1% type I error level',header=TRUE)
a<-table.element(a,numsignificant1)
a<-table.element(a,numsignificant1/numgqtests)
if (numsignificant1/numgqtests < 0.01) dum <- 'OK' else dum <- 'NOK'
a<-table.element(a,dum)
a<-table.row.end(a)
a<-table.row.start(a)
a<-table.element(a,'5% type I error level',header=TRUE)
a<-table.element(a,numsignificant5)
a<-table.element(a,numsignificant5/numgqtests)
if (numsignificant5/numgqtests < 0.05) dum <- 'OK' else dum <- 'NOK'
a<-table.element(a,dum)
a<-table.row.end(a)
a<-table.row.start(a)
a<-table.element(a,'10% type I error level',header=TRUE)
a<-table.element(a,numsignificant10)
a<-table.element(a,numsignificant10/numgqtests)
if (numsignificant10/numgqtests < 0.1) dum <- 'OK' else dum <- 'NOK'
a<-table.element(a,dum)
a<-table.row.end(a)
a<-table.end(a)
table.save(a,file='mytable6.tab')
}