Free Statistics

of Irreproducible Research!

Author's title

Author*The author of this computation has been verified*
R Software Modulerwasp_multipleregression.wasp
Title produced by softwareMultiple Regression
Date of computationSat, 21 Nov 2009 04:22:15 -0700
Cite this page as followsStatistical Computations at FreeStatistics.org, Office for Research Development and Education, URL https://freestatistics.org/blog/index.php?v=date/2009/Nov/21/t12588026127vxvmqbomhb8blb.htm/, Retrieved Sat, 27 Apr 2024 23:14:29 +0000
Statistical Computations at FreeStatistics.org, Office for Research Development and Education, URL https://freestatistics.org/blog/index.php?pk=58531, Retrieved Sat, 27 Apr 2024 23:14:29 +0000
QR Codes:

Original text written by user:
IsPrivate?No (this computation is public)
User-defined keywords
Estimated Impact176
Family? (F = Feedback message, R = changed R code, M = changed R Module, P = changed Parameters, D = changed Data)
-       [Multiple Regression] [WS 7 Multiple Reg...] [2009-11-21 11:22:15] [762da55b2e2304daaed24a7cc507d14d] [Current]
Feedback Forum

Post a new message
Dataseries X:
109.9	104	112.9	113.6	83.4
99	109.9	104	112.9	113.6
106.3	99	109.9	104	112.9
128.9	106.3	99	109.9	104
111.1	128.9	106.3	99	109.9
102.9	111.1	128.9	106.3	99
130	102.9	111.1	128.9	106.3
87	130	102.9	111.1	128.9
87.5	87	130	102.9	111.1
117.6	87.5	87	130	102.9
103.4	117.6	87.5	87	130
110.8	103.4	117.6	87.5	87
112.6	110.8	103.4	117.6	87.5
102.5	112.6	110.8	103.4	117.6
112.4	102.5	112.6	110.8	103.4
135.6	112.4	102.5	112.6	110.8
105.1	135.6	112.4	102.5	112.6
127.7	105.1	135.6	112.4	102.5
137	127.7	105.1	135.6	112.4
91	137	127.7	105.1	135.6
90.5	91	137	127.7	105.1
122.4	90.5	91	137	127.7
123.3	122.4	90.5	91	137
124.3	123.3	122.4	90.5	91
120	124.3	123.3	122.4	90.5
118.1	120	124.3	123.3	122.4
119	118.1	120	124.3	123.3
142.7	119	118.1	120	124.3
123.6	142.7	119	118.1	120
129.6	123.6	142.7	119	118.1
151.6	129.6	123.6	142.7	119
110.4	151.6	129.6	123.6	142.7
99.2	110.4	151.6	129.6	123.6
130.5	99.2	110.4	151.6	129.6
136.2	130.5	99.2	110.4	151.6
129.7	136.2	130.5	99.2	110.4
128	129.7	136.2	130.5	99.2
121.6	128	129.7	136.2	130.5
135.8	121.6	128	129.7	136.2
143.8	135.8	121.6	128	129.7
147.5	143.8	135.8	121.6	128
136.2	147.5	143.8	135.8	121.6
156.6	136.2	147.5	143.8	135.8
123.3	156.6	136.2	147.5	143.8
104.5	123.3	156.6	136.2	147.5
139.8	104.5	123.3	156.6	136.2
136.5	139.8	104.5	123.3	156.6
112.1	136.5	139.8	104.5	123.3
118.5	112.1	136.5	139.8	104.5
94.4	118.5	112.1	136.5	139.8
102.3	94.4	118.5	112.1	136.5
111.4	102.3	94.4	118.5	112.1
99.2	111.4	102.3	94.4	118.5
87.8	99.2	111.4	102.3	94.4
115.8	87.8	99.2	111.4	102.3
79.7	115.8	87.8	99.2	111.4


Summary of computational transaction
Raw Inputview raw input (R code)
Raw Outputview raw output of R engine
Computing time4 seconds
R Server'Gwilym Jenkins' @ 72.249.127.135

\begin{tabular}{lllllllll}
\hline
Summary of computational transaction \tabularnewline
Raw Input & view raw input (R code)  \tabularnewline
Raw Output & view raw output of R engine  \tabularnewline
Computing time & 4 seconds \tabularnewline
R Server & 'Gwilym Jenkins' @ 72.249.127.135 \tabularnewline
\hline
\end{tabular}
%Source: https://freestatistics.org/blog/index.php?pk=58531&T=0

[TABLE]
[ROW][C]Summary of computational transaction[/C][/ROW]
[ROW][C]Raw Input[/C][C]view raw input (R code) [/C][/ROW]
[ROW][C]Raw Output[/C][C]view raw output of R engine [/C][/ROW]
[ROW][C]Computing time[/C][C]4 seconds[/C][/ROW]
[ROW][C]R Server[/C][C]'Gwilym Jenkins' @ 72.249.127.135[/C][/ROW]
[/TABLE]
Source: https://freestatistics.org/blog/index.php?pk=58531&T=0

Globally Unique Identifier (entire table): ba.freestatistics.org/blog/index.php?pk=58531&T=0

As an alternative you can also use a QR Code:  

The GUIDs for individual cells are displayed in the table below:

Summary of computational transaction
Raw Inputview raw input (R code)
Raw Outputview raw output of R engine
Computing time4 seconds
R Server'Gwilym Jenkins' @ 72.249.127.135


Multiple Linear Regression - Estimated Regression Equation
Yt[t] = + 3.44967554333794 + 0.345771119866665`Yt-1`[t] + 0.572393185503651`Yt-2`[t] + 0.329280609238653`Yt-3`[t] -0.284562624705873`Yt-4`[t] -8.40904074349483M1[t] -6.16791229568818M2[t] + 6.13035172360855M3[t] + 24.5480317538756M4[t] + 2.83995158796344M5[t] -7.88662923258578M6[t] + 18.9911058720556M7[t] -18.0391515918807M8[t] -29.8249609435041M9[t] + 22.5604543650976M10[t] + 32.1620988449328M11[t] -0.0850084829355323t + e[t]

\begin{tabular}{lllllllll}
\hline
Multiple Linear Regression - Estimated Regression Equation \tabularnewline
Yt[t] =  +  3.44967554333794 +  0.345771119866665`Yt-1`[t] +  0.572393185503651`Yt-2`[t] +  0.329280609238653`Yt-3`[t] -0.284562624705873`Yt-4`[t] -8.40904074349483M1[t] -6.16791229568818M2[t] +  6.13035172360855M3[t] +  24.5480317538756M4[t] +  2.83995158796344M5[t] -7.88662923258578M6[t] +  18.9911058720556M7[t] -18.0391515918807M8[t] -29.8249609435041M9[t] +  22.5604543650976M10[t] +  32.1620988449328M11[t] -0.0850084829355323t  + e[t] \tabularnewline
\hline
\end{tabular}
%Source: https://freestatistics.org/blog/index.php?pk=58531&T=1

[TABLE]
[ROW][C]Multiple Linear Regression - Estimated Regression Equation[/C][/ROW]
[ROW][C]Yt[t] =  +  3.44967554333794 +  0.345771119866665`Yt-1`[t] +  0.572393185503651`Yt-2`[t] +  0.329280609238653`Yt-3`[t] -0.284562624705873`Yt-4`[t] -8.40904074349483M1[t] -6.16791229568818M2[t] +  6.13035172360855M3[t] +  24.5480317538756M4[t] +  2.83995158796344M5[t] -7.88662923258578M6[t] +  18.9911058720556M7[t] -18.0391515918807M8[t] -29.8249609435041M9[t] +  22.5604543650976M10[t] +  32.1620988449328M11[t] -0.0850084829355323t  + e[t][/C][/ROW]
[/TABLE]
Source: https://freestatistics.org/blog/index.php?pk=58531&T=1

Globally Unique Identifier (entire table): ba.freestatistics.org/blog/index.php?pk=58531&T=1

As an alternative you can also use a QR Code:  

The GUIDs for individual cells are displayed in the table below:

Multiple Linear Regression - Estimated Regression Equation
Yt[t] = + 3.44967554333794 + 0.345771119866665`Yt-1`[t] + 0.572393185503651`Yt-2`[t] + 0.329280609238653`Yt-3`[t] -0.284562624705873`Yt-4`[t] -8.40904074349483M1[t] -6.16791229568818M2[t] + 6.13035172360855M3[t] + 24.5480317538756M4[t] + 2.83995158796344M5[t] -7.88662923258578M6[t] + 18.9911058720556M7[t] -18.0391515918807M8[t] -29.8249609435041M9[t] + 22.5604543650976M10[t] + 32.1620988449328M11[t] -0.0850084829355323t + e[t]


Multiple Linear Regression - Ordinary Least Squares
VariableParameterS.D.T-STATH0: parameter = 02-tail p-value1-tail p-value
(Intercept)3.4496755433379411.43550.30170.7645110.382256
`Yt-1`0.3457711198666650.1609542.14830.0379610.018981
`Yt-2`0.5723931855036510.1589113.6020.0008820.000441
`Yt-3`0.3292806092386530.1742031.89020.0661770.033089
`Yt-4`-0.2845626247058730.184055-1.54610.1301640.065082
M1-8.409040743494838.040222-1.04590.3020590.15103
M2-6.167912295688189.297597-0.66340.5109850.255492
M36.130351723608559.179020.66790.5081530.254076
M424.54803175387568.8438822.77570.0084160.004208
M52.839951587963446.6638970.42620.6723270.336164
M6-7.886629232585786.466877-1.21950.2299630.114981
M718.99110587205569.539391.99080.0535420.026771
M8-18.03915159188078.38865-2.15040.0377790.01889
M9-29.82496094350419.960682-2.99430.0047590.002379
M1022.560454365097614.9499741.50910.1393420.069671
M1132.162098844932812.1266342.65220.0115040.005752
t-0.08500848293553230.08498-1.00030.3233140.161657

\begin{tabular}{lllllllll}
\hline
Multiple Linear Regression - Ordinary Least Squares \tabularnewline
Variable & Parameter & S.D. & T-STATH0: parameter = 0 & 2-tail p-value & 1-tail p-value \tabularnewline
(Intercept) & 3.44967554333794 & 11.4355 & 0.3017 & 0.764511 & 0.382256 \tabularnewline
`Yt-1` & 0.345771119866665 & 0.160954 & 2.1483 & 0.037961 & 0.018981 \tabularnewline
`Yt-2` & 0.572393185503651 & 0.158911 & 3.602 & 0.000882 & 0.000441 \tabularnewline
`Yt-3` & 0.329280609238653 & 0.174203 & 1.8902 & 0.066177 & 0.033089 \tabularnewline
`Yt-4` & -0.284562624705873 & 0.184055 & -1.5461 & 0.130164 & 0.065082 \tabularnewline
M1 & -8.40904074349483 & 8.040222 & -1.0459 & 0.302059 & 0.15103 \tabularnewline
M2 & -6.16791229568818 & 9.297597 & -0.6634 & 0.510985 & 0.255492 \tabularnewline
M3 & 6.13035172360855 & 9.17902 & 0.6679 & 0.508153 & 0.254076 \tabularnewline
M4 & 24.5480317538756 & 8.843882 & 2.7757 & 0.008416 & 0.004208 \tabularnewline
M5 & 2.83995158796344 & 6.663897 & 0.4262 & 0.672327 & 0.336164 \tabularnewline
M6 & -7.88662923258578 & 6.466877 & -1.2195 & 0.229963 & 0.114981 \tabularnewline
M7 & 18.9911058720556 & 9.53939 & 1.9908 & 0.053542 & 0.026771 \tabularnewline
M8 & -18.0391515918807 & 8.38865 & -2.1504 & 0.037779 & 0.01889 \tabularnewline
M9 & -29.8249609435041 & 9.960682 & -2.9943 & 0.004759 & 0.002379 \tabularnewline
M10 & 22.5604543650976 & 14.949974 & 1.5091 & 0.139342 & 0.069671 \tabularnewline
M11 & 32.1620988449328 & 12.126634 & 2.6522 & 0.011504 & 0.005752 \tabularnewline
t & -0.0850084829355323 & 0.08498 & -1.0003 & 0.323314 & 0.161657 \tabularnewline
\hline
\end{tabular}
%Source: https://freestatistics.org/blog/index.php?pk=58531&T=2

[TABLE]
[ROW][C]Multiple Linear Regression - Ordinary Least Squares[/C][/ROW]
[ROW][C]Variable[/C][C]Parameter[/C][C]S.D.[/C][C]T-STATH0: parameter = 0[/C][C]2-tail p-value[/C][C]1-tail p-value[/C][/ROW]
[ROW][C](Intercept)[/C][C]3.44967554333794[/C][C]11.4355[/C][C]0.3017[/C][C]0.764511[/C][C]0.382256[/C][/ROW]
[ROW][C]`Yt-1`[/C][C]0.345771119866665[/C][C]0.160954[/C][C]2.1483[/C][C]0.037961[/C][C]0.018981[/C][/ROW]
[ROW][C]`Yt-2`[/C][C]0.572393185503651[/C][C]0.158911[/C][C]3.602[/C][C]0.000882[/C][C]0.000441[/C][/ROW]
[ROW][C]`Yt-3`[/C][C]0.329280609238653[/C][C]0.174203[/C][C]1.8902[/C][C]0.066177[/C][C]0.033089[/C][/ROW]
[ROW][C]`Yt-4`[/C][C]-0.284562624705873[/C][C]0.184055[/C][C]-1.5461[/C][C]0.130164[/C][C]0.065082[/C][/ROW]
[ROW][C]M1[/C][C]-8.40904074349483[/C][C]8.040222[/C][C]-1.0459[/C][C]0.302059[/C][C]0.15103[/C][/ROW]
[ROW][C]M2[/C][C]-6.16791229568818[/C][C]9.297597[/C][C]-0.6634[/C][C]0.510985[/C][C]0.255492[/C][/ROW]
[ROW][C]M3[/C][C]6.13035172360855[/C][C]9.17902[/C][C]0.6679[/C][C]0.508153[/C][C]0.254076[/C][/ROW]
[ROW][C]M4[/C][C]24.5480317538756[/C][C]8.843882[/C][C]2.7757[/C][C]0.008416[/C][C]0.004208[/C][/ROW]
[ROW][C]M5[/C][C]2.83995158796344[/C][C]6.663897[/C][C]0.4262[/C][C]0.672327[/C][C]0.336164[/C][/ROW]
[ROW][C]M6[/C][C]-7.88662923258578[/C][C]6.466877[/C][C]-1.2195[/C][C]0.229963[/C][C]0.114981[/C][/ROW]
[ROW][C]M7[/C][C]18.9911058720556[/C][C]9.53939[/C][C]1.9908[/C][C]0.053542[/C][C]0.026771[/C][/ROW]
[ROW][C]M8[/C][C]-18.0391515918807[/C][C]8.38865[/C][C]-2.1504[/C][C]0.037779[/C][C]0.01889[/C][/ROW]
[ROW][C]M9[/C][C]-29.8249609435041[/C][C]9.960682[/C][C]-2.9943[/C][C]0.004759[/C][C]0.002379[/C][/ROW]
[ROW][C]M10[/C][C]22.5604543650976[/C][C]14.949974[/C][C]1.5091[/C][C]0.139342[/C][C]0.069671[/C][/ROW]
[ROW][C]M11[/C][C]32.1620988449328[/C][C]12.126634[/C][C]2.6522[/C][C]0.011504[/C][C]0.005752[/C][/ROW]
[ROW][C]t[/C][C]-0.0850084829355323[/C][C]0.08498[/C][C]-1.0003[/C][C]0.323314[/C][C]0.161657[/C][/ROW]
[/TABLE]
Source: https://freestatistics.org/blog/index.php?pk=58531&T=2

Globally Unique Identifier (entire table): ba.freestatistics.org/blog/index.php?pk=58531&T=2

As an alternative you can also use a QR Code:  

The GUIDs for individual cells are displayed in the table below:

Multiple Linear Regression - Ordinary Least Squares
VariableParameterS.D.T-STATH0: parameter = 02-tail p-value1-tail p-value
(Intercept)3.4496755433379411.43550.30170.7645110.382256
`Yt-1`0.3457711198666650.1609542.14830.0379610.018981
`Yt-2`0.5723931855036510.1589113.6020.0008820.000441
`Yt-3`0.3292806092386530.1742031.89020.0661770.033089
`Yt-4`-0.2845626247058730.184055-1.54610.1301640.065082
M1-8.409040743494838.040222-1.04590.3020590.15103
M2-6.167912295688189.297597-0.66340.5109850.255492
M36.130351723608559.179020.66790.5081530.254076
M424.54803175387568.8438822.77570.0084160.004208
M52.839951587963446.6638970.42620.6723270.336164
M6-7.886629232585786.466877-1.21950.2299630.114981
M718.99110587205569.539391.99080.0535420.026771
M8-18.03915159188078.38865-2.15040.0377790.01889
M9-29.82496094350419.960682-2.99430.0047590.002379
M1022.560454365097614.9499741.50910.1393420.069671
M1132.162098844932812.1266342.65220.0115040.005752
t-0.08500848293553230.08498-1.00030.3233140.161657


Multiple Linear Regression - Regression Statistics
Multiple R0.937994052362038
R-squared0.879832842266557
Adjusted R-squared0.830533495504119
F-TEST (value)17.8467444306364
F-TEST (DF numerator)16
F-TEST (DF denominator)39
p-value3.72590847064203e-13
Multiple Linear Regression - Residual Statistics
Residual Standard Deviation7.32886552923144
Sum Squared Residuals2094.77852787672

\begin{tabular}{lllllllll}
\hline
Multiple Linear Regression - Regression Statistics \tabularnewline
Multiple R & 0.937994052362038 \tabularnewline
R-squared & 0.879832842266557 \tabularnewline
Adjusted R-squared & 0.830533495504119 \tabularnewline
F-TEST (value) & 17.8467444306364 \tabularnewline
F-TEST (DF numerator) & 16 \tabularnewline
F-TEST (DF denominator) & 39 \tabularnewline
p-value & 3.72590847064203e-13 \tabularnewline
Multiple Linear Regression - Residual Statistics \tabularnewline
Residual Standard Deviation & 7.32886552923144 \tabularnewline
Sum Squared Residuals & 2094.77852787672 \tabularnewline
\hline
\end{tabular}
%Source: https://freestatistics.org/blog/index.php?pk=58531&T=3

[TABLE]
[ROW][C]Multiple Linear Regression - Regression Statistics[/C][/ROW]
[ROW][C]Multiple R[/C][C]0.937994052362038[/C][/ROW]
[ROW][C]R-squared[/C][C]0.879832842266557[/C][/ROW]
[ROW][C]Adjusted R-squared[/C][C]0.830533495504119[/C][/ROW]
[ROW][C]F-TEST (value)[/C][C]17.8467444306364[/C][/ROW]
[ROW][C]F-TEST (DF numerator)[/C][C]16[/C][/ROW]
[ROW][C]F-TEST (DF denominator)[/C][C]39[/C][/ROW]
[ROW][C]p-value[/C][C]3.72590847064203e-13[/C][/ROW]
[ROW][C]Multiple Linear Regression - Residual Statistics[/C][/ROW]
[ROW][C]Residual Standard Deviation[/C][C]7.32886552923144[/C][/ROW]
[ROW][C]Sum Squared Residuals[/C][C]2094.77852787672[/C][/ROW]
[/TABLE]
Source: https://freestatistics.org/blog/index.php?pk=58531&T=3

Globally Unique Identifier (entire table): ba.freestatistics.org/blog/index.php?pk=58531&T=3

As an alternative you can also use a QR Code:  

The GUIDs for individual cells are displayed in the table below:

Multiple Linear Regression - Regression Statistics
Multiple R0.937994052362038
R-squared0.879832842266557
Adjusted R-squared0.830533495504119
F-TEST (value)17.8467444306364
F-TEST (DF numerator)16
F-TEST (DF denominator)39
p-value3.72590847064203e-13
Multiple Linear Regression - Residual Statistics
Residual Standard Deviation7.32886552923144
Sum Squared Residuals2094.77852787672


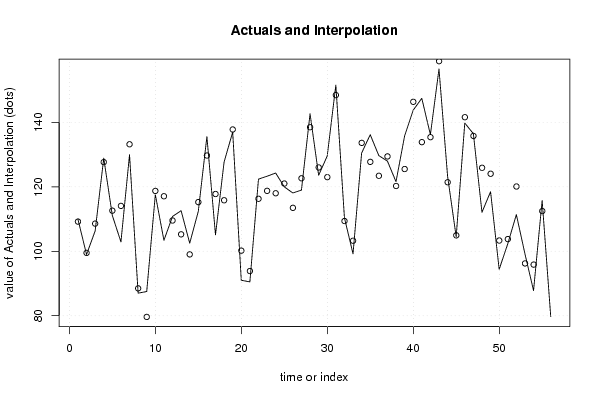
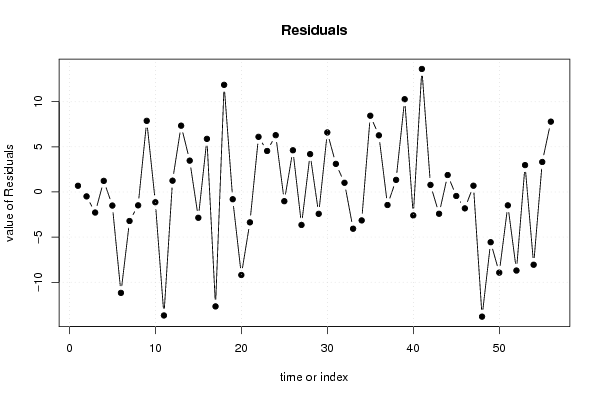
Multiple Linear Regression - Actuals, Interpolation, and Residuals
Time or IndexActualsInterpolationForecastResidualsPrediction Error
1109.9109.2127677354440.68723226455576
29999.4903502639618-0.490350263961782
3106.3108.580416803318-2.28041680331797
4128.9127.6734947580771.22650524192338
5111.1112.605225545926-1.5052255459263
6102.9114.080477357934-11.1804773579336
7130133.213716703208-3.21371670320849
88788.4829138207926-1.48291382079260
987.579.62090688312367.87909311687642
10117.6118.738210325022-1.13821032502169
11103.4117.078040295869-13.6780402958686
12110.8109.5508511165251.24914888347462
13112.6105.2565899686877.34341003131297
14102.599.02968786720953.47031213279049
15112.4115.258428606013-2.85842860601337
16135.6129.7200047402445.87999525975588
17105.1117.777551731008-12.6775517310083
18127.7115.83342571626711.8665742837331
19137137.804727638847-0.80472763884663
2091100.196307624162-9.19630762416215
2190.593.8641767232433-3.36417672324327
22122.4116.2928058033756.10719419662516
23123.3118.7600034965274.53999650347329
24124.3118.0086732259566.29132677404438
25120121.021881733411-1.02188173341119
26118.1113.4823838885574.61761611144324
27119122.650557846509-3.65055784650895
28142.7138.5064071048314.19359289516854
29123.6126.021233992459-2.42123399245884
30129.6123.0081563312136.59184366878675
31151.6148.490643905723.10935609427987
32110.4109.3833078669491.01669213305060
3399.2103.270199762278-4.07019976227828
34130.5133.652168457702-3.15216845770247
35136.2127.7538979846268.44610201537378
36129.7123.4296300606716.27036993932885
37128129.444294178354-1.44429417835389
38121.6120.2621368530441.33786314695553
39135.8125.52705788602810.2729421139719
40143.8146.396242973125-2.59624297312532
41147.5133.87366708023513.6263329197646
42136.2135.4175618535930.782438146406968
43156.6159.014385210255-2.41438521025487
44123.3121.4266443690081.87335563099220
45104.5104.944716631355-0.444716631354871
46139.8141.616815413901-1.816815413901
47136.5135.8080582229780.691941777021569
48112.1125.910845596848-13.8108455968478
49118.5124.064466384104-5.56446638410365
5094.4103.335441127227-8.93544112722747
51102.3103.783538858132-1.48353885813164
52111.4120.103850423722-8.70385042372248
5399.296.22232165037122.97767834962882
5487.895.8603787409932-8.06037874099323
55115.8112.476526541973.32347345803011
5679.771.9108263190887.78917368091195

\begin{tabular}{lllllllll}
\hline
Multiple Linear Regression - Actuals, Interpolation, and Residuals \tabularnewline
Time or Index & Actuals & InterpolationForecast & ResidualsPrediction Error \tabularnewline
1 & 109.9 & 109.212767735444 & 0.68723226455576 \tabularnewline
2 & 99 & 99.4903502639618 & -0.490350263961782 \tabularnewline
3 & 106.3 & 108.580416803318 & -2.28041680331797 \tabularnewline
4 & 128.9 & 127.673494758077 & 1.22650524192338 \tabularnewline
5 & 111.1 & 112.605225545926 & -1.5052255459263 \tabularnewline
6 & 102.9 & 114.080477357934 & -11.1804773579336 \tabularnewline
7 & 130 & 133.213716703208 & -3.21371670320849 \tabularnewline
8 & 87 & 88.4829138207926 & -1.48291382079260 \tabularnewline
9 & 87.5 & 79.6209068831236 & 7.87909311687642 \tabularnewline
10 & 117.6 & 118.738210325022 & -1.13821032502169 \tabularnewline
11 & 103.4 & 117.078040295869 & -13.6780402958686 \tabularnewline
12 & 110.8 & 109.550851116525 & 1.24914888347462 \tabularnewline
13 & 112.6 & 105.256589968687 & 7.34341003131297 \tabularnewline
14 & 102.5 & 99.0296878672095 & 3.47031213279049 \tabularnewline
15 & 112.4 & 115.258428606013 & -2.85842860601337 \tabularnewline
16 & 135.6 & 129.720004740244 & 5.87999525975588 \tabularnewline
17 & 105.1 & 117.777551731008 & -12.6775517310083 \tabularnewline
18 & 127.7 & 115.833425716267 & 11.8665742837331 \tabularnewline
19 & 137 & 137.804727638847 & -0.80472763884663 \tabularnewline
20 & 91 & 100.196307624162 & -9.19630762416215 \tabularnewline
21 & 90.5 & 93.8641767232433 & -3.36417672324327 \tabularnewline
22 & 122.4 & 116.292805803375 & 6.10719419662516 \tabularnewline
23 & 123.3 & 118.760003496527 & 4.53999650347329 \tabularnewline
24 & 124.3 & 118.008673225956 & 6.29132677404438 \tabularnewline
25 & 120 & 121.021881733411 & -1.02188173341119 \tabularnewline
26 & 118.1 & 113.482383888557 & 4.61761611144324 \tabularnewline
27 & 119 & 122.650557846509 & -3.65055784650895 \tabularnewline
28 & 142.7 & 138.506407104831 & 4.19359289516854 \tabularnewline
29 & 123.6 & 126.021233992459 & -2.42123399245884 \tabularnewline
30 & 129.6 & 123.008156331213 & 6.59184366878675 \tabularnewline
31 & 151.6 & 148.49064390572 & 3.10935609427987 \tabularnewline
32 & 110.4 & 109.383307866949 & 1.01669213305060 \tabularnewline
33 & 99.2 & 103.270199762278 & -4.07019976227828 \tabularnewline
34 & 130.5 & 133.652168457702 & -3.15216845770247 \tabularnewline
35 & 136.2 & 127.753897984626 & 8.44610201537378 \tabularnewline
36 & 129.7 & 123.429630060671 & 6.27036993932885 \tabularnewline
37 & 128 & 129.444294178354 & -1.44429417835389 \tabularnewline
38 & 121.6 & 120.262136853044 & 1.33786314695553 \tabularnewline
39 & 135.8 & 125.527057886028 & 10.2729421139719 \tabularnewline
40 & 143.8 & 146.396242973125 & -2.59624297312532 \tabularnewline
41 & 147.5 & 133.873667080235 & 13.6263329197646 \tabularnewline
42 & 136.2 & 135.417561853593 & 0.782438146406968 \tabularnewline
43 & 156.6 & 159.014385210255 & -2.41438521025487 \tabularnewline
44 & 123.3 & 121.426644369008 & 1.87335563099220 \tabularnewline
45 & 104.5 & 104.944716631355 & -0.444716631354871 \tabularnewline
46 & 139.8 & 141.616815413901 & -1.816815413901 \tabularnewline
47 & 136.5 & 135.808058222978 & 0.691941777021569 \tabularnewline
48 & 112.1 & 125.910845596848 & -13.8108455968478 \tabularnewline
49 & 118.5 & 124.064466384104 & -5.56446638410365 \tabularnewline
50 & 94.4 & 103.335441127227 & -8.93544112722747 \tabularnewline
51 & 102.3 & 103.783538858132 & -1.48353885813164 \tabularnewline
52 & 111.4 & 120.103850423722 & -8.70385042372248 \tabularnewline
53 & 99.2 & 96.2223216503712 & 2.97767834962882 \tabularnewline
54 & 87.8 & 95.8603787409932 & -8.06037874099323 \tabularnewline
55 & 115.8 & 112.47652654197 & 3.32347345803011 \tabularnewline
56 & 79.7 & 71.910826319088 & 7.78917368091195 \tabularnewline
\hline
\end{tabular}
%Source: https://freestatistics.org/blog/index.php?pk=58531&T=4

[TABLE]
[ROW][C]Multiple Linear Regression - Actuals, Interpolation, and Residuals[/C][/ROW]
[ROW][C]Time or Index[/C][C]Actuals[/C][C]InterpolationForecast[/C][C]ResidualsPrediction Error[/C][/ROW]
[ROW][C]1[/C][C]109.9[/C][C]109.212767735444[/C][C]0.68723226455576[/C][/ROW]
[ROW][C]2[/C][C]99[/C][C]99.4903502639618[/C][C]-0.490350263961782[/C][/ROW]
[ROW][C]3[/C][C]106.3[/C][C]108.580416803318[/C][C]-2.28041680331797[/C][/ROW]
[ROW][C]4[/C][C]128.9[/C][C]127.673494758077[/C][C]1.22650524192338[/C][/ROW]
[ROW][C]5[/C][C]111.1[/C][C]112.605225545926[/C][C]-1.5052255459263[/C][/ROW]
[ROW][C]6[/C][C]102.9[/C][C]114.080477357934[/C][C]-11.1804773579336[/C][/ROW]
[ROW][C]7[/C][C]130[/C][C]133.213716703208[/C][C]-3.21371670320849[/C][/ROW]
[ROW][C]8[/C][C]87[/C][C]88.4829138207926[/C][C]-1.48291382079260[/C][/ROW]
[ROW][C]9[/C][C]87.5[/C][C]79.6209068831236[/C][C]7.87909311687642[/C][/ROW]
[ROW][C]10[/C][C]117.6[/C][C]118.738210325022[/C][C]-1.13821032502169[/C][/ROW]
[ROW][C]11[/C][C]103.4[/C][C]117.078040295869[/C][C]-13.6780402958686[/C][/ROW]
[ROW][C]12[/C][C]110.8[/C][C]109.550851116525[/C][C]1.24914888347462[/C][/ROW]
[ROW][C]13[/C][C]112.6[/C][C]105.256589968687[/C][C]7.34341003131297[/C][/ROW]
[ROW][C]14[/C][C]102.5[/C][C]99.0296878672095[/C][C]3.47031213279049[/C][/ROW]
[ROW][C]15[/C][C]112.4[/C][C]115.258428606013[/C][C]-2.85842860601337[/C][/ROW]
[ROW][C]16[/C][C]135.6[/C][C]129.720004740244[/C][C]5.87999525975588[/C][/ROW]
[ROW][C]17[/C][C]105.1[/C][C]117.777551731008[/C][C]-12.6775517310083[/C][/ROW]
[ROW][C]18[/C][C]127.7[/C][C]115.833425716267[/C][C]11.8665742837331[/C][/ROW]
[ROW][C]19[/C][C]137[/C][C]137.804727638847[/C][C]-0.80472763884663[/C][/ROW]
[ROW][C]20[/C][C]91[/C][C]100.196307624162[/C][C]-9.19630762416215[/C][/ROW]
[ROW][C]21[/C][C]90.5[/C][C]93.8641767232433[/C][C]-3.36417672324327[/C][/ROW]
[ROW][C]22[/C][C]122.4[/C][C]116.292805803375[/C][C]6.10719419662516[/C][/ROW]
[ROW][C]23[/C][C]123.3[/C][C]118.760003496527[/C][C]4.53999650347329[/C][/ROW]
[ROW][C]24[/C][C]124.3[/C][C]118.008673225956[/C][C]6.29132677404438[/C][/ROW]
[ROW][C]25[/C][C]120[/C][C]121.021881733411[/C][C]-1.02188173341119[/C][/ROW]
[ROW][C]26[/C][C]118.1[/C][C]113.482383888557[/C][C]4.61761611144324[/C][/ROW]
[ROW][C]27[/C][C]119[/C][C]122.650557846509[/C][C]-3.65055784650895[/C][/ROW]
[ROW][C]28[/C][C]142.7[/C][C]138.506407104831[/C][C]4.19359289516854[/C][/ROW]
[ROW][C]29[/C][C]123.6[/C][C]126.021233992459[/C][C]-2.42123399245884[/C][/ROW]
[ROW][C]30[/C][C]129.6[/C][C]123.008156331213[/C][C]6.59184366878675[/C][/ROW]
[ROW][C]31[/C][C]151.6[/C][C]148.49064390572[/C][C]3.10935609427987[/C][/ROW]
[ROW][C]32[/C][C]110.4[/C][C]109.383307866949[/C][C]1.01669213305060[/C][/ROW]
[ROW][C]33[/C][C]99.2[/C][C]103.270199762278[/C][C]-4.07019976227828[/C][/ROW]
[ROW][C]34[/C][C]130.5[/C][C]133.652168457702[/C][C]-3.15216845770247[/C][/ROW]
[ROW][C]35[/C][C]136.2[/C][C]127.753897984626[/C][C]8.44610201537378[/C][/ROW]
[ROW][C]36[/C][C]129.7[/C][C]123.429630060671[/C][C]6.27036993932885[/C][/ROW]
[ROW][C]37[/C][C]128[/C][C]129.444294178354[/C][C]-1.44429417835389[/C][/ROW]
[ROW][C]38[/C][C]121.6[/C][C]120.262136853044[/C][C]1.33786314695553[/C][/ROW]
[ROW][C]39[/C][C]135.8[/C][C]125.527057886028[/C][C]10.2729421139719[/C][/ROW]
[ROW][C]40[/C][C]143.8[/C][C]146.396242973125[/C][C]-2.59624297312532[/C][/ROW]
[ROW][C]41[/C][C]147.5[/C][C]133.873667080235[/C][C]13.6263329197646[/C][/ROW]
[ROW][C]42[/C][C]136.2[/C][C]135.417561853593[/C][C]0.782438146406968[/C][/ROW]
[ROW][C]43[/C][C]156.6[/C][C]159.014385210255[/C][C]-2.41438521025487[/C][/ROW]
[ROW][C]44[/C][C]123.3[/C][C]121.426644369008[/C][C]1.87335563099220[/C][/ROW]
[ROW][C]45[/C][C]104.5[/C][C]104.944716631355[/C][C]-0.444716631354871[/C][/ROW]
[ROW][C]46[/C][C]139.8[/C][C]141.616815413901[/C][C]-1.816815413901[/C][/ROW]
[ROW][C]47[/C][C]136.5[/C][C]135.808058222978[/C][C]0.691941777021569[/C][/ROW]
[ROW][C]48[/C][C]112.1[/C][C]125.910845596848[/C][C]-13.8108455968478[/C][/ROW]
[ROW][C]49[/C][C]118.5[/C][C]124.064466384104[/C][C]-5.56446638410365[/C][/ROW]
[ROW][C]50[/C][C]94.4[/C][C]103.335441127227[/C][C]-8.93544112722747[/C][/ROW]
[ROW][C]51[/C][C]102.3[/C][C]103.783538858132[/C][C]-1.48353885813164[/C][/ROW]
[ROW][C]52[/C][C]111.4[/C][C]120.103850423722[/C][C]-8.70385042372248[/C][/ROW]
[ROW][C]53[/C][C]99.2[/C][C]96.2223216503712[/C][C]2.97767834962882[/C][/ROW]
[ROW][C]54[/C][C]87.8[/C][C]95.8603787409932[/C][C]-8.06037874099323[/C][/ROW]
[ROW][C]55[/C][C]115.8[/C][C]112.47652654197[/C][C]3.32347345803011[/C][/ROW]
[ROW][C]56[/C][C]79.7[/C][C]71.910826319088[/C][C]7.78917368091195[/C][/ROW]
[/TABLE]
Source: https://freestatistics.org/blog/index.php?pk=58531&T=4

Globally Unique Identifier (entire table): ba.freestatistics.org/blog/index.php?pk=58531&T=4

As an alternative you can also use a QR Code:  

The GUIDs for individual cells are displayed in the table below:

Multiple Linear Regression - Actuals, Interpolation, and Residuals
Time or IndexActualsInterpolationForecastResidualsPrediction Error
1109.9109.2127677354440.68723226455576
29999.4903502639618-0.490350263961782
3106.3108.580416803318-2.28041680331797
4128.9127.6734947580771.22650524192338
5111.1112.605225545926-1.5052255459263
6102.9114.080477357934-11.1804773579336
7130133.213716703208-3.21371670320849
88788.4829138207926-1.48291382079260
987.579.62090688312367.87909311687642
10117.6118.738210325022-1.13821032502169
11103.4117.078040295869-13.6780402958686
12110.8109.5508511165251.24914888347462
13112.6105.2565899686877.34341003131297
14102.599.02968786720953.47031213279049
15112.4115.258428606013-2.85842860601337
16135.6129.7200047402445.87999525975588
17105.1117.777551731008-12.6775517310083
18127.7115.83342571626711.8665742837331
19137137.804727638847-0.80472763884663
2091100.196307624162-9.19630762416215
2190.593.8641767232433-3.36417672324327
22122.4116.2928058033756.10719419662516
23123.3118.7600034965274.53999650347329
24124.3118.0086732259566.29132677404438
25120121.021881733411-1.02188173341119
26118.1113.4823838885574.61761611144324
27119122.650557846509-3.65055784650895
28142.7138.5064071048314.19359289516854
29123.6126.021233992459-2.42123399245884
30129.6123.0081563312136.59184366878675
31151.6148.490643905723.10935609427987
32110.4109.3833078669491.01669213305060
3399.2103.270199762278-4.07019976227828
34130.5133.652168457702-3.15216845770247
35136.2127.7538979846268.44610201537378
36129.7123.4296300606716.27036993932885
37128129.444294178354-1.44429417835389
38121.6120.2621368530441.33786314695553
39135.8125.52705788602810.2729421139719
40143.8146.396242973125-2.59624297312532
41147.5133.87366708023513.6263329197646
42136.2135.4175618535930.782438146406968
43156.6159.014385210255-2.41438521025487
44123.3121.4266443690081.87335563099220
45104.5104.944716631355-0.444716631354871
46139.8141.616815413901-1.816815413901
47136.5135.8080582229780.691941777021569
48112.1125.910845596848-13.8108455968478
49118.5124.064466384104-5.56446638410365
5094.4103.335441127227-8.93544112722747
51102.3103.783538858132-1.48353885813164
52111.4120.103850423722-8.70385042372248
5399.296.22232165037122.97767834962882
5487.895.8603787409932-8.06037874099323
55115.8112.476526541973.32347345803011
5679.771.9108263190887.78917368091195


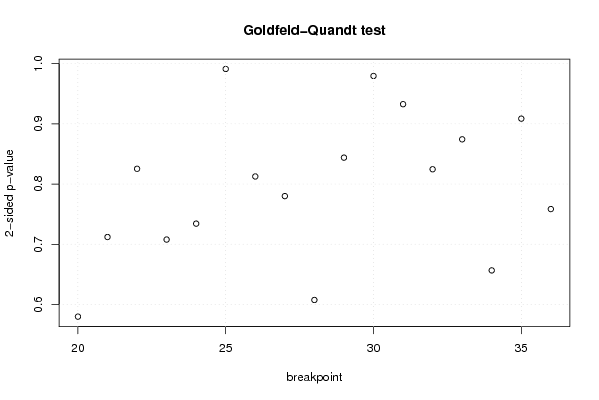
Goldfeld-Quandt test for Heteroskedasticity
p-valuesAlternative Hypothesis
breakpoint indexgreater2-sidedless
200.7100640833032980.5798718333934040.289935916696702
210.643956124832010.712087750335980.35604387516799
220.5873175606424990.8253648787150030.412682439357501
230.6460643631751460.7078712736497090.353935636824854
240.6328517679465380.7342964641069250.367148232053462
250.5044298953692590.9911402092614820.495570104630741
260.4063114092396840.8126228184793670.593688590760316
270.3900062274173010.7800124548346020.609993772582699
280.3037847004022780.6075694008045570.696215299597722
290.4219410908991750.8438821817983490.578058909100825
300.510256346779330.979487306441340.48974365322067
310.4663254220734290.9326508441468580.533674577926571
320.4122976899364850.824595379872970.587702310063515
330.5628465002506110.8743069994987770.437153499749389
340.671668057958610.6566638840827790.328331942041389
350.5456935847455830.9086128305088350.454306415254417
360.6207445562704390.7585108874591220.379255443729561

\begin{tabular}{lllllllll}
\hline
Goldfeld-Quandt test for Heteroskedasticity \tabularnewline
p-values & Alternative Hypothesis \tabularnewline
breakpoint index & greater & 2-sided & less \tabularnewline
20 & 0.710064083303298 & 0.579871833393404 & 0.289935916696702 \tabularnewline
21 & 0.64395612483201 & 0.71208775033598 & 0.35604387516799 \tabularnewline
22 & 0.587317560642499 & 0.825364878715003 & 0.412682439357501 \tabularnewline
23 & 0.646064363175146 & 0.707871273649709 & 0.353935636824854 \tabularnewline
24 & 0.632851767946538 & 0.734296464106925 & 0.367148232053462 \tabularnewline
25 & 0.504429895369259 & 0.991140209261482 & 0.495570104630741 \tabularnewline
26 & 0.406311409239684 & 0.812622818479367 & 0.593688590760316 \tabularnewline
27 & 0.390006227417301 & 0.780012454834602 & 0.609993772582699 \tabularnewline
28 & 0.303784700402278 & 0.607569400804557 & 0.696215299597722 \tabularnewline
29 & 0.421941090899175 & 0.843882181798349 & 0.578058909100825 \tabularnewline
30 & 0.51025634677933 & 0.97948730644134 & 0.48974365322067 \tabularnewline
31 & 0.466325422073429 & 0.932650844146858 & 0.533674577926571 \tabularnewline
32 & 0.412297689936485 & 0.82459537987297 & 0.587702310063515 \tabularnewline
33 & 0.562846500250611 & 0.874306999498777 & 0.437153499749389 \tabularnewline
34 & 0.67166805795861 & 0.656663884082779 & 0.328331942041389 \tabularnewline
35 & 0.545693584745583 & 0.908612830508835 & 0.454306415254417 \tabularnewline
36 & 0.620744556270439 & 0.758510887459122 & 0.379255443729561 \tabularnewline
\hline
\end{tabular}
%Source: https://freestatistics.org/blog/index.php?pk=58531&T=5

[TABLE]
[ROW][C]Goldfeld-Quandt test for Heteroskedasticity[/C][/ROW]
[ROW][C]p-values[/C][C]Alternative Hypothesis[/C][/ROW]
[ROW][C]breakpoint index[/C][C]greater[/C][C]2-sided[/C][C]less[/C][/ROW]
[ROW][C]20[/C][C]0.710064083303298[/C][C]0.579871833393404[/C][C]0.289935916696702[/C][/ROW]
[ROW][C]21[/C][C]0.64395612483201[/C][C]0.71208775033598[/C][C]0.35604387516799[/C][/ROW]
[ROW][C]22[/C][C]0.587317560642499[/C][C]0.825364878715003[/C][C]0.412682439357501[/C][/ROW]
[ROW][C]23[/C][C]0.646064363175146[/C][C]0.707871273649709[/C][C]0.353935636824854[/C][/ROW]
[ROW][C]24[/C][C]0.632851767946538[/C][C]0.734296464106925[/C][C]0.367148232053462[/C][/ROW]
[ROW][C]25[/C][C]0.504429895369259[/C][C]0.991140209261482[/C][C]0.495570104630741[/C][/ROW]
[ROW][C]26[/C][C]0.406311409239684[/C][C]0.812622818479367[/C][C]0.593688590760316[/C][/ROW]
[ROW][C]27[/C][C]0.390006227417301[/C][C]0.780012454834602[/C][C]0.609993772582699[/C][/ROW]
[ROW][C]28[/C][C]0.303784700402278[/C][C]0.607569400804557[/C][C]0.696215299597722[/C][/ROW]
[ROW][C]29[/C][C]0.421941090899175[/C][C]0.843882181798349[/C][C]0.578058909100825[/C][/ROW]
[ROW][C]30[/C][C]0.51025634677933[/C][C]0.97948730644134[/C][C]0.48974365322067[/C][/ROW]
[ROW][C]31[/C][C]0.466325422073429[/C][C]0.932650844146858[/C][C]0.533674577926571[/C][/ROW]
[ROW][C]32[/C][C]0.412297689936485[/C][C]0.82459537987297[/C][C]0.587702310063515[/C][/ROW]
[ROW][C]33[/C][C]0.562846500250611[/C][C]0.874306999498777[/C][C]0.437153499749389[/C][/ROW]
[ROW][C]34[/C][C]0.67166805795861[/C][C]0.656663884082779[/C][C]0.328331942041389[/C][/ROW]
[ROW][C]35[/C][C]0.545693584745583[/C][C]0.908612830508835[/C][C]0.454306415254417[/C][/ROW]
[ROW][C]36[/C][C]0.620744556270439[/C][C]0.758510887459122[/C][C]0.379255443729561[/C][/ROW]
[/TABLE]
Source: https://freestatistics.org/blog/index.php?pk=58531&T=5

Globally Unique Identifier (entire table): ba.freestatistics.org/blog/index.php?pk=58531&T=5

As an alternative you can also use a QR Code:  

The GUIDs for individual cells are displayed in the table below:

Goldfeld-Quandt test for Heteroskedasticity
p-valuesAlternative Hypothesis
breakpoint indexgreater2-sidedless
200.7100640833032980.5798718333934040.289935916696702
210.643956124832010.712087750335980.35604387516799
220.5873175606424990.8253648787150030.412682439357501
230.6460643631751460.7078712736497090.353935636824854
240.6328517679465380.7342964641069250.367148232053462
250.5044298953692590.9911402092614820.495570104630741
260.4063114092396840.8126228184793670.593688590760316
270.3900062274173010.7800124548346020.609993772582699
280.3037847004022780.6075694008045570.696215299597722
290.4219410908991750.8438821817983490.578058909100825
300.510256346779330.979487306441340.48974365322067
310.4663254220734290.9326508441468580.533674577926571
320.4122976899364850.824595379872970.587702310063515
330.5628465002506110.8743069994987770.437153499749389
340.671668057958610.6566638840827790.328331942041389
350.5456935847455830.9086128305088350.454306415254417
360.6207445562704390.7585108874591220.379255443729561


Meta Analysis of Goldfeld-Quandt test for Heteroskedasticity
Description# significant tests% significant testsOK/NOK
1% type I error level00OK
5% type I error level00OK
10% type I error level00OK

\begin{tabular}{lllllllll}
\hline
Meta Analysis of Goldfeld-Quandt test for Heteroskedasticity \tabularnewline
Description & # significant tests & % significant tests & OK/NOK \tabularnewline
1% type I error level & 0 & 0 & OK \tabularnewline
5% type I error level & 0 & 0 & OK \tabularnewline
10% type I error level & 0 & 0 & OK \tabularnewline
\hline
\end{tabular}
%Source: https://freestatistics.org/blog/index.php?pk=58531&T=6

[TABLE]
[ROW][C]Meta Analysis of Goldfeld-Quandt test for Heteroskedasticity[/C][/ROW]
[ROW][C]Description[/C][C]# significant tests[/C][C]% significant tests[/C][C]OK/NOK[/C][/ROW]
[ROW][C]1% type I error level[/C][C]0[/C][C]0[/C][C]OK[/C][/ROW]
[ROW][C]5% type I error level[/C][C]0[/C][C]0[/C][C]OK[/C][/ROW]
[ROW][C]10% type I error level[/C][C]0[/C][C]0[/C][C]OK[/C][/ROW]
[/TABLE]
Source: https://freestatistics.org/blog/index.php?pk=58531&T=6

Globally Unique Identifier (entire table): ba.freestatistics.org/blog/index.php?pk=58531&T=6

As an alternative you can also use a QR Code:  

The GUIDs for individual cells are displayed in the table below:

Meta Analysis of Goldfeld-Quandt test for Heteroskedasticity
Description# significant tests% significant testsOK/NOK
1% type I error level00OK
5% type I error level00OK
10% type I error level00OK


Parameters (Session):
par1 = 1 ; par2 = Include Monthly Dummies ; par3 = Linear Trend ;
Parameters (R input):
par1 = 1 ; par2 = Include Monthly Dummies ; par3 = Linear Trend ;
R code (references can be found in the software module):
library(lattice)
library(lmtest)
n25 <- 25 #minimum number of obs. for Goldfeld-Quandt test
par1 <- as.numeric(par1)
x <- t(y)
k <- length(x[1,])
n <- length(x[,1])
x1 <- cbind(x[,par1], x[,1:k!=par1])
mycolnames <- c(colnames(x)[par1], colnames(x)[1:k!=par1])
colnames(x1) <- mycolnames #colnames(x)[par1]
x <- x1
if (par3 == 'First Differences'){
x2 <- array(0, dim=c(n-1,k), dimnames=list(1:(n-1), paste('(1-B)',colnames(x),sep='')))
for (i in 1:n-1) {
for (j in 1:k) {
x2[i,j] <- x[i+1,j] - x[i,j]
}
}
x <- x2
}
if (par2 == 'Include Monthly Dummies'){
x2 <- array(0, dim=c(n,11), dimnames=list(1:n, paste('M', seq(1:11), sep ='')))
for (i in 1:11){
x2[seq(i,n,12),i] <- 1
}
x <- cbind(x, x2)
}
if (par2 == 'Include Quarterly Dummies'){
x2 <- array(0, dim=c(n,3), dimnames=list(1:n, paste('Q', seq(1:3), sep ='')))
for (i in 1:3){
x2[seq(i,n,4),i] <- 1
}
x <- cbind(x, x2)
}
k <- length(x[1,])
if (par3 == 'Linear Trend'){
x <- cbind(x, c(1:n))
colnames(x)[k+1] <- 't'
}
x
k <- length(x[1,])
df <- as.data.frame(x)
(mylm <- lm(df))
(mysum <- summary(mylm))
if (n > n25) {
kp3 <- k + 3
nmkm3 <- n - k - 3
gqarr <- array(NA, dim=c(nmkm3-kp3+1,3))
numgqtests <- 0
numsignificant1 <- 0
numsignificant5 <- 0
numsignificant10 <- 0
for (mypoint in kp3:nmkm3) {
j <- 0
numgqtests <- numgqtests + 1
for (myalt in c('greater', 'two.sided', 'less')) {
j <- j + 1
gqarr[mypoint-kp3+1,j] <- gqtest(mylm, point=mypoint, alternative=myalt)$p.value
}
if (gqarr[mypoint-kp3+1,2] < 0.01) numsignificant1 <- numsignificant1 + 1
if (gqarr[mypoint-kp3+1,2] < 0.05) numsignificant5 <- numsignificant5 + 1
if (gqarr[mypoint-kp3+1,2] < 0.10) numsignificant10 <- numsignificant10 + 1
}
gqarr
}
bitmap(file='test0.png')
plot(x[,1], type='l', main='Actuals and Interpolation', ylab='value of Actuals and Interpolation (dots)', xlab='time or index')
points(x[,1]-mysum$resid)
grid()
dev.off()
bitmap(file='test1.png')
plot(mysum$resid, type='b', pch=19, main='Residuals', ylab='value of Residuals', xlab='time or index')
grid()
dev.off()
bitmap(file='test2.png')
hist(mysum$resid, main='Residual Histogram', xlab='values of Residuals')
grid()
dev.off()
bitmap(file='test3.png')
densityplot(~mysum$resid,col='black',main='Residual Density Plot', xlab='values of Residuals')
dev.off()
bitmap(file='test4.png')
qqnorm(mysum$resid, main='Residual Normal Q-Q Plot')
qqline(mysum$resid)
grid()
dev.off()
(myerror <- as.ts(mysum$resid))
bitmap(file='test5.png')
dum <- cbind(lag(myerror,k=1),myerror)
dum
dum1 <- dum[2:length(myerror),]
dum1
z <- as.data.frame(dum1)
z
plot(z,main=paste('Residual Lag plot, lowess, and regression line'), ylab='values of Residuals', xlab='lagged values of Residuals')
lines(lowess(z))
abline(lm(z))
grid()
dev.off()
bitmap(file='test6.png')
acf(mysum$resid, lag.max=length(mysum$resid)/2, main='Residual Autocorrelation Function')
grid()
dev.off()
bitmap(file='test7.png')
pacf(mysum$resid, lag.max=length(mysum$resid)/2, main='Residual Partial Autocorrelation Function')
grid()
dev.off()
bitmap(file='test8.png')
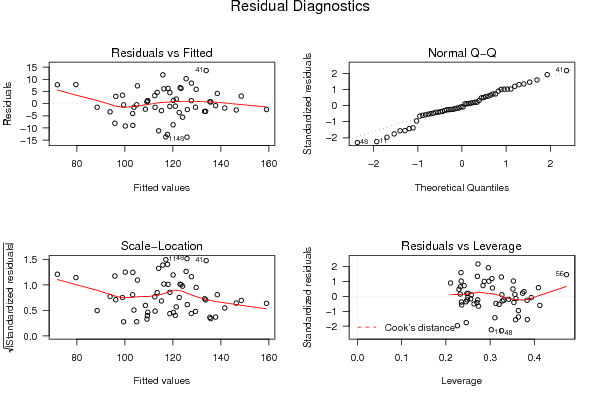
opar <- par(mfrow = c(2,2), oma = c(0, 0, 1.1, 0))
plot(mylm, las = 1, sub='Residual Diagnostics')
par(opar)
dev.off()
if (n > n25) {
bitmap(file='test9.png')
plot(kp3:nmkm3,gqarr[,2], main='Goldfeld-Quandt test',ylab='2-sided p-value',xlab='breakpoint')
grid()
dev.off()
}
load(file='createtable')
a<-table.start()
a<-table.row.start(a)
a<-table.element(a, 'Multiple Linear Regression - Estimated Regression Equation', 1, TRUE)
a<-table.row.end(a)
myeq <- colnames(x)[1]
myeq <- paste(myeq, '[t] = ', sep='')
for (i in 1:k){
if (mysum$coefficients[i,1] > 0) myeq <- paste(myeq, '+', '')
myeq <- paste(myeq, mysum$coefficients[i,1], sep=' ')
if (rownames(mysum$coefficients)[i] != '(Intercept)') {
myeq <- paste(myeq, rownames(mysum$coefficients)[i], sep='')
if (rownames(mysum$coefficients)[i] != 't') myeq <- paste(myeq, '[t]', sep='')
}
}
myeq <- paste(myeq, ' + e[t]')
a<-table.row.start(a)
a<-table.element(a, myeq)
a<-table.row.end(a)
a<-table.end(a)
table.save(a,file='mytable1.tab')
a<-table.start()
a<-table.row.start(a)
a<-table.element(a,hyperlink('ols1.htm','Multiple Linear Regression - Ordinary Least Squares',''), 6, TRUE)
a<-table.row.end(a)
a<-table.row.start(a)
a<-table.element(a,'Variable',header=TRUE)
a<-table.element(a,'Parameter',header=TRUE)
a<-table.element(a,'S.D.',header=TRUE)
a<-table.element(a,'T-STAT
H0: parameter = 0',header=TRUE)
a<-table.element(a,'2-tail p-value',header=TRUE)
a<-table.element(a,'1-tail p-value',header=TRUE)
a<-table.row.end(a)
for (i in 1:k){
a<-table.row.start(a)
a<-table.element(a,rownames(mysum$coefficients)[i],header=TRUE)
a<-table.element(a,mysum$coefficients[i,1])
a<-table.element(a, round(mysum$coefficients[i,2],6))
a<-table.element(a, round(mysum$coefficients[i,3],4))
a<-table.element(a, round(mysum$coefficients[i,4],6))
a<-table.element(a, round(mysum$coefficients[i,4]/2,6))
a<-table.row.end(a)
}
a<-table.end(a)
table.save(a,file='mytable2.tab')
a<-table.start()
a<-table.row.start(a)
a<-table.element(a, 'Multiple Linear Regression - Regression Statistics', 2, TRUE)
a<-table.row.end(a)
a<-table.row.start(a)
a<-table.element(a, 'Multiple R',1,TRUE)
a<-table.element(a, sqrt(mysum$r.squared))
a<-table.row.end(a)
a<-table.row.start(a)
a<-table.element(a, 'R-squared',1,TRUE)
a<-table.element(a, mysum$r.squared)
a<-table.row.end(a)
a<-table.row.start(a)
a<-table.element(a, 'Adjusted R-squared',1,TRUE)
a<-table.element(a, mysum$adj.r.squared)
a<-table.row.end(a)
a<-table.row.start(a)
a<-table.element(a, 'F-TEST (value)',1,TRUE)
a<-table.element(a, mysum$fstatistic[1])
a<-table.row.end(a)
a<-table.row.start(a)
a<-table.element(a, 'F-TEST (DF numerator)',1,TRUE)
a<-table.element(a, mysum$fstatistic[2])
a<-table.row.end(a)
a<-table.row.start(a)
a<-table.element(a, 'F-TEST (DF denominator)',1,TRUE)
a<-table.element(a, mysum$fstatistic[3])
a<-table.row.end(a)
a<-table.row.start(a)
a<-table.element(a, 'p-value',1,TRUE)
a<-table.element(a, 1-pf(mysum$fstatistic[1],mysum$fstatistic[2],mysum$fstatistic[3]))
a<-table.row.end(a)
a<-table.row.start(a)
a<-table.element(a, 'Multiple Linear Regression - Residual Statistics', 2, TRUE)
a<-table.row.end(a)
a<-table.row.start(a)
a<-table.element(a, 'Residual Standard Deviation',1,TRUE)
a<-table.element(a, mysum$sigma)
a<-table.row.end(a)
a<-table.row.start(a)
a<-table.element(a, 'Sum Squared Residuals',1,TRUE)
a<-table.element(a, sum(myerror*myerror))
a<-table.row.end(a)
a<-table.end(a)
table.save(a,file='mytable3.tab')
a<-table.start()
a<-table.row.start(a)
a<-table.element(a, 'Multiple Linear Regression - Actuals, Interpolation, and Residuals', 4, TRUE)
a<-table.row.end(a)
a<-table.row.start(a)
a<-table.element(a, 'Time or Index', 1, TRUE)
a<-table.element(a, 'Actuals', 1, TRUE)
a<-table.element(a, 'Interpolation
Forecast', 1, TRUE)
a<-table.element(a, 'Residuals
Prediction Error', 1, TRUE)
a<-table.row.end(a)
for (i in 1:n) {
a<-table.row.start(a)
a<-table.element(a,i, 1, TRUE)
a<-table.element(a,x[i])
a<-table.element(a,x[i]-mysum$resid[i])
a<-table.element(a,mysum$resid[i])
a<-table.row.end(a)
}
a<-table.end(a)
table.save(a,file='mytable4.tab')
if (n > n25) {
a<-table.start()
a<-table.row.start(a)
a<-table.element(a,'Goldfeld-Quandt test for Heteroskedasticity',4,TRUE)
a<-table.row.end(a)
a<-table.row.start(a)
a<-table.element(a,'p-values',header=TRUE)
a<-table.element(a,'Alternative Hypothesis',3,header=TRUE)
a<-table.row.end(a)
a<-table.row.start(a)
a<-table.element(a,'breakpoint index',header=TRUE)
a<-table.element(a,'greater',header=TRUE)
a<-table.element(a,'2-sided',header=TRUE)
a<-table.element(a,'less',header=TRUE)
a<-table.row.end(a)
for (mypoint in kp3:nmkm3) {
a<-table.row.start(a)
a<-table.element(a,mypoint,header=TRUE)
a<-table.element(a,gqarr[mypoint-kp3+1,1])
a<-table.element(a,gqarr[mypoint-kp3+1,2])
a<-table.element(a,gqarr[mypoint-kp3+1,3])
a<-table.row.end(a)
}
a<-table.end(a)
table.save(a,file='mytable5.tab')
a<-table.start()
a<-table.row.start(a)
a<-table.element(a,'Meta Analysis of Goldfeld-Quandt test for Heteroskedasticity',4,TRUE)
a<-table.row.end(a)
a<-table.row.start(a)
a<-table.element(a,'Description',header=TRUE)
a<-table.element(a,'# significant tests',header=TRUE)
a<-table.element(a,'% significant tests',header=TRUE)
a<-table.element(a,'OK/NOK',header=TRUE)
a<-table.row.end(a)
a<-table.row.start(a)
a<-table.element(a,'1% type I error level',header=TRUE)
a<-table.element(a,numsignificant1)
a<-table.element(a,numsignificant1/numgqtests)
if (numsignificant1/numgqtests < 0.01) dum <- 'OK' else dum <- 'NOK'
a<-table.element(a,dum)
a<-table.row.end(a)
a<-table.row.start(a)
a<-table.element(a,'5% type I error level',header=TRUE)
a<-table.element(a,numsignificant5)
a<-table.element(a,numsignificant5/numgqtests)
if (numsignificant5/numgqtests < 0.05) dum <- 'OK' else dum <- 'NOK'
a<-table.element(a,dum)
a<-table.row.end(a)
a<-table.row.start(a)
a<-table.element(a,'10% type I error level',header=TRUE)
a<-table.element(a,numsignificant10)
a<-table.element(a,numsignificant10/numgqtests)
if (numsignificant10/numgqtests < 0.1) dum <- 'OK' else dum <- 'NOK'
a<-table.element(a,dum)
a<-table.row.end(a)
a<-table.end(a)
table.save(a,file='mytable6.tab')
}