Free Statistics

of Irreproducible Research!

Author's title

Author*The author of this computation has been verified*
R Software Modulerwasp_multipleregression.wasp
Title produced by softwareMultiple Regression
Date of computationSat, 21 Nov 2009 04:46:46 -0700
Cite this page as followsStatistical Computations at FreeStatistics.org, Office for Research Development and Education, URL https://freestatistics.org/blog/index.php?v=date/2009/Nov/21/t1258805031fbtpzjogdtwtivv.htm/, Retrieved Sun, 28 Apr 2024 09:42:03 +0000
Statistical Computations at FreeStatistics.org, Office for Research Development and Education, URL https://freestatistics.org/blog/index.php?pk=58532, Retrieved Sun, 28 Apr 2024 09:42:03 +0000
QR Codes:

Original text written by user:
IsPrivate?No (this computation is public)
User-defined keywords
Estimated Impact235
Family? (F = Feedback message, R = changed R code, M = changed R Module, P = changed Parameters, D = changed Data)
-     [Multiple Regression] [Q1 The Seatbeltlaw] [2007-11-14 19:27:43] [8cd6641b921d30ebe00b648d1481bba0]
- RMPD  [Multiple Regression] [Seatbelt] [2009-11-12 13:54:52] [b98453cac15ba1066b407e146608df68]
-    D      [Multiple Regression] [WS7.1] [2009-11-21 11:46:46] [dd4f17965cad1d38de7a1c062d32d75d] [Current]
Feedback Forum

Post a new message
Dataseries X:
269285	8.2
269829	8
270911	7.5
266844	6.8
271244	6.5
269907	6.6
271296	7.6
270157	8
271322	8.1
267179	7.7
264101	7.5
265518	7.6
269419	7.8
268714	7.8
272482	7.8
268351	7.5
268175	7.5
270674	7.1
272764	7.5
272599	7.5
270333	7.6
270846	7.7
270491	7.7
269160	7.9
274027	8.1
273784	8.2
276663	8.2
274525	8.2
271344	7.9
271115	7.3
270798	6.9
273911	6.6
273985	6.7
271917	6.9
273338	7
270601	7.1
273547	7.2
275363	7.1
281229	6.9
277793	7
279913	6.8
282500	6.4
280041	6.7
282166	6.6
290304	6.4
283519	6.3
287816	6.2
285226	6.5
287595	6.8
289741	6.8
289148	6.4
288301	6.1
290155	5.8
289648	6.1
288225	7.2
289351	7.3
294735	6.9
305333	6.1
309030	5.8
310215	6.2
321935	7.1
325734	7.7
320846	7.9
323023	7.7
319753	7.4
321753	7.5
320757	8
324479	8.1


Summary of computational transaction
Raw Inputview raw input (R code)
Raw Outputview raw output of R engine
Computing time3 seconds
R Server'Gwilym Jenkins' @ 72.249.127.135

\begin{tabular}{lllllllll}
\hline
Summary of computational transaction \tabularnewline
Raw Input & view raw input (R code)  \tabularnewline
Raw Output & view raw output of R engine  \tabularnewline
Computing time & 3 seconds \tabularnewline
R Server & 'Gwilym Jenkins' @ 72.249.127.135 \tabularnewline
\hline
\end{tabular}
%Source: https://freestatistics.org/blog/index.php?pk=58532&T=0

[TABLE]
[ROW][C]Summary of computational transaction[/C][/ROW]
[ROW][C]Raw Input[/C][C]view raw input (R code) [/C][/ROW]
[ROW][C]Raw Output[/C][C]view raw output of R engine [/C][/ROW]
[ROW][C]Computing time[/C][C]3 seconds[/C][/ROW]
[ROW][C]R Server[/C][C]'Gwilym Jenkins' @ 72.249.127.135[/C][/ROW]
[/TABLE]
Source: https://freestatistics.org/blog/index.php?pk=58532&T=0

Globally Unique Identifier (entire table): ba.freestatistics.org/blog/index.php?pk=58532&T=0

As an alternative you can also use a QR Code:  

The GUIDs for individual cells are displayed in the table below:

Summary of computational transaction
Raw Inputview raw input (R code)
Raw Outputview raw output of R engine
Computing time3 seconds
R Server'Gwilym Jenkins' @ 72.249.127.135


Multiple Linear Regression - Estimated Regression Equation
Y[t] = + 311562.654532305 -3981.77595628416X[t] + e[t]

\begin{tabular}{lllllllll}
\hline
Multiple Linear Regression - Estimated Regression Equation \tabularnewline
Y[t] =  +  311562.654532305 -3981.77595628416X[t]  + e[t] \tabularnewline
\hline
\end{tabular}
%Source: https://freestatistics.org/blog/index.php?pk=58532&T=1

[TABLE]
[ROW][C]Multiple Linear Regression - Estimated Regression Equation[/C][/ROW]
[ROW][C]Y[t] =  +  311562.654532305 -3981.77595628416X[t]  + e[t][/C][/ROW]
[/TABLE]
Source: https://freestatistics.org/blog/index.php?pk=58532&T=1

Globally Unique Identifier (entire table): ba.freestatistics.org/blog/index.php?pk=58532&T=1

As an alternative you can also use a QR Code:  

The GUIDs for individual cells are displayed in the table below:

Multiple Linear Regression - Estimated Regression Equation
Y[t] = + 311562.654532305 -3981.77595628416X[t] + e[t]


Multiple Linear Regression - Ordinary Least Squares
VariableParameterS.D.T-STATH0: parameter = 02-tail p-value1-tail p-value
(Intercept)311562.65453230523351.99445713.34200
X-3981.775956284163229.946175-1.23280.2220350.111018

\begin{tabular}{lllllllll}
\hline
Multiple Linear Regression - Ordinary Least Squares \tabularnewline
Variable & Parameter & S.D. & T-STATH0: parameter = 0 & 2-tail p-value & 1-tail p-value \tabularnewline
(Intercept) & 311562.654532305 & 23351.994457 & 13.342 & 0 & 0 \tabularnewline
X & -3981.77595628416 & 3229.946175 & -1.2328 & 0.222035 & 0.111018 \tabularnewline
\hline
\end{tabular}
%Source: https://freestatistics.org/blog/index.php?pk=58532&T=2

[TABLE]
[ROW][C]Multiple Linear Regression - Ordinary Least Squares[/C][/ROW]
[ROW][C]Variable[/C][C]Parameter[/C][C]S.D.[/C][C]T-STATH0: parameter = 0[/C][C]2-tail p-value[/C][C]1-tail p-value[/C][/ROW]
[ROW][C](Intercept)[/C][C]311562.654532305[/C][C]23351.994457[/C][C]13.342[/C][C]0[/C][C]0[/C][/ROW]
[ROW][C]X[/C][C]-3981.77595628416[/C][C]3229.946175[/C][C]-1.2328[/C][C]0.222035[/C][C]0.111018[/C][/ROW]
[/TABLE]
Source: https://freestatistics.org/blog/index.php?pk=58532&T=2

Globally Unique Identifier (entire table): ba.freestatistics.org/blog/index.php?pk=58532&T=2

As an alternative you can also use a QR Code:  

The GUIDs for individual cells are displayed in the table below:

Multiple Linear Regression - Ordinary Least Squares
VariableParameterS.D.T-STATH0: parameter = 02-tail p-value1-tail p-value
(Intercept)311562.65453230523351.99445713.34200
X-3981.775956284163229.946175-1.23280.2220350.111018


Multiple Linear Regression - Regression Statistics
Multiple R0.150025894245578
R-squared0.0225077689441853
Adjusted R-squared0.00769728059485475
F-TEST (value)1.51971821680024
F-TEST (DF numerator)1
F-TEST (DF denominator)66
p-value0.222035285073425
Multiple Linear Regression - Residual Statistics
Residual Standard Deviation17477.5607884229
Sum Squared Residuals20160698653.4591

\begin{tabular}{lllllllll}
\hline
Multiple Linear Regression - Regression Statistics \tabularnewline
Multiple R & 0.150025894245578 \tabularnewline
R-squared & 0.0225077689441853 \tabularnewline
Adjusted R-squared & 0.00769728059485475 \tabularnewline
F-TEST (value) & 1.51971821680024 \tabularnewline
F-TEST (DF numerator) & 1 \tabularnewline
F-TEST (DF denominator) & 66 \tabularnewline
p-value & 0.222035285073425 \tabularnewline
Multiple Linear Regression - Residual Statistics \tabularnewline
Residual Standard Deviation & 17477.5607884229 \tabularnewline
Sum Squared Residuals & 20160698653.4591 \tabularnewline
\hline
\end{tabular}
%Source: https://freestatistics.org/blog/index.php?pk=58532&T=3

[TABLE]
[ROW][C]Multiple Linear Regression - Regression Statistics[/C][/ROW]
[ROW][C]Multiple R[/C][C]0.150025894245578[/C][/ROW]
[ROW][C]R-squared[/C][C]0.0225077689441853[/C][/ROW]
[ROW][C]Adjusted R-squared[/C][C]0.00769728059485475[/C][/ROW]
[ROW][C]F-TEST (value)[/C][C]1.51971821680024[/C][/ROW]
[ROW][C]F-TEST (DF numerator)[/C][C]1[/C][/ROW]
[ROW][C]F-TEST (DF denominator)[/C][C]66[/C][/ROW]
[ROW][C]p-value[/C][C]0.222035285073425[/C][/ROW]
[ROW][C]Multiple Linear Regression - Residual Statistics[/C][/ROW]
[ROW][C]Residual Standard Deviation[/C][C]17477.5607884229[/C][/ROW]
[ROW][C]Sum Squared Residuals[/C][C]20160698653.4591[/C][/ROW]
[/TABLE]
Source: https://freestatistics.org/blog/index.php?pk=58532&T=3

Globally Unique Identifier (entire table): ba.freestatistics.org/blog/index.php?pk=58532&T=3

As an alternative you can also use a QR Code:  

The GUIDs for individual cells are displayed in the table below:

Multiple Linear Regression - Regression Statistics
Multiple R0.150025894245578
R-squared0.0225077689441853
Adjusted R-squared0.00769728059485475
F-TEST (value)1.51971821680024
F-TEST (DF numerator)1
F-TEST (DF denominator)66
p-value0.222035285073425
Multiple Linear Regression - Residual Statistics
Residual Standard Deviation17477.5607884229
Sum Squared Residuals20160698653.4591


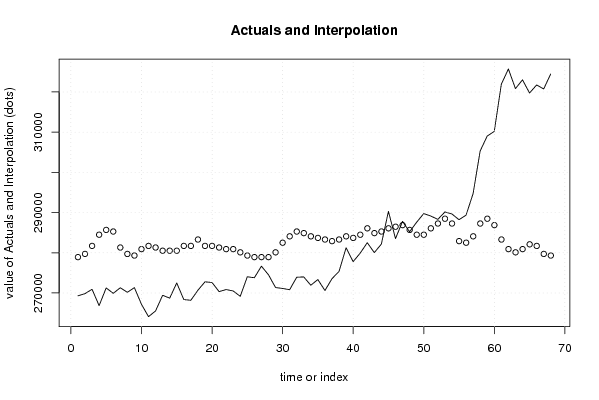
Multiple Linear Regression - Actuals, Interpolation, and Residuals
Time or IndexActualsInterpolationForecastResidualsPrediction Error
1269285278912.091690775-9627.09169077527
2269829279708.446882032-9879.44688203148
3270911281699.334860174-10788.3348601736
4266844284486.578029572-17642.5780295725
5271244285681.110816458-14437.1108164577
6269907285282.933220829-15375.9332208293
7271296281301.157264545-10005.1572645451
8270157279708.446882032-9551.44688203148
9271322279310.269286403-7988.26928640307
10267179280902.979668917-13723.9796689167
11264101281699.334860174-17598.3348601736
12265518281301.157264545-15783.1572645451
13269419280504.802073288-11085.8020732883
14268714280504.802073288-11790.8020732883
15272482280504.802073288-8022.80207328832
16268351281699.334860174-13348.3348601736
17268175281699.334860174-13524.3348601736
18270674283292.045242687-12618.0452426872
19272764281699.334860174-8935.33486017357
20272599281699.334860174-9100.33486017357
21270333281301.157264545-10968.1572645451
22270846280902.979668917-10056.9796689167
23270491280902.979668917-10411.9796689167
24269160280106.62447766-10946.6244776599
25274027279310.269286403-5283.26928640307
26273784278912.091690775-5128.09169077465
27276663278912.091690775-2249.09169077465
28274525278912.091690775-4387.09169077465
29271344280106.62447766-8762.6244776599
30271115282495.690051430-11380.6900514304
31270798284088.400433944-13290.4004339441
32273911285282.933220829-11371.9332208293
33273985284884.755625201-10899.7556252009
34271917284088.400433944-12171.4004339441
35273338283690.222838316-10352.2228383156
36270601283292.045242687-12691.0452426872
37273547282893.867647059-9346.86764705881
38275363283292.045242687-7929.04524268723
39281229284088.400433944-2859.40043394406
40277793283690.222838316-5897.22283831565
41279913284486.578029572-4573.57802957248
42282500286079.288412086-3579.28841208614
43280041284884.755625201-4843.7556252009
44282166285282.933220829-3116.93322082931
45290304286079.2884120864224.71158791386
46283519286477.466007715-2958.46600771456
47287816286875.643603343940.356396657022
48285226285681.110816458-455.110816457729
49287595284486.5780295723108.42197042752
50289741284486.5780295725254.42197042752
51289148286079.2884120863068.71158791386
52288301287273.8211989711027.17880102860
53290155288468.3539858571686.64601414335
54289648287273.8211989712374.1788010286
55288225282893.8676470595331.13235294119
56289351282495.6900514306855.3099485696
57294735284088.40043394410646.5995660559
58305333287273.82119897118059.1788010286
59309030288468.35398585720561.6460141434
60310215286875.64360334323339.3563966570
61321935283292.04524268738642.9547573128
62325734280902.97966891744831.0203310833
63320846280106.6244776640739.3755223401
64323023280902.97966891742120.0203310833
65319753282097.51245580237655.487544198
66321753281699.33486017440053.6651398264
67320757279708.44688203241048.5531179685
68324479279310.26928640345168.7307135969

\begin{tabular}{lllllllll}
\hline
Multiple Linear Regression - Actuals, Interpolation, and Residuals \tabularnewline
Time or Index & Actuals & InterpolationForecast & ResidualsPrediction Error \tabularnewline
1 & 269285 & 278912.091690775 & -9627.09169077527 \tabularnewline
2 & 269829 & 279708.446882032 & -9879.44688203148 \tabularnewline
3 & 270911 & 281699.334860174 & -10788.3348601736 \tabularnewline
4 & 266844 & 284486.578029572 & -17642.5780295725 \tabularnewline
5 & 271244 & 285681.110816458 & -14437.1108164577 \tabularnewline
6 & 269907 & 285282.933220829 & -15375.9332208293 \tabularnewline
7 & 271296 & 281301.157264545 & -10005.1572645451 \tabularnewline
8 & 270157 & 279708.446882032 & -9551.44688203148 \tabularnewline
9 & 271322 & 279310.269286403 & -7988.26928640307 \tabularnewline
10 & 267179 & 280902.979668917 & -13723.9796689167 \tabularnewline
11 & 264101 & 281699.334860174 & -17598.3348601736 \tabularnewline
12 & 265518 & 281301.157264545 & -15783.1572645451 \tabularnewline
13 & 269419 & 280504.802073288 & -11085.8020732883 \tabularnewline
14 & 268714 & 280504.802073288 & -11790.8020732883 \tabularnewline
15 & 272482 & 280504.802073288 & -8022.80207328832 \tabularnewline
16 & 268351 & 281699.334860174 & -13348.3348601736 \tabularnewline
17 & 268175 & 281699.334860174 & -13524.3348601736 \tabularnewline
18 & 270674 & 283292.045242687 & -12618.0452426872 \tabularnewline
19 & 272764 & 281699.334860174 & -8935.33486017357 \tabularnewline
20 & 272599 & 281699.334860174 & -9100.33486017357 \tabularnewline
21 & 270333 & 281301.157264545 & -10968.1572645451 \tabularnewline
22 & 270846 & 280902.979668917 & -10056.9796689167 \tabularnewline
23 & 270491 & 280902.979668917 & -10411.9796689167 \tabularnewline
24 & 269160 & 280106.62447766 & -10946.6244776599 \tabularnewline
25 & 274027 & 279310.269286403 & -5283.26928640307 \tabularnewline
26 & 273784 & 278912.091690775 & -5128.09169077465 \tabularnewline
27 & 276663 & 278912.091690775 & -2249.09169077465 \tabularnewline
28 & 274525 & 278912.091690775 & -4387.09169077465 \tabularnewline
29 & 271344 & 280106.62447766 & -8762.6244776599 \tabularnewline
30 & 271115 & 282495.690051430 & -11380.6900514304 \tabularnewline
31 & 270798 & 284088.400433944 & -13290.4004339441 \tabularnewline
32 & 273911 & 285282.933220829 & -11371.9332208293 \tabularnewline
33 & 273985 & 284884.755625201 & -10899.7556252009 \tabularnewline
34 & 271917 & 284088.400433944 & -12171.4004339441 \tabularnewline
35 & 273338 & 283690.222838316 & -10352.2228383156 \tabularnewline
36 & 270601 & 283292.045242687 & -12691.0452426872 \tabularnewline
37 & 273547 & 282893.867647059 & -9346.86764705881 \tabularnewline
38 & 275363 & 283292.045242687 & -7929.04524268723 \tabularnewline
39 & 281229 & 284088.400433944 & -2859.40043394406 \tabularnewline
40 & 277793 & 283690.222838316 & -5897.22283831565 \tabularnewline
41 & 279913 & 284486.578029572 & -4573.57802957248 \tabularnewline
42 & 282500 & 286079.288412086 & -3579.28841208614 \tabularnewline
43 & 280041 & 284884.755625201 & -4843.7556252009 \tabularnewline
44 & 282166 & 285282.933220829 & -3116.93322082931 \tabularnewline
45 & 290304 & 286079.288412086 & 4224.71158791386 \tabularnewline
46 & 283519 & 286477.466007715 & -2958.46600771456 \tabularnewline
47 & 287816 & 286875.643603343 & 940.356396657022 \tabularnewline
48 & 285226 & 285681.110816458 & -455.110816457729 \tabularnewline
49 & 287595 & 284486.578029572 & 3108.42197042752 \tabularnewline
50 & 289741 & 284486.578029572 & 5254.42197042752 \tabularnewline
51 & 289148 & 286079.288412086 & 3068.71158791386 \tabularnewline
52 & 288301 & 287273.821198971 & 1027.17880102860 \tabularnewline
53 & 290155 & 288468.353985857 & 1686.64601414335 \tabularnewline
54 & 289648 & 287273.821198971 & 2374.1788010286 \tabularnewline
55 & 288225 & 282893.867647059 & 5331.13235294119 \tabularnewline
56 & 289351 & 282495.690051430 & 6855.3099485696 \tabularnewline
57 & 294735 & 284088.400433944 & 10646.5995660559 \tabularnewline
58 & 305333 & 287273.821198971 & 18059.1788010286 \tabularnewline
59 & 309030 & 288468.353985857 & 20561.6460141434 \tabularnewline
60 & 310215 & 286875.643603343 & 23339.3563966570 \tabularnewline
61 & 321935 & 283292.045242687 & 38642.9547573128 \tabularnewline
62 & 325734 & 280902.979668917 & 44831.0203310833 \tabularnewline
63 & 320846 & 280106.62447766 & 40739.3755223401 \tabularnewline
64 & 323023 & 280902.979668917 & 42120.0203310833 \tabularnewline
65 & 319753 & 282097.512455802 & 37655.487544198 \tabularnewline
66 & 321753 & 281699.334860174 & 40053.6651398264 \tabularnewline
67 & 320757 & 279708.446882032 & 41048.5531179685 \tabularnewline
68 & 324479 & 279310.269286403 & 45168.7307135969 \tabularnewline
\hline
\end{tabular}
%Source: https://freestatistics.org/blog/index.php?pk=58532&T=4

[TABLE]
[ROW][C]Multiple Linear Regression - Actuals, Interpolation, and Residuals[/C][/ROW]
[ROW][C]Time or Index[/C][C]Actuals[/C][C]InterpolationForecast[/C][C]ResidualsPrediction Error[/C][/ROW]
[ROW][C]1[/C][C]269285[/C][C]278912.091690775[/C][C]-9627.09169077527[/C][/ROW]
[ROW][C]2[/C][C]269829[/C][C]279708.446882032[/C][C]-9879.44688203148[/C][/ROW]
[ROW][C]3[/C][C]270911[/C][C]281699.334860174[/C][C]-10788.3348601736[/C][/ROW]
[ROW][C]4[/C][C]266844[/C][C]284486.578029572[/C][C]-17642.5780295725[/C][/ROW]
[ROW][C]5[/C][C]271244[/C][C]285681.110816458[/C][C]-14437.1108164577[/C][/ROW]
[ROW][C]6[/C][C]269907[/C][C]285282.933220829[/C][C]-15375.9332208293[/C][/ROW]
[ROW][C]7[/C][C]271296[/C][C]281301.157264545[/C][C]-10005.1572645451[/C][/ROW]
[ROW][C]8[/C][C]270157[/C][C]279708.446882032[/C][C]-9551.44688203148[/C][/ROW]
[ROW][C]9[/C][C]271322[/C][C]279310.269286403[/C][C]-7988.26928640307[/C][/ROW]
[ROW][C]10[/C][C]267179[/C][C]280902.979668917[/C][C]-13723.9796689167[/C][/ROW]
[ROW][C]11[/C][C]264101[/C][C]281699.334860174[/C][C]-17598.3348601736[/C][/ROW]
[ROW][C]12[/C][C]265518[/C][C]281301.157264545[/C][C]-15783.1572645451[/C][/ROW]
[ROW][C]13[/C][C]269419[/C][C]280504.802073288[/C][C]-11085.8020732883[/C][/ROW]
[ROW][C]14[/C][C]268714[/C][C]280504.802073288[/C][C]-11790.8020732883[/C][/ROW]
[ROW][C]15[/C][C]272482[/C][C]280504.802073288[/C][C]-8022.80207328832[/C][/ROW]
[ROW][C]16[/C][C]268351[/C][C]281699.334860174[/C][C]-13348.3348601736[/C][/ROW]
[ROW][C]17[/C][C]268175[/C][C]281699.334860174[/C][C]-13524.3348601736[/C][/ROW]
[ROW][C]18[/C][C]270674[/C][C]283292.045242687[/C][C]-12618.0452426872[/C][/ROW]
[ROW][C]19[/C][C]272764[/C][C]281699.334860174[/C][C]-8935.33486017357[/C][/ROW]
[ROW][C]20[/C][C]272599[/C][C]281699.334860174[/C][C]-9100.33486017357[/C][/ROW]
[ROW][C]21[/C][C]270333[/C][C]281301.157264545[/C][C]-10968.1572645451[/C][/ROW]
[ROW][C]22[/C][C]270846[/C][C]280902.979668917[/C][C]-10056.9796689167[/C][/ROW]
[ROW][C]23[/C][C]270491[/C][C]280902.979668917[/C][C]-10411.9796689167[/C][/ROW]
[ROW][C]24[/C][C]269160[/C][C]280106.62447766[/C][C]-10946.6244776599[/C][/ROW]
[ROW][C]25[/C][C]274027[/C][C]279310.269286403[/C][C]-5283.26928640307[/C][/ROW]
[ROW][C]26[/C][C]273784[/C][C]278912.091690775[/C][C]-5128.09169077465[/C][/ROW]
[ROW][C]27[/C][C]276663[/C][C]278912.091690775[/C][C]-2249.09169077465[/C][/ROW]
[ROW][C]28[/C][C]274525[/C][C]278912.091690775[/C][C]-4387.09169077465[/C][/ROW]
[ROW][C]29[/C][C]271344[/C][C]280106.62447766[/C][C]-8762.6244776599[/C][/ROW]
[ROW][C]30[/C][C]271115[/C][C]282495.690051430[/C][C]-11380.6900514304[/C][/ROW]
[ROW][C]31[/C][C]270798[/C][C]284088.400433944[/C][C]-13290.4004339441[/C][/ROW]
[ROW][C]32[/C][C]273911[/C][C]285282.933220829[/C][C]-11371.9332208293[/C][/ROW]
[ROW][C]33[/C][C]273985[/C][C]284884.755625201[/C][C]-10899.7556252009[/C][/ROW]
[ROW][C]34[/C][C]271917[/C][C]284088.400433944[/C][C]-12171.4004339441[/C][/ROW]
[ROW][C]35[/C][C]273338[/C][C]283690.222838316[/C][C]-10352.2228383156[/C][/ROW]
[ROW][C]36[/C][C]270601[/C][C]283292.045242687[/C][C]-12691.0452426872[/C][/ROW]
[ROW][C]37[/C][C]273547[/C][C]282893.867647059[/C][C]-9346.86764705881[/C][/ROW]
[ROW][C]38[/C][C]275363[/C][C]283292.045242687[/C][C]-7929.04524268723[/C][/ROW]
[ROW][C]39[/C][C]281229[/C][C]284088.400433944[/C][C]-2859.40043394406[/C][/ROW]
[ROW][C]40[/C][C]277793[/C][C]283690.222838316[/C][C]-5897.22283831565[/C][/ROW]
[ROW][C]41[/C][C]279913[/C][C]284486.578029572[/C][C]-4573.57802957248[/C][/ROW]
[ROW][C]42[/C][C]282500[/C][C]286079.288412086[/C][C]-3579.28841208614[/C][/ROW]
[ROW][C]43[/C][C]280041[/C][C]284884.755625201[/C][C]-4843.7556252009[/C][/ROW]
[ROW][C]44[/C][C]282166[/C][C]285282.933220829[/C][C]-3116.93322082931[/C][/ROW]
[ROW][C]45[/C][C]290304[/C][C]286079.288412086[/C][C]4224.71158791386[/C][/ROW]
[ROW][C]46[/C][C]283519[/C][C]286477.466007715[/C][C]-2958.46600771456[/C][/ROW]
[ROW][C]47[/C][C]287816[/C][C]286875.643603343[/C][C]940.356396657022[/C][/ROW]
[ROW][C]48[/C][C]285226[/C][C]285681.110816458[/C][C]-455.110816457729[/C][/ROW]
[ROW][C]49[/C][C]287595[/C][C]284486.578029572[/C][C]3108.42197042752[/C][/ROW]
[ROW][C]50[/C][C]289741[/C][C]284486.578029572[/C][C]5254.42197042752[/C][/ROW]
[ROW][C]51[/C][C]289148[/C][C]286079.288412086[/C][C]3068.71158791386[/C][/ROW]
[ROW][C]52[/C][C]288301[/C][C]287273.821198971[/C][C]1027.17880102860[/C][/ROW]
[ROW][C]53[/C][C]290155[/C][C]288468.353985857[/C][C]1686.64601414335[/C][/ROW]
[ROW][C]54[/C][C]289648[/C][C]287273.821198971[/C][C]2374.1788010286[/C][/ROW]
[ROW][C]55[/C][C]288225[/C][C]282893.867647059[/C][C]5331.13235294119[/C][/ROW]
[ROW][C]56[/C][C]289351[/C][C]282495.690051430[/C][C]6855.3099485696[/C][/ROW]
[ROW][C]57[/C][C]294735[/C][C]284088.400433944[/C][C]10646.5995660559[/C][/ROW]
[ROW][C]58[/C][C]305333[/C][C]287273.821198971[/C][C]18059.1788010286[/C][/ROW]
[ROW][C]59[/C][C]309030[/C][C]288468.353985857[/C][C]20561.6460141434[/C][/ROW]
[ROW][C]60[/C][C]310215[/C][C]286875.643603343[/C][C]23339.3563966570[/C][/ROW]
[ROW][C]61[/C][C]321935[/C][C]283292.045242687[/C][C]38642.9547573128[/C][/ROW]
[ROW][C]62[/C][C]325734[/C][C]280902.979668917[/C][C]44831.0203310833[/C][/ROW]
[ROW][C]63[/C][C]320846[/C][C]280106.62447766[/C][C]40739.3755223401[/C][/ROW]
[ROW][C]64[/C][C]323023[/C][C]280902.979668917[/C][C]42120.0203310833[/C][/ROW]
[ROW][C]65[/C][C]319753[/C][C]282097.512455802[/C][C]37655.487544198[/C][/ROW]
[ROW][C]66[/C][C]321753[/C][C]281699.334860174[/C][C]40053.6651398264[/C][/ROW]
[ROW][C]67[/C][C]320757[/C][C]279708.446882032[/C][C]41048.5531179685[/C][/ROW]
[ROW][C]68[/C][C]324479[/C][C]279310.269286403[/C][C]45168.7307135969[/C][/ROW]
[/TABLE]
Source: https://freestatistics.org/blog/index.php?pk=58532&T=4

Globally Unique Identifier (entire table): ba.freestatistics.org/blog/index.php?pk=58532&T=4

As an alternative you can also use a QR Code:  

The GUIDs for individual cells are displayed in the table below:

Multiple Linear Regression - Actuals, Interpolation, and Residuals
Time or IndexActualsInterpolationForecastResidualsPrediction Error
1269285278912.091690775-9627.09169077527
2269829279708.446882032-9879.44688203148
3270911281699.334860174-10788.3348601736
4266844284486.578029572-17642.5780295725
5271244285681.110816458-14437.1108164577
6269907285282.933220829-15375.9332208293
7271296281301.157264545-10005.1572645451
8270157279708.446882032-9551.44688203148
9271322279310.269286403-7988.26928640307
10267179280902.979668917-13723.9796689167
11264101281699.334860174-17598.3348601736
12265518281301.157264545-15783.1572645451
13269419280504.802073288-11085.8020732883
14268714280504.802073288-11790.8020732883
15272482280504.802073288-8022.80207328832
16268351281699.334860174-13348.3348601736
17268175281699.334860174-13524.3348601736
18270674283292.045242687-12618.0452426872
19272764281699.334860174-8935.33486017357
20272599281699.334860174-9100.33486017357
21270333281301.157264545-10968.1572645451
22270846280902.979668917-10056.9796689167
23270491280902.979668917-10411.9796689167
24269160280106.62447766-10946.6244776599
25274027279310.269286403-5283.26928640307
26273784278912.091690775-5128.09169077465
27276663278912.091690775-2249.09169077465
28274525278912.091690775-4387.09169077465
29271344280106.62447766-8762.6244776599
30271115282495.690051430-11380.6900514304
31270798284088.400433944-13290.4004339441
32273911285282.933220829-11371.9332208293
33273985284884.755625201-10899.7556252009
34271917284088.400433944-12171.4004339441
35273338283690.222838316-10352.2228383156
36270601283292.045242687-12691.0452426872
37273547282893.867647059-9346.86764705881
38275363283292.045242687-7929.04524268723
39281229284088.400433944-2859.40043394406
40277793283690.222838316-5897.22283831565
41279913284486.578029572-4573.57802957248
42282500286079.288412086-3579.28841208614
43280041284884.755625201-4843.7556252009
44282166285282.933220829-3116.93322082931
45290304286079.2884120864224.71158791386
46283519286477.466007715-2958.46600771456
47287816286875.643603343940.356396657022
48285226285681.110816458-455.110816457729
49287595284486.5780295723108.42197042752
50289741284486.5780295725254.42197042752
51289148286079.2884120863068.71158791386
52288301287273.8211989711027.17880102860
53290155288468.3539858571686.64601414335
54289648287273.8211989712374.1788010286
55288225282893.8676470595331.13235294119
56289351282495.6900514306855.3099485696
57294735284088.40043394410646.5995660559
58305333287273.82119897118059.1788010286
59309030288468.35398585720561.6460141434
60310215286875.64360334323339.3563966570
61321935283292.04524268738642.9547573128
62325734280902.97966891744831.0203310833
63320846280106.6244776640739.3755223401
64323023280902.97966891742120.0203310833
65319753282097.51245580237655.487544198
66321753281699.33486017440053.6651398264
67320757279708.44688203241048.5531179685
68324479279310.26928640345168.7307135969


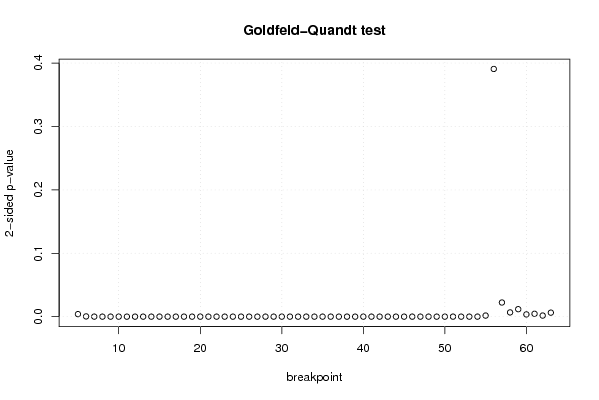
Goldfeld-Quandt test for Heteroskedasticity
p-valuesAlternative Hypothesis
breakpoint indexgreater2-sidedless
50.00200584872692810.00401169745385620.997994151273072
60.0001901581565469500.0003803163130938990.999809841843453
72.40151084270120e-054.80302168540239e-050.999975984891573
82.01599156761962e-064.03198313523925e-060.999997984008432
92.07716965778153e-074.15433931556306e-070.999999792283034
108.36675606699323e-081.67335121339865e-070.99999991633244
112.90416468428217e-075.80832936856435e-070.999999709583532
121.16086187489854e-072.32172374979708e-070.999999883913812
131.65156872502482e-083.30313745004964e-080.999999983484313
142.29259196724410e-094.58518393448820e-090.999999997707408
157.85498430792042e-101.57099686158408e-090.999999999214502
161.19213602012867e-102.38427204025734e-100.999999999880786
171.84268032240312e-113.68536064480624e-110.999999999981573
183.28480449430806e-126.56960898861613e-120.999999999996715
191.37275567845065e-122.74551135690130e-120.999999999998627
204.6274258030726e-139.2548516061452e-130.999999999999537
217.44665881053109e-141.48933176210622e-130.999999999999926
221.30489044567176e-142.60978089134353e-140.999999999999987
232.19793466628213e-154.39586933256425e-150.999999999999998
243.97641717920781e-167.95283435841563e-161
253.21939586256910e-166.43879172513821e-161
261.73058940387907e-163.46117880775814e-161
275.05857902088659e-161.01171580417732e-151
283.32244128979549e-166.64488257959098e-161
291.60675717780487e-163.21351435560974e-161
307.14070191491346e-171.42814038298269e-161
312.85025700691607e-175.70051401383214e-171
323.63350958092215e-177.2670191618443e-171
333.10732990803252e-176.21465981606503e-171
341.56649510135539e-173.13299020271078e-171
351.34404610214585e-172.68809220429171e-171
361.43247123692562e-172.86494247385124e-171
373.41850188700562e-176.83700377401124e-171
381.84743284355229e-163.69486568710459e-161
392.28638158201404e-144.57276316402808e-140.999999999999977
402.12038543749753e-134.24077087499505e-130.999999999999788
412.31853880557266e-124.63707761114533e-120.999999999997681
421.42616669644684e-112.85233339289369e-110.999999999985738
436.67973670179142e-111.33594734035828e-100.999999999933203
443.43503798950823e-106.87007597901645e-100.999999999656496
459.54479023843408e-091.90895804768682e-080.99999999045521
461.20432240071567e-082.40864480143134e-080.999999987956776
472.02752176780964e-084.05504353561929e-080.999999979724782
484.58274016737668e-089.16548033475336e-080.999999954172598
493.87487338080827e-077.74974676161653e-070.999999612512662
503.46052429744490e-066.92104859488981e-060.999996539475703
516.92324455975777e-061.38464891195155e-050.99999307675544
527.11212649500533e-061.42242529900107e-050.999992887873505
534.631222671657e-069.262445343314e-060.999995368777328
546.82453739931599e-061.36490747986320e-050.9999931754626
550.0008505549186363850.001701109837272770.999149445081364
560.1953929742562810.3907859485125620.80460702574372
570.9888490410970860.02230191780582760.0111509589029138
580.9966571808690810.006685638261837420.00334281913091871
590.994117884589310.01176423082137890.00588211541068947
600.9982219252111460.003556149577707750.00177807478885388
610.9977329136598550.004534172680289510.00226708634014476
620.999138200355620.001723599288761140.000861799644380572
630.9968336575014180.006332684997163410.00316634249858170

\begin{tabular}{lllllllll}
\hline
Goldfeld-Quandt test for Heteroskedasticity \tabularnewline
p-values & Alternative Hypothesis \tabularnewline
breakpoint index & greater & 2-sided & less \tabularnewline
5 & 0.0020058487269281 & 0.0040116974538562 & 0.997994151273072 \tabularnewline
6 & 0.000190158156546950 & 0.000380316313093899 & 0.999809841843453 \tabularnewline
7 & 2.40151084270120e-05 & 4.80302168540239e-05 & 0.999975984891573 \tabularnewline
8 & 2.01599156761962e-06 & 4.03198313523925e-06 & 0.999997984008432 \tabularnewline
9 & 2.07716965778153e-07 & 4.15433931556306e-07 & 0.999999792283034 \tabularnewline
10 & 8.36675606699323e-08 & 1.67335121339865e-07 & 0.99999991633244 \tabularnewline
11 & 2.90416468428217e-07 & 5.80832936856435e-07 & 0.999999709583532 \tabularnewline
12 & 1.16086187489854e-07 & 2.32172374979708e-07 & 0.999999883913812 \tabularnewline
13 & 1.65156872502482e-08 & 3.30313745004964e-08 & 0.999999983484313 \tabularnewline
14 & 2.29259196724410e-09 & 4.58518393448820e-09 & 0.999999997707408 \tabularnewline
15 & 7.85498430792042e-10 & 1.57099686158408e-09 & 0.999999999214502 \tabularnewline
16 & 1.19213602012867e-10 & 2.38427204025734e-10 & 0.999999999880786 \tabularnewline
17 & 1.84268032240312e-11 & 3.68536064480624e-11 & 0.999999999981573 \tabularnewline
18 & 3.28480449430806e-12 & 6.56960898861613e-12 & 0.999999999996715 \tabularnewline
19 & 1.37275567845065e-12 & 2.74551135690130e-12 & 0.999999999998627 \tabularnewline
20 & 4.6274258030726e-13 & 9.2548516061452e-13 & 0.999999999999537 \tabularnewline
21 & 7.44665881053109e-14 & 1.48933176210622e-13 & 0.999999999999926 \tabularnewline
22 & 1.30489044567176e-14 & 2.60978089134353e-14 & 0.999999999999987 \tabularnewline
23 & 2.19793466628213e-15 & 4.39586933256425e-15 & 0.999999999999998 \tabularnewline
24 & 3.97641717920781e-16 & 7.95283435841563e-16 & 1 \tabularnewline
25 & 3.21939586256910e-16 & 6.43879172513821e-16 & 1 \tabularnewline
26 & 1.73058940387907e-16 & 3.46117880775814e-16 & 1 \tabularnewline
27 & 5.05857902088659e-16 & 1.01171580417732e-15 & 1 \tabularnewline
28 & 3.32244128979549e-16 & 6.64488257959098e-16 & 1 \tabularnewline
29 & 1.60675717780487e-16 & 3.21351435560974e-16 & 1 \tabularnewline
30 & 7.14070191491346e-17 & 1.42814038298269e-16 & 1 \tabularnewline
31 & 2.85025700691607e-17 & 5.70051401383214e-17 & 1 \tabularnewline
32 & 3.63350958092215e-17 & 7.2670191618443e-17 & 1 \tabularnewline
33 & 3.10732990803252e-17 & 6.21465981606503e-17 & 1 \tabularnewline
34 & 1.56649510135539e-17 & 3.13299020271078e-17 & 1 \tabularnewline
35 & 1.34404610214585e-17 & 2.68809220429171e-17 & 1 \tabularnewline
36 & 1.43247123692562e-17 & 2.86494247385124e-17 & 1 \tabularnewline
37 & 3.41850188700562e-17 & 6.83700377401124e-17 & 1 \tabularnewline
38 & 1.84743284355229e-16 & 3.69486568710459e-16 & 1 \tabularnewline
39 & 2.28638158201404e-14 & 4.57276316402808e-14 & 0.999999999999977 \tabularnewline
40 & 2.12038543749753e-13 & 4.24077087499505e-13 & 0.999999999999788 \tabularnewline
41 & 2.31853880557266e-12 & 4.63707761114533e-12 & 0.999999999997681 \tabularnewline
42 & 1.42616669644684e-11 & 2.85233339289369e-11 & 0.999999999985738 \tabularnewline
43 & 6.67973670179142e-11 & 1.33594734035828e-10 & 0.999999999933203 \tabularnewline
44 & 3.43503798950823e-10 & 6.87007597901645e-10 & 0.999999999656496 \tabularnewline
45 & 9.54479023843408e-09 & 1.90895804768682e-08 & 0.99999999045521 \tabularnewline
46 & 1.20432240071567e-08 & 2.40864480143134e-08 & 0.999999987956776 \tabularnewline
47 & 2.02752176780964e-08 & 4.05504353561929e-08 & 0.999999979724782 \tabularnewline
48 & 4.58274016737668e-08 & 9.16548033475336e-08 & 0.999999954172598 \tabularnewline
49 & 3.87487338080827e-07 & 7.74974676161653e-07 & 0.999999612512662 \tabularnewline
50 & 3.46052429744490e-06 & 6.92104859488981e-06 & 0.999996539475703 \tabularnewline
51 & 6.92324455975777e-06 & 1.38464891195155e-05 & 0.99999307675544 \tabularnewline
52 & 7.11212649500533e-06 & 1.42242529900107e-05 & 0.999992887873505 \tabularnewline
53 & 4.631222671657e-06 & 9.262445343314e-06 & 0.999995368777328 \tabularnewline
54 & 6.82453739931599e-06 & 1.36490747986320e-05 & 0.9999931754626 \tabularnewline
55 & 0.000850554918636385 & 0.00170110983727277 & 0.999149445081364 \tabularnewline
56 & 0.195392974256281 & 0.390785948512562 & 0.80460702574372 \tabularnewline
57 & 0.988849041097086 & 0.0223019178058276 & 0.0111509589029138 \tabularnewline
58 & 0.996657180869081 & 0.00668563826183742 & 0.00334281913091871 \tabularnewline
59 & 0.99411788458931 & 0.0117642308213789 & 0.00588211541068947 \tabularnewline
60 & 0.998221925211146 & 0.00355614957770775 & 0.00177807478885388 \tabularnewline
61 & 0.997732913659855 & 0.00453417268028951 & 0.00226708634014476 \tabularnewline
62 & 0.99913820035562 & 0.00172359928876114 & 0.000861799644380572 \tabularnewline
63 & 0.996833657501418 & 0.00633268499716341 & 0.00316634249858170 \tabularnewline
\hline
\end{tabular}
%Source: https://freestatistics.org/blog/index.php?pk=58532&T=5

[TABLE]
[ROW][C]Goldfeld-Quandt test for Heteroskedasticity[/C][/ROW]
[ROW][C]p-values[/C][C]Alternative Hypothesis[/C][/ROW]
[ROW][C]breakpoint index[/C][C]greater[/C][C]2-sided[/C][C]less[/C][/ROW]
[ROW][C]5[/C][C]0.0020058487269281[/C][C]0.0040116974538562[/C][C]0.997994151273072[/C][/ROW]
[ROW][C]6[/C][C]0.000190158156546950[/C][C]0.000380316313093899[/C][C]0.999809841843453[/C][/ROW]
[ROW][C]7[/C][C]2.40151084270120e-05[/C][C]4.80302168540239e-05[/C][C]0.999975984891573[/C][/ROW]
[ROW][C]8[/C][C]2.01599156761962e-06[/C][C]4.03198313523925e-06[/C][C]0.999997984008432[/C][/ROW]
[ROW][C]9[/C][C]2.07716965778153e-07[/C][C]4.15433931556306e-07[/C][C]0.999999792283034[/C][/ROW]
[ROW][C]10[/C][C]8.36675606699323e-08[/C][C]1.67335121339865e-07[/C][C]0.99999991633244[/C][/ROW]
[ROW][C]11[/C][C]2.90416468428217e-07[/C][C]5.80832936856435e-07[/C][C]0.999999709583532[/C][/ROW]
[ROW][C]12[/C][C]1.16086187489854e-07[/C][C]2.32172374979708e-07[/C][C]0.999999883913812[/C][/ROW]
[ROW][C]13[/C][C]1.65156872502482e-08[/C][C]3.30313745004964e-08[/C][C]0.999999983484313[/C][/ROW]
[ROW][C]14[/C][C]2.29259196724410e-09[/C][C]4.58518393448820e-09[/C][C]0.999999997707408[/C][/ROW]
[ROW][C]15[/C][C]7.85498430792042e-10[/C][C]1.57099686158408e-09[/C][C]0.999999999214502[/C][/ROW]
[ROW][C]16[/C][C]1.19213602012867e-10[/C][C]2.38427204025734e-10[/C][C]0.999999999880786[/C][/ROW]
[ROW][C]17[/C][C]1.84268032240312e-11[/C][C]3.68536064480624e-11[/C][C]0.999999999981573[/C][/ROW]
[ROW][C]18[/C][C]3.28480449430806e-12[/C][C]6.56960898861613e-12[/C][C]0.999999999996715[/C][/ROW]
[ROW][C]19[/C][C]1.37275567845065e-12[/C][C]2.74551135690130e-12[/C][C]0.999999999998627[/C][/ROW]
[ROW][C]20[/C][C]4.6274258030726e-13[/C][C]9.2548516061452e-13[/C][C]0.999999999999537[/C][/ROW]
[ROW][C]21[/C][C]7.44665881053109e-14[/C][C]1.48933176210622e-13[/C][C]0.999999999999926[/C][/ROW]
[ROW][C]22[/C][C]1.30489044567176e-14[/C][C]2.60978089134353e-14[/C][C]0.999999999999987[/C][/ROW]
[ROW][C]23[/C][C]2.19793466628213e-15[/C][C]4.39586933256425e-15[/C][C]0.999999999999998[/C][/ROW]
[ROW][C]24[/C][C]3.97641717920781e-16[/C][C]7.95283435841563e-16[/C][C]1[/C][/ROW]
[ROW][C]25[/C][C]3.21939586256910e-16[/C][C]6.43879172513821e-16[/C][C]1[/C][/ROW]
[ROW][C]26[/C][C]1.73058940387907e-16[/C][C]3.46117880775814e-16[/C][C]1[/C][/ROW]
[ROW][C]27[/C][C]5.05857902088659e-16[/C][C]1.01171580417732e-15[/C][C]1[/C][/ROW]
[ROW][C]28[/C][C]3.32244128979549e-16[/C][C]6.64488257959098e-16[/C][C]1[/C][/ROW]
[ROW][C]29[/C][C]1.60675717780487e-16[/C][C]3.21351435560974e-16[/C][C]1[/C][/ROW]
[ROW][C]30[/C][C]7.14070191491346e-17[/C][C]1.42814038298269e-16[/C][C]1[/C][/ROW]
[ROW][C]31[/C][C]2.85025700691607e-17[/C][C]5.70051401383214e-17[/C][C]1[/C][/ROW]
[ROW][C]32[/C][C]3.63350958092215e-17[/C][C]7.2670191618443e-17[/C][C]1[/C][/ROW]
[ROW][C]33[/C][C]3.10732990803252e-17[/C][C]6.21465981606503e-17[/C][C]1[/C][/ROW]
[ROW][C]34[/C][C]1.56649510135539e-17[/C][C]3.13299020271078e-17[/C][C]1[/C][/ROW]
[ROW][C]35[/C][C]1.34404610214585e-17[/C][C]2.68809220429171e-17[/C][C]1[/C][/ROW]
[ROW][C]36[/C][C]1.43247123692562e-17[/C][C]2.86494247385124e-17[/C][C]1[/C][/ROW]
[ROW][C]37[/C][C]3.41850188700562e-17[/C][C]6.83700377401124e-17[/C][C]1[/C][/ROW]
[ROW][C]38[/C][C]1.84743284355229e-16[/C][C]3.69486568710459e-16[/C][C]1[/C][/ROW]
[ROW][C]39[/C][C]2.28638158201404e-14[/C][C]4.57276316402808e-14[/C][C]0.999999999999977[/C][/ROW]
[ROW][C]40[/C][C]2.12038543749753e-13[/C][C]4.24077087499505e-13[/C][C]0.999999999999788[/C][/ROW]
[ROW][C]41[/C][C]2.31853880557266e-12[/C][C]4.63707761114533e-12[/C][C]0.999999999997681[/C][/ROW]
[ROW][C]42[/C][C]1.42616669644684e-11[/C][C]2.85233339289369e-11[/C][C]0.999999999985738[/C][/ROW]
[ROW][C]43[/C][C]6.67973670179142e-11[/C][C]1.33594734035828e-10[/C][C]0.999999999933203[/C][/ROW]
[ROW][C]44[/C][C]3.43503798950823e-10[/C][C]6.87007597901645e-10[/C][C]0.999999999656496[/C][/ROW]
[ROW][C]45[/C][C]9.54479023843408e-09[/C][C]1.90895804768682e-08[/C][C]0.99999999045521[/C][/ROW]
[ROW][C]46[/C][C]1.20432240071567e-08[/C][C]2.40864480143134e-08[/C][C]0.999999987956776[/C][/ROW]
[ROW][C]47[/C][C]2.02752176780964e-08[/C][C]4.05504353561929e-08[/C][C]0.999999979724782[/C][/ROW]
[ROW][C]48[/C][C]4.58274016737668e-08[/C][C]9.16548033475336e-08[/C][C]0.999999954172598[/C][/ROW]
[ROW][C]49[/C][C]3.87487338080827e-07[/C][C]7.74974676161653e-07[/C][C]0.999999612512662[/C][/ROW]
[ROW][C]50[/C][C]3.46052429744490e-06[/C][C]6.92104859488981e-06[/C][C]0.999996539475703[/C][/ROW]
[ROW][C]51[/C][C]6.92324455975777e-06[/C][C]1.38464891195155e-05[/C][C]0.99999307675544[/C][/ROW]
[ROW][C]52[/C][C]7.11212649500533e-06[/C][C]1.42242529900107e-05[/C][C]0.999992887873505[/C][/ROW]
[ROW][C]53[/C][C]4.631222671657e-06[/C][C]9.262445343314e-06[/C][C]0.999995368777328[/C][/ROW]
[ROW][C]54[/C][C]6.82453739931599e-06[/C][C]1.36490747986320e-05[/C][C]0.9999931754626[/C][/ROW]
[ROW][C]55[/C][C]0.000850554918636385[/C][C]0.00170110983727277[/C][C]0.999149445081364[/C][/ROW]
[ROW][C]56[/C][C]0.195392974256281[/C][C]0.390785948512562[/C][C]0.80460702574372[/C][/ROW]
[ROW][C]57[/C][C]0.988849041097086[/C][C]0.0223019178058276[/C][C]0.0111509589029138[/C][/ROW]
[ROW][C]58[/C][C]0.996657180869081[/C][C]0.00668563826183742[/C][C]0.00334281913091871[/C][/ROW]
[ROW][C]59[/C][C]0.99411788458931[/C][C]0.0117642308213789[/C][C]0.00588211541068947[/C][/ROW]
[ROW][C]60[/C][C]0.998221925211146[/C][C]0.00355614957770775[/C][C]0.00177807478885388[/C][/ROW]
[ROW][C]61[/C][C]0.997732913659855[/C][C]0.00453417268028951[/C][C]0.00226708634014476[/C][/ROW]
[ROW][C]62[/C][C]0.99913820035562[/C][C]0.00172359928876114[/C][C]0.000861799644380572[/C][/ROW]
[ROW][C]63[/C][C]0.996833657501418[/C][C]0.00633268499716341[/C][C]0.00316634249858170[/C][/ROW]
[/TABLE]
Source: https://freestatistics.org/blog/index.php?pk=58532&T=5

Globally Unique Identifier (entire table): ba.freestatistics.org/blog/index.php?pk=58532&T=5

As an alternative you can also use a QR Code:  

The GUIDs for individual cells are displayed in the table below:

Goldfeld-Quandt test for Heteroskedasticity
p-valuesAlternative Hypothesis
breakpoint indexgreater2-sidedless
50.00200584872692810.00401169745385620.997994151273072
60.0001901581565469500.0003803163130938990.999809841843453
72.40151084270120e-054.80302168540239e-050.999975984891573
82.01599156761962e-064.03198313523925e-060.999997984008432
92.07716965778153e-074.15433931556306e-070.999999792283034
108.36675606699323e-081.67335121339865e-070.99999991633244
112.90416468428217e-075.80832936856435e-070.999999709583532
121.16086187489854e-072.32172374979708e-070.999999883913812
131.65156872502482e-083.30313745004964e-080.999999983484313
142.29259196724410e-094.58518393448820e-090.999999997707408
157.85498430792042e-101.57099686158408e-090.999999999214502
161.19213602012867e-102.38427204025734e-100.999999999880786
171.84268032240312e-113.68536064480624e-110.999999999981573
183.28480449430806e-126.56960898861613e-120.999999999996715
191.37275567845065e-122.74551135690130e-120.999999999998627
204.6274258030726e-139.2548516061452e-130.999999999999537
217.44665881053109e-141.48933176210622e-130.999999999999926
221.30489044567176e-142.60978089134353e-140.999999999999987
232.19793466628213e-154.39586933256425e-150.999999999999998
243.97641717920781e-167.95283435841563e-161
253.21939586256910e-166.43879172513821e-161
261.73058940387907e-163.46117880775814e-161
275.05857902088659e-161.01171580417732e-151
283.32244128979549e-166.64488257959098e-161
291.60675717780487e-163.21351435560974e-161
307.14070191491346e-171.42814038298269e-161
312.85025700691607e-175.70051401383214e-171
323.63350958092215e-177.2670191618443e-171
333.10732990803252e-176.21465981606503e-171
341.56649510135539e-173.13299020271078e-171
351.34404610214585e-172.68809220429171e-171
361.43247123692562e-172.86494247385124e-171
373.41850188700562e-176.83700377401124e-171
381.84743284355229e-163.69486568710459e-161
392.28638158201404e-144.57276316402808e-140.999999999999977
402.12038543749753e-134.24077087499505e-130.999999999999788
412.31853880557266e-124.63707761114533e-120.999999999997681
421.42616669644684e-112.85233339289369e-110.999999999985738
436.67973670179142e-111.33594734035828e-100.999999999933203
443.43503798950823e-106.87007597901645e-100.999999999656496
459.54479023843408e-091.90895804768682e-080.99999999045521
461.20432240071567e-082.40864480143134e-080.999999987956776
472.02752176780964e-084.05504353561929e-080.999999979724782
484.58274016737668e-089.16548033475336e-080.999999954172598
493.87487338080827e-077.74974676161653e-070.999999612512662
503.46052429744490e-066.92104859488981e-060.999996539475703
516.92324455975777e-061.38464891195155e-050.99999307675544
527.11212649500533e-061.42242529900107e-050.999992887873505
534.631222671657e-069.262445343314e-060.999995368777328
546.82453739931599e-061.36490747986320e-050.9999931754626
550.0008505549186363850.001701109837272770.999149445081364
560.1953929742562810.3907859485125620.80460702574372
570.9888490410970860.02230191780582760.0111509589029138
580.9966571808690810.006685638261837420.00334281913091871
590.994117884589310.01176423082137890.00588211541068947
600.9982219252111460.003556149577707750.00177807478885388
610.9977329136598550.004534172680289510.00226708634014476
620.999138200355620.001723599288761140.000861799644380572
630.9968336575014180.006332684997163410.00316634249858170


Meta Analysis of Goldfeld-Quandt test for Heteroskedasticity
Description# significant tests% significant testsOK/NOK
1% type I error level560.949152542372881NOK
5% type I error level580.983050847457627NOK
10% type I error level580.983050847457627NOK

\begin{tabular}{lllllllll}
\hline
Meta Analysis of Goldfeld-Quandt test for Heteroskedasticity \tabularnewline
Description & # significant tests & % significant tests & OK/NOK \tabularnewline
1% type I error level & 56 & 0.949152542372881 & NOK \tabularnewline
5% type I error level & 58 & 0.983050847457627 & NOK \tabularnewline
10% type I error level & 58 & 0.983050847457627 & NOK \tabularnewline
\hline
\end{tabular}
%Source: https://freestatistics.org/blog/index.php?pk=58532&T=6

[TABLE]
[ROW][C]Meta Analysis of Goldfeld-Quandt test for Heteroskedasticity[/C][/ROW]
[ROW][C]Description[/C][C]# significant tests[/C][C]% significant tests[/C][C]OK/NOK[/C][/ROW]
[ROW][C]1% type I error level[/C][C]56[/C][C]0.949152542372881[/C][C]NOK[/C][/ROW]
[ROW][C]5% type I error level[/C][C]58[/C][C]0.983050847457627[/C][C]NOK[/C][/ROW]
[ROW][C]10% type I error level[/C][C]58[/C][C]0.983050847457627[/C][C]NOK[/C][/ROW]
[/TABLE]
Source: https://freestatistics.org/blog/index.php?pk=58532&T=6

Globally Unique Identifier (entire table): ba.freestatistics.org/blog/index.php?pk=58532&T=6

As an alternative you can also use a QR Code:  

The GUIDs for individual cells are displayed in the table below:

Meta Analysis of Goldfeld-Quandt test for Heteroskedasticity
Description# significant tests% significant testsOK/NOK
1% type I error level560.949152542372881NOK
5% type I error level580.983050847457627NOK
10% type I error level580.983050847457627NOK


Parameters (Session):
par1 = 1 ; par2 = Do not include Seasonal Dummies ; par3 = No Linear Trend ;
Parameters (R input):
par1 = 1 ; par2 = Do not include Seasonal Dummies ; par3 = No Linear Trend ;
R code (references can be found in the software module):
library(lattice)
library(lmtest)
n25 <- 25 #minimum number of obs. for Goldfeld-Quandt test
par1 <- as.numeric(par1)
x <- t(y)
k <- length(x[1,])
n <- length(x[,1])
x1 <- cbind(x[,par1], x[,1:k!=par1])
mycolnames <- c(colnames(x)[par1], colnames(x)[1:k!=par1])
colnames(x1) <- mycolnames #colnames(x)[par1]
x <- x1
if (par3 == 'First Differences'){
x2 <- array(0, dim=c(n-1,k), dimnames=list(1:(n-1), paste('(1-B)',colnames(x),sep='')))
for (i in 1:n-1) {
for (j in 1:k) {
x2[i,j] <- x[i+1,j] - x[i,j]
}
}
x <- x2
}
if (par2 == 'Include Monthly Dummies'){
x2 <- array(0, dim=c(n,11), dimnames=list(1:n, paste('M', seq(1:11), sep ='')))
for (i in 1:11){
x2[seq(i,n,12),i] <- 1
}
x <- cbind(x, x2)
}
if (par2 == 'Include Quarterly Dummies'){
x2 <- array(0, dim=c(n,3), dimnames=list(1:n, paste('Q', seq(1:3), sep ='')))
for (i in 1:3){
x2[seq(i,n,4),i] <- 1
}
x <- cbind(x, x2)
}
k <- length(x[1,])
if (par3 == 'Linear Trend'){
x <- cbind(x, c(1:n))
colnames(x)[k+1] <- 't'
}
x
k <- length(x[1,])
df <- as.data.frame(x)
(mylm <- lm(df))
(mysum <- summary(mylm))
if (n > n25) {
kp3 <- k + 3
nmkm3 <- n - k - 3
gqarr <- array(NA, dim=c(nmkm3-kp3+1,3))
numgqtests <- 0
numsignificant1 <- 0
numsignificant5 <- 0
numsignificant10 <- 0
for (mypoint in kp3:nmkm3) {
j <- 0
numgqtests <- numgqtests + 1
for (myalt in c('greater', 'two.sided', 'less')) {
j <- j + 1
gqarr[mypoint-kp3+1,j] <- gqtest(mylm, point=mypoint, alternative=myalt)$p.value
}
if (gqarr[mypoint-kp3+1,2] < 0.01) numsignificant1 <- numsignificant1 + 1
if (gqarr[mypoint-kp3+1,2] < 0.05) numsignificant5 <- numsignificant5 + 1
if (gqarr[mypoint-kp3+1,2] < 0.10) numsignificant10 <- numsignificant10 + 1
}
gqarr
}
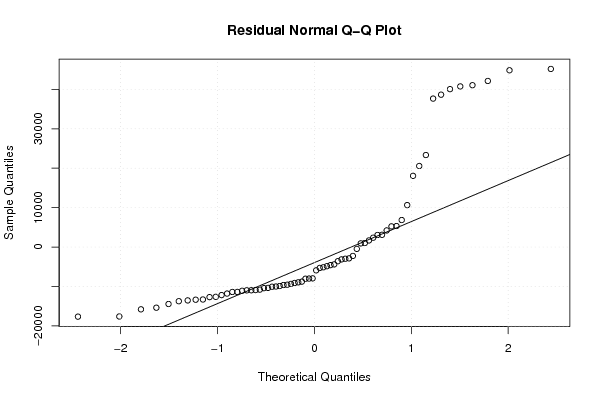
bitmap(file='test0.png')
plot(x[,1], type='l', main='Actuals and Interpolation', ylab='value of Actuals and Interpolation (dots)', xlab='time or index')
points(x[,1]-mysum$resid)
grid()
dev.off()
bitmap(file='test1.png')
plot(mysum$resid, type='b', pch=19, main='Residuals', ylab='value of Residuals', xlab='time or index')
grid()
dev.off()
bitmap(file='test2.png')
hist(mysum$resid, main='Residual Histogram', xlab='values of Residuals')
grid()
dev.off()
bitmap(file='test3.png')
densityplot(~mysum$resid,col='black',main='Residual Density Plot', xlab='values of Residuals')
dev.off()
bitmap(file='test4.png')
qqnorm(mysum$resid, main='Residual Normal Q-Q Plot')
qqline(mysum$resid)
grid()
dev.off()
(myerror <- as.ts(mysum$resid))
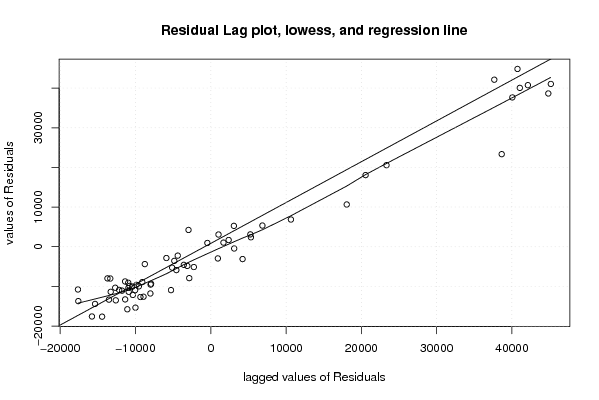
bitmap(file='test5.png')
dum <- cbind(lag(myerror,k=1),myerror)
dum
dum1 <- dum[2:length(myerror),]
dum1
z <- as.data.frame(dum1)
z
plot(z,main=paste('Residual Lag plot, lowess, and regression line'), ylab='values of Residuals', xlab='lagged values of Residuals')
lines(lowess(z))
abline(lm(z))
grid()
dev.off()
bitmap(file='test6.png')
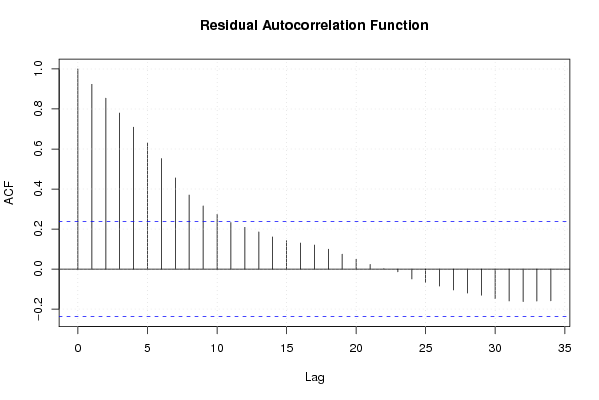
acf(mysum$resid, lag.max=length(mysum$resid)/2, main='Residual Autocorrelation Function')
grid()
dev.off()
bitmap(file='test7.png')
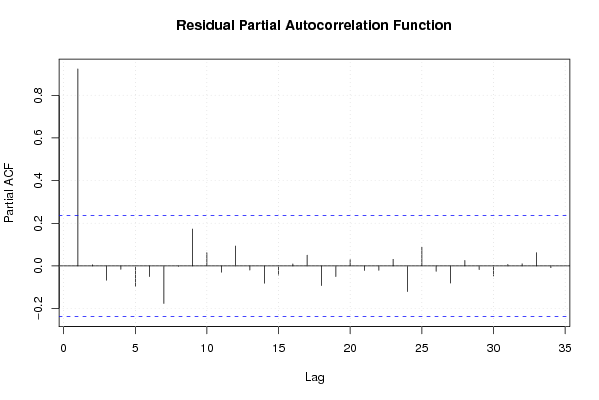
pacf(mysum$resid, lag.max=length(mysum$resid)/2, main='Residual Partial Autocorrelation Function')
grid()
dev.off()
bitmap(file='test8.png')
opar <- par(mfrow = c(2,2), oma = c(0, 0, 1.1, 0))
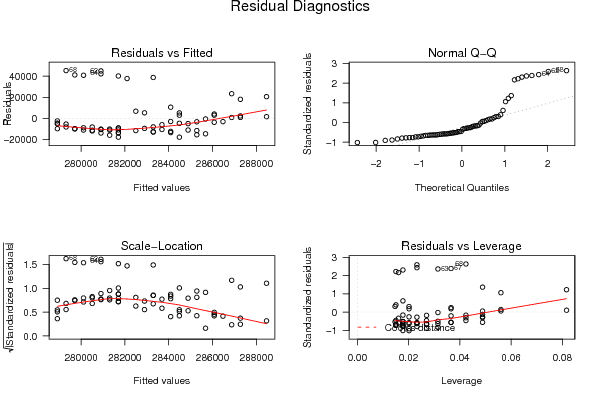
plot(mylm, las = 1, sub='Residual Diagnostics')
par(opar)
dev.off()
if (n > n25) {
bitmap(file='test9.png')
plot(kp3:nmkm3,gqarr[,2], main='Goldfeld-Quandt test',ylab='2-sided p-value',xlab='breakpoint')
grid()
dev.off()
}
load(file='createtable')
a<-table.start()
a<-table.row.start(a)
a<-table.element(a, 'Multiple Linear Regression - Estimated Regression Equation', 1, TRUE)
a<-table.row.end(a)
myeq <- colnames(x)[1]
myeq <- paste(myeq, '[t] = ', sep='')
for (i in 1:k){
if (mysum$coefficients[i,1] > 0) myeq <- paste(myeq, '+', '')
myeq <- paste(myeq, mysum$coefficients[i,1], sep=' ')
if (rownames(mysum$coefficients)[i] != '(Intercept)') {
myeq <- paste(myeq, rownames(mysum$coefficients)[i], sep='')
if (rownames(mysum$coefficients)[i] != 't') myeq <- paste(myeq, '[t]', sep='')
}
}
myeq <- paste(myeq, ' + e[t]')
a<-table.row.start(a)
a<-table.element(a, myeq)
a<-table.row.end(a)
a<-table.end(a)
table.save(a,file='mytable1.tab')
a<-table.start()
a<-table.row.start(a)
a<-table.element(a,hyperlink('ols1.htm','Multiple Linear Regression - Ordinary Least Squares',''), 6, TRUE)
a<-table.row.end(a)
a<-table.row.start(a)
a<-table.element(a,'Variable',header=TRUE)
a<-table.element(a,'Parameter',header=TRUE)
a<-table.element(a,'S.D.',header=TRUE)
a<-table.element(a,'T-STAT
H0: parameter = 0',header=TRUE)
a<-table.element(a,'2-tail p-value',header=TRUE)
a<-table.element(a,'1-tail p-value',header=TRUE)
a<-table.row.end(a)
for (i in 1:k){
a<-table.row.start(a)
a<-table.element(a,rownames(mysum$coefficients)[i],header=TRUE)
a<-table.element(a,mysum$coefficients[i,1])
a<-table.element(a, round(mysum$coefficients[i,2],6))
a<-table.element(a, round(mysum$coefficients[i,3],4))
a<-table.element(a, round(mysum$coefficients[i,4],6))
a<-table.element(a, round(mysum$coefficients[i,4]/2,6))
a<-table.row.end(a)
}
a<-table.end(a)
table.save(a,file='mytable2.tab')
a<-table.start()
a<-table.row.start(a)
a<-table.element(a, 'Multiple Linear Regression - Regression Statistics', 2, TRUE)
a<-table.row.end(a)
a<-table.row.start(a)
a<-table.element(a, 'Multiple R',1,TRUE)
a<-table.element(a, sqrt(mysum$r.squared))
a<-table.row.end(a)
a<-table.row.start(a)
a<-table.element(a, 'R-squared',1,TRUE)
a<-table.element(a, mysum$r.squared)
a<-table.row.end(a)
a<-table.row.start(a)
a<-table.element(a, 'Adjusted R-squared',1,TRUE)
a<-table.element(a, mysum$adj.r.squared)
a<-table.row.end(a)
a<-table.row.start(a)
a<-table.element(a, 'F-TEST (value)',1,TRUE)
a<-table.element(a, mysum$fstatistic[1])
a<-table.row.end(a)
a<-table.row.start(a)
a<-table.element(a, 'F-TEST (DF numerator)',1,TRUE)
a<-table.element(a, mysum$fstatistic[2])
a<-table.row.end(a)
a<-table.row.start(a)
a<-table.element(a, 'F-TEST (DF denominator)',1,TRUE)
a<-table.element(a, mysum$fstatistic[3])
a<-table.row.end(a)
a<-table.row.start(a)
a<-table.element(a, 'p-value',1,TRUE)
a<-table.element(a, 1-pf(mysum$fstatistic[1],mysum$fstatistic[2],mysum$fstatistic[3]))
a<-table.row.end(a)
a<-table.row.start(a)
a<-table.element(a, 'Multiple Linear Regression - Residual Statistics', 2, TRUE)
a<-table.row.end(a)
a<-table.row.start(a)
a<-table.element(a, 'Residual Standard Deviation',1,TRUE)
a<-table.element(a, mysum$sigma)
a<-table.row.end(a)
a<-table.row.start(a)
a<-table.element(a, 'Sum Squared Residuals',1,TRUE)
a<-table.element(a, sum(myerror*myerror))
a<-table.row.end(a)
a<-table.end(a)
table.save(a,file='mytable3.tab')
a<-table.start()
a<-table.row.start(a)
a<-table.element(a, 'Multiple Linear Regression - Actuals, Interpolation, and Residuals', 4, TRUE)
a<-table.row.end(a)
a<-table.row.start(a)
a<-table.element(a, 'Time or Index', 1, TRUE)
a<-table.element(a, 'Actuals', 1, TRUE)
a<-table.element(a, 'Interpolation
Forecast', 1, TRUE)
a<-table.element(a, 'Residuals
Prediction Error', 1, TRUE)
a<-table.row.end(a)
for (i in 1:n) {
a<-table.row.start(a)
a<-table.element(a,i, 1, TRUE)
a<-table.element(a,x[i])
a<-table.element(a,x[i]-mysum$resid[i])
a<-table.element(a,mysum$resid[i])
a<-table.row.end(a)
}
a<-table.end(a)
table.save(a,file='mytable4.tab')
if (n > n25) {
a<-table.start()
a<-table.row.start(a)
a<-table.element(a,'Goldfeld-Quandt test for Heteroskedasticity',4,TRUE)
a<-table.row.end(a)
a<-table.row.start(a)
a<-table.element(a,'p-values',header=TRUE)
a<-table.element(a,'Alternative Hypothesis',3,header=TRUE)
a<-table.row.end(a)
a<-table.row.start(a)
a<-table.element(a,'breakpoint index',header=TRUE)
a<-table.element(a,'greater',header=TRUE)
a<-table.element(a,'2-sided',header=TRUE)
a<-table.element(a,'less',header=TRUE)
a<-table.row.end(a)
for (mypoint in kp3:nmkm3) {
a<-table.row.start(a)
a<-table.element(a,mypoint,header=TRUE)
a<-table.element(a,gqarr[mypoint-kp3+1,1])
a<-table.element(a,gqarr[mypoint-kp3+1,2])
a<-table.element(a,gqarr[mypoint-kp3+1,3])
a<-table.row.end(a)
}
a<-table.end(a)
table.save(a,file='mytable5.tab')
a<-table.start()
a<-table.row.start(a)
a<-table.element(a,'Meta Analysis of Goldfeld-Quandt test for Heteroskedasticity',4,TRUE)
a<-table.row.end(a)
a<-table.row.start(a)
a<-table.element(a,'Description',header=TRUE)
a<-table.element(a,'# significant tests',header=TRUE)
a<-table.element(a,'% significant tests',header=TRUE)
a<-table.element(a,'OK/NOK',header=TRUE)
a<-table.row.end(a)
a<-table.row.start(a)
a<-table.element(a,'1% type I error level',header=TRUE)
a<-table.element(a,numsignificant1)
a<-table.element(a,numsignificant1/numgqtests)
if (numsignificant1/numgqtests < 0.01) dum <- 'OK' else dum <- 'NOK'
a<-table.element(a,dum)
a<-table.row.end(a)
a<-table.row.start(a)
a<-table.element(a,'5% type I error level',header=TRUE)
a<-table.element(a,numsignificant5)
a<-table.element(a,numsignificant5/numgqtests)
if (numsignificant5/numgqtests < 0.05) dum <- 'OK' else dum <- 'NOK'
a<-table.element(a,dum)
a<-table.row.end(a)
a<-table.row.start(a)
a<-table.element(a,'10% type I error level',header=TRUE)
a<-table.element(a,numsignificant10)
a<-table.element(a,numsignificant10/numgqtests)
if (numsignificant10/numgqtests < 0.1) dum <- 'OK' else dum <- 'NOK'
a<-table.element(a,dum)
a<-table.row.end(a)
a<-table.end(a)
table.save(a,file='mytable6.tab')
}