Free Statistics

of Irreproducible Research!

Author's title

Author*The author of this computation has been verified*
R Software Modulerwasp_multipleregression.wasp
Title produced by softwareMultiple Regression
Date of computationSat, 21 Nov 2009 05:05:26 -0700
Cite this page as followsStatistical Computations at FreeStatistics.org, Office for Research Development and Education, URL https://freestatistics.org/blog/index.php?v=date/2009/Nov/21/t1258805326exq5u60xxrtbwaf.htm/, Retrieved Sun, 28 Apr 2024 05:04:45 +0000
Statistical Computations at FreeStatistics.org, Office for Research Development and Education, URL https://freestatistics.org/blog/index.php?pk=58533, Retrieved Sun, 28 Apr 2024 05:04:45 +0000
QR Codes:

Original text written by user:
IsPrivate?No (this computation is public)
User-defined keywords
Estimated Impact174
Family? (F = Feedback message, R = changed R code, M = changed R Module, P = changed Parameters, D = changed Data)
-     [Multiple Regression] [Q1 The Seatbeltlaw] [2007-11-14 19:27:43] [8cd6641b921d30ebe00b648d1481bba0]
- RMPD  [Multiple Regression] [Seatbelt] [2009-11-12 13:54:52] [b98453cac15ba1066b407e146608df68]
-   PD      [Multiple Regression] [WS7.2] [2009-11-21 12:05:26] [dd4f17965cad1d38de7a1c062d32d75d] [Current]
Feedback Forum

Post a new message
Dataseries X:
269285	8.2
269829	8
270911	7.5
266844	6.8
271244	6.5
269907	6.6
271296	7.6
270157	8
271322	8.1
267179	7.7
264101	7.5
265518	7.6
269419	7.8
268714	7.8
272482	7.8
268351	7.5
268175	7.5
270674	7.1
272764	7.5
272599	7.5
270333	7.6
270846	7.7
270491	7.7
269160	7.9
274027	8.1
273784	8.2
276663	8.2
274525	8.2
271344	7.9
271115	7.3
270798	6.9
273911	6.6
273985	6.7
271917	6.9
273338	7
270601	7.1
273547	7.2
275363	7.1
281229	6.9
277793	7
279913	6.8
282500	6.4
280041	6.7
282166	6.6
290304	6.4
283519	6.3
287816	6.2
285226	6.5
287595	6.8
289741	6.8
289148	6.4
288301	6.1
290155	5.8
289648	6.1
288225	7.2
289351	7.3
294735	6.9
305333	6.1
309030	5.8
310215	6.2
321935	7.1
325734	7.7
320846	7.9
323023	7.7
319753	7.4
321753	7.5
320757	8
324479	8.1


Summary of computational transaction
Raw Inputview raw input (R code)
Raw Outputview raw output of R engine
Computing time4 seconds
R Server'Gwilym Jenkins' @ 72.249.127.135

\begin{tabular}{lllllllll}
\hline
Summary of computational transaction \tabularnewline
Raw Input & view raw input (R code)  \tabularnewline
Raw Output & view raw output of R engine  \tabularnewline
Computing time & 4 seconds \tabularnewline
R Server & 'Gwilym Jenkins' @ 72.249.127.135 \tabularnewline
\hline
\end{tabular}
%Source: https://freestatistics.org/blog/index.php?pk=58533&T=0

[TABLE]
[ROW][C]Summary of computational transaction[/C][/ROW]
[ROW][C]Raw Input[/C][C]view raw input (R code) [/C][/ROW]
[ROW][C]Raw Output[/C][C]view raw output of R engine [/C][/ROW]
[ROW][C]Computing time[/C][C]4 seconds[/C][/ROW]
[ROW][C]R Server[/C][C]'Gwilym Jenkins' @ 72.249.127.135[/C][/ROW]
[/TABLE]
Source: https://freestatistics.org/blog/index.php?pk=58533&T=0

Globally Unique Identifier (entire table): ba.freestatistics.org/blog/index.php?pk=58533&T=0

As an alternative you can also use a QR Code:  

The GUIDs for individual cells are displayed in the table below:

Summary of computational transaction
Raw Inputview raw input (R code)
Raw Outputview raw output of R engine
Computing time4 seconds
R Server'Gwilym Jenkins' @ 72.249.127.135


Multiple Linear Regression - Estimated Regression Equation
Y[t] = + 317487.905437682 -5289.50501950168X[t] + 4994.36570923069M1[t] + 6573.16604386424M2[t] + 7132.07362427232M3[t] + 3824.18911972193M4[t] + 2881.13794850487M5[t] + 2923.21219557962M6[t] + 5193.80628833877M7[t] + 6833.78978898882M8[t] + 414.960401560134M9[t] -1019.94060234020M10[t] -352.491104290366M11[t] + e[t]

\begin{tabular}{lllllllll}
\hline
Multiple Linear Regression - Estimated Regression Equation \tabularnewline
Y[t] =  +  317487.905437682 -5289.50501950168X[t] +  4994.36570923069M1[t] +  6573.16604386424M2[t] +  7132.07362427232M3[t] +  3824.18911972193M4[t] +  2881.13794850487M5[t] +  2923.21219557962M6[t] +  5193.80628833877M7[t] +  6833.78978898882M8[t] +  414.960401560134M9[t] -1019.94060234020M10[t] -352.491104290366M11[t]  + e[t] \tabularnewline
\hline
\end{tabular}
%Source: https://freestatistics.org/blog/index.php?pk=58533&T=1

[TABLE]
[ROW][C]Multiple Linear Regression - Estimated Regression Equation[/C][/ROW]
[ROW][C]Y[t] =  +  317487.905437682 -5289.50501950168X[t] +  4994.36570923069M1[t] +  6573.16604386424M2[t] +  7132.07362427232M3[t] +  3824.18911972193M4[t] +  2881.13794850487M5[t] +  2923.21219557962M6[t] +  5193.80628833877M7[t] +  6833.78978898882M8[t] +  414.960401560134M9[t] -1019.94060234020M10[t] -352.491104290366M11[t]  + e[t][/C][/ROW]
[/TABLE]
Source: https://freestatistics.org/blog/index.php?pk=58533&T=1

Globally Unique Identifier (entire table): ba.freestatistics.org/blog/index.php?pk=58533&T=1

As an alternative you can also use a QR Code:  

The GUIDs for individual cells are displayed in the table below:

Multiple Linear Regression - Estimated Regression Equation
Y[t] = + 317487.905437682 -5289.50501950168X[t] + 4994.36570923069M1[t] + 6573.16604386424M2[t] + 7132.07362427232M3[t] + 3824.18911972193M4[t] + 2881.13794850487M5[t] + 2923.21219557962M6[t] + 5193.80628833877M7[t] + 6833.78978898882M8[t] + 414.960401560134M9[t] -1019.94060234020M10[t] -352.491104290366M11[t] + e[t]


Multiple Linear Regression - Ordinary Least Squares
VariableParameterS.D.T-STATH0: parameter = 02-tail p-value1-tail p-value
(Intercept)317487.90543768228089.18760511.302900
X-5289.505019501683793.843694-1.39420.1688540.084427
M14994.3657092306911596.3362770.43070.6683810.33419
M26573.1660438642411638.1853850.56480.5745110.287256
M37132.0736242723211551.601650.61740.5395120.269756
M43824.1891197219311471.8595560.33340.7401350.370067
M52881.1379485048711460.1434410.25140.8024380.401219
M62923.2121955796211488.680540.25440.8001020.400051
M75193.8062883387711497.7598980.45170.6532450.326622
M86833.7897889888211509.1598160.59380.5551010.27755
M9414.96040156013411969.7221550.03470.972470.486235
M10-1019.9406023402011974.531075-0.08520.9324310.466215
M11-352.49110429036611994.947476-0.02940.9766630.488331

\begin{tabular}{lllllllll}
\hline
Multiple Linear Regression - Ordinary Least Squares \tabularnewline
Variable & Parameter & S.D. & T-STATH0: parameter = 0 & 2-tail p-value & 1-tail p-value \tabularnewline
(Intercept) & 317487.905437682 & 28089.187605 & 11.3029 & 0 & 0 \tabularnewline
X & -5289.50501950168 & 3793.843694 & -1.3942 & 0.168854 & 0.084427 \tabularnewline
M1 & 4994.36570923069 & 11596.336277 & 0.4307 & 0.668381 & 0.33419 \tabularnewline
M2 & 6573.16604386424 & 11638.185385 & 0.5648 & 0.574511 & 0.287256 \tabularnewline
M3 & 7132.07362427232 & 11551.60165 & 0.6174 & 0.539512 & 0.269756 \tabularnewline
M4 & 3824.18911972193 & 11471.859556 & 0.3334 & 0.740135 & 0.370067 \tabularnewline
M5 & 2881.13794850487 & 11460.143441 & 0.2514 & 0.802438 & 0.401219 \tabularnewline
M6 & 2923.21219557962 & 11488.68054 & 0.2544 & 0.800102 & 0.400051 \tabularnewline
M7 & 5193.80628833877 & 11497.759898 & 0.4517 & 0.653245 & 0.326622 \tabularnewline
M8 & 6833.78978898882 & 11509.159816 & 0.5938 & 0.555101 & 0.27755 \tabularnewline
M9 & 414.960401560134 & 11969.722155 & 0.0347 & 0.97247 & 0.486235 \tabularnewline
M10 & -1019.94060234020 & 11974.531075 & -0.0852 & 0.932431 & 0.466215 \tabularnewline
M11 & -352.491104290366 & 11994.947476 & -0.0294 & 0.976663 & 0.488331 \tabularnewline
\hline
\end{tabular}
%Source: https://freestatistics.org/blog/index.php?pk=58533&T=2

[TABLE]
[ROW][C]Multiple Linear Regression - Ordinary Least Squares[/C][/ROW]
[ROW][C]Variable[/C][C]Parameter[/C][C]S.D.[/C][C]T-STATH0: parameter = 0[/C][C]2-tail p-value[/C][C]1-tail p-value[/C][/ROW]
[ROW][C](Intercept)[/C][C]317487.905437682[/C][C]28089.187605[/C][C]11.3029[/C][C]0[/C][C]0[/C][/ROW]
[ROW][C]X[/C][C]-5289.50501950168[/C][C]3793.843694[/C][C]-1.3942[/C][C]0.168854[/C][C]0.084427[/C][/ROW]
[ROW][C]M1[/C][C]4994.36570923069[/C][C]11596.336277[/C][C]0.4307[/C][C]0.668381[/C][C]0.33419[/C][/ROW]
[ROW][C]M2[/C][C]6573.16604386424[/C][C]11638.185385[/C][C]0.5648[/C][C]0.574511[/C][C]0.287256[/C][/ROW]
[ROW][C]M3[/C][C]7132.07362427232[/C][C]11551.60165[/C][C]0.6174[/C][C]0.539512[/C][C]0.269756[/C][/ROW]
[ROW][C]M4[/C][C]3824.18911972193[/C][C]11471.859556[/C][C]0.3334[/C][C]0.740135[/C][C]0.370067[/C][/ROW]
[ROW][C]M5[/C][C]2881.13794850487[/C][C]11460.143441[/C][C]0.2514[/C][C]0.802438[/C][C]0.401219[/C][/ROW]
[ROW][C]M6[/C][C]2923.21219557962[/C][C]11488.68054[/C][C]0.2544[/C][C]0.800102[/C][C]0.400051[/C][/ROW]
[ROW][C]M7[/C][C]5193.80628833877[/C][C]11497.759898[/C][C]0.4517[/C][C]0.653245[/C][C]0.326622[/C][/ROW]
[ROW][C]M8[/C][C]6833.78978898882[/C][C]11509.159816[/C][C]0.5938[/C][C]0.555101[/C][C]0.27755[/C][/ROW]
[ROW][C]M9[/C][C]414.960401560134[/C][C]11969.722155[/C][C]0.0347[/C][C]0.97247[/C][C]0.486235[/C][/ROW]
[ROW][C]M10[/C][C]-1019.94060234020[/C][C]11974.531075[/C][C]-0.0852[/C][C]0.932431[/C][C]0.466215[/C][/ROW]
[ROW][C]M11[/C][C]-352.491104290366[/C][C]11994.947476[/C][C]-0.0294[/C][C]0.976663[/C][C]0.488331[/C][/ROW]
[/TABLE]
Source: https://freestatistics.org/blog/index.php?pk=58533&T=2

Globally Unique Identifier (entire table): ba.freestatistics.org/blog/index.php?pk=58533&T=2

As an alternative you can also use a QR Code:  

The GUIDs for individual cells are displayed in the table below:

Multiple Linear Regression - Ordinary Least Squares
VariableParameterS.D.T-STATH0: parameter = 02-tail p-value1-tail p-value
(Intercept)317487.90543768228089.18760511.302900
X-5289.505019501683793.843694-1.39420.1688540.084427
M14994.3657092306911596.3362770.43070.6683810.33419
M26573.1660438642411638.1853850.56480.5745110.287256
M37132.0736242723211551.601650.61740.5395120.269756
M43824.1891197219311471.8595560.33340.7401350.370067
M52881.1379485048711460.1434410.25140.8024380.401219
M62923.2121955796211488.680540.25440.8001020.400051
M75193.8062883387711497.7598980.45170.6532450.326622
M86833.7897889888211509.1598160.59380.5551010.27755
M9414.96040156013411969.7221550.03470.972470.486235
M10-1019.9406023402011974.531075-0.08520.9324310.466215
M11-352.49110429036611994.947476-0.02940.9766630.488331


Multiple Linear Regression - Regression Statistics
Multiple R0.213187085790247
R-squared0.0454487335477382
Adjusted R-squared-0.162816997314573
F-TEST (value)0.218224733178908
F-TEST (DF numerator)12
F-TEST (DF denominator)55
p-value0.996878762606105
Multiple Linear Regression - Residual Statistics
Residual Standard Deviation18919.7074278135
Sum Squared Residuals19687543103.4735

\begin{tabular}{lllllllll}
\hline
Multiple Linear Regression - Regression Statistics \tabularnewline
Multiple R & 0.213187085790247 \tabularnewline
R-squared & 0.0454487335477382 \tabularnewline
Adjusted R-squared & -0.162816997314573 \tabularnewline
F-TEST (value) & 0.218224733178908 \tabularnewline
F-TEST (DF numerator) & 12 \tabularnewline
F-TEST (DF denominator) & 55 \tabularnewline
p-value & 0.996878762606105 \tabularnewline
Multiple Linear Regression - Residual Statistics \tabularnewline
Residual Standard Deviation & 18919.7074278135 \tabularnewline
Sum Squared Residuals & 19687543103.4735 \tabularnewline
\hline
\end{tabular}
%Source: https://freestatistics.org/blog/index.php?pk=58533&T=3

[TABLE]
[ROW][C]Multiple Linear Regression - Regression Statistics[/C][/ROW]
[ROW][C]Multiple R[/C][C]0.213187085790247[/C][/ROW]
[ROW][C]R-squared[/C][C]0.0454487335477382[/C][/ROW]
[ROW][C]Adjusted R-squared[/C][C]-0.162816997314573[/C][/ROW]
[ROW][C]F-TEST (value)[/C][C]0.218224733178908[/C][/ROW]
[ROW][C]F-TEST (DF numerator)[/C][C]12[/C][/ROW]
[ROW][C]F-TEST (DF denominator)[/C][C]55[/C][/ROW]
[ROW][C]p-value[/C][C]0.996878762606105[/C][/ROW]
[ROW][C]Multiple Linear Regression - Residual Statistics[/C][/ROW]
[ROW][C]Residual Standard Deviation[/C][C]18919.7074278135[/C][/ROW]
[ROW][C]Sum Squared Residuals[/C][C]19687543103.4735[/C][/ROW]
[/TABLE]
Source: https://freestatistics.org/blog/index.php?pk=58533&T=3

Globally Unique Identifier (entire table): ba.freestatistics.org/blog/index.php?pk=58533&T=3

As an alternative you can also use a QR Code:  

The GUIDs for individual cells are displayed in the table below:

Multiple Linear Regression - Regression Statistics
Multiple R0.213187085790247
R-squared0.0454487335477382
Adjusted R-squared-0.162816997314573
F-TEST (value)0.218224733178908
F-TEST (DF numerator)12
F-TEST (DF denominator)55
p-value0.996878762606105
Multiple Linear Regression - Residual Statistics
Residual Standard Deviation18919.7074278135
Sum Squared Residuals19687543103.4735


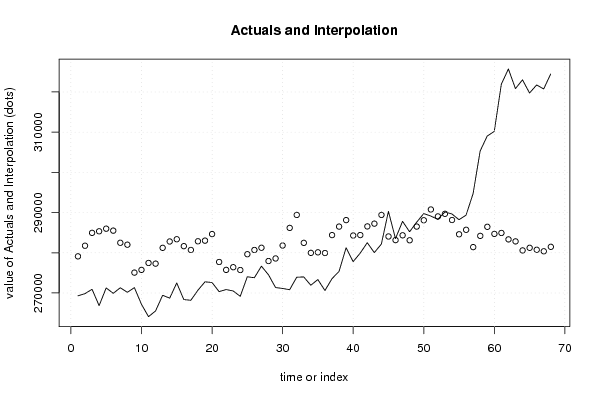
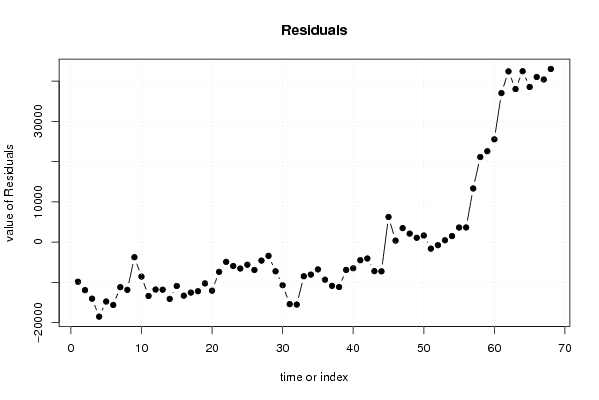
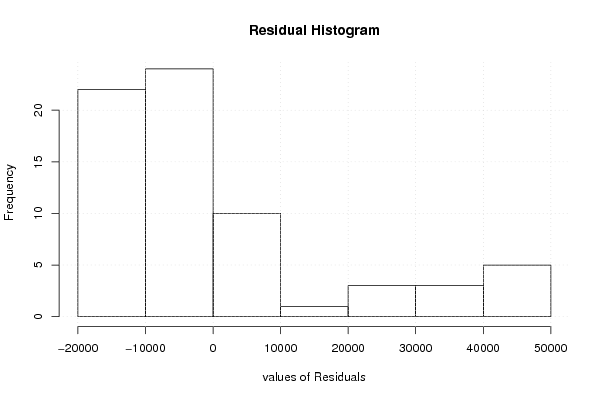
Multiple Linear Regression - Actuals, Interpolation, and Residuals
Time or IndexActualsInterpolationForecastResidualsPrediction Error
1269285279108.329986999-9823.32998699944
2269829281745.031325533-11916.0313255327
3270911284948.691415692-14037.6914156916
4266844285343.460424792-18499.4604247924
5271244285987.260759426-14743.2607594258
6269907285500.384504550-15593.3845045504
7271296282481.473577808-11185.4735778079
8270157282005.655070657-11848.6550706572
9271322275057.875181278-3735.87518127840
10267179275738.776185179-8559.77618517873
11264101277464.126687129-13363.1266871289
12265518277287.667289469-11769.6672894691
13269419281224.131994799-11805.1319947995
14268714282802.932329433-14088.932329433
15272482283361.839909841-10879.8399098411
16268351281640.806911141-13289.8069111412
17268175280697.755739924-12522.7557399241
18270674282855.631994800-12181.6319947996
19272764283010.424079758-10246.4240797580
20272599284650.407580408-12051.4075804081
21270333277702.627691029-7369.62769102923
22270846275738.776185179-4892.77618517873
23270491276406.225683229-5915.22568322856
24269160275700.815783619-6540.81578361859
25274027279637.280488949-5610.28048894894
26273784280687.130321632-6903.13032163233
27276663281246.037902040-4583.03790204042
28274525277938.15339749-3413.15339749002
29271344278581.953732123-7237.95373212347
30271115281797.730990899-10682.7309908992
31270798286184.127091459-15386.1270914590
32273911289410.962097960-15499.9620979596
33273985282463.182208581-8478.18220858074
34271917279970.38020078-8053.38020078007
35273338280108.87919688-6770.87919687974
36270601279932.41979922-9331.41979921994
37273547284397.835006500-10850.8350065005
38275363286505.585843084-11142.5858430842
39281229288122.394427393-6893.39442739259
40277793284285.559420892-6492.55942089202
41279913284400.409253575-4487.40925357531
42282500286558.285508451-4058.28550845072
43280041287242.028095359-7201.02809535937
44282166289410.962097960-7244.96209795959
45290304284050.0337144316253.96628556876
46283519283144.083212481374.916787518922
47287816284340.4832124813475.51678751892
48285226283106.1228109212119.87718907906
49287595286513.6370143011081.36298569888
50289741288092.4373489351648.56265106533
51289148290767.146937143-1619.14693714342
52288301289046.113938444-745.113938443531
53290155289689.914273077465.085726923015
54289648288145.1370143011502.86298569877
55288225284597.2755856093627.72441439147
56289351285708.3085843083642.69141569158
57294735281405.2812046813329.7187953196
58305333284201.98421638121131.0157836186
59309030286456.28522028222573.7147797182
60310215284692.97431677125522.0256832286
61321935284926.78550845137008.2144915494
62325734283331.88283138342402.1171686168
63320846282832.88940789138013.1105921091
64323023280582.90590724142440.0940927591
65319753281226.70624187438526.2937581257
66321753280739.82998699941013.1700130011
67320757280365.67157000740391.3284299928
68324479281476.70456870743002.2954312929

\begin{tabular}{lllllllll}
\hline
Multiple Linear Regression - Actuals, Interpolation, and Residuals \tabularnewline
Time or Index & Actuals & InterpolationForecast & ResidualsPrediction Error \tabularnewline
1 & 269285 & 279108.329986999 & -9823.32998699944 \tabularnewline
2 & 269829 & 281745.031325533 & -11916.0313255327 \tabularnewline
3 & 270911 & 284948.691415692 & -14037.6914156916 \tabularnewline
4 & 266844 & 285343.460424792 & -18499.4604247924 \tabularnewline
5 & 271244 & 285987.260759426 & -14743.2607594258 \tabularnewline
6 & 269907 & 285500.384504550 & -15593.3845045504 \tabularnewline
7 & 271296 & 282481.473577808 & -11185.4735778079 \tabularnewline
8 & 270157 & 282005.655070657 & -11848.6550706572 \tabularnewline
9 & 271322 & 275057.875181278 & -3735.87518127840 \tabularnewline
10 & 267179 & 275738.776185179 & -8559.77618517873 \tabularnewline
11 & 264101 & 277464.126687129 & -13363.1266871289 \tabularnewline
12 & 265518 & 277287.667289469 & -11769.6672894691 \tabularnewline
13 & 269419 & 281224.131994799 & -11805.1319947995 \tabularnewline
14 & 268714 & 282802.932329433 & -14088.932329433 \tabularnewline
15 & 272482 & 283361.839909841 & -10879.8399098411 \tabularnewline
16 & 268351 & 281640.806911141 & -13289.8069111412 \tabularnewline
17 & 268175 & 280697.755739924 & -12522.7557399241 \tabularnewline
18 & 270674 & 282855.631994800 & -12181.6319947996 \tabularnewline
19 & 272764 & 283010.424079758 & -10246.4240797580 \tabularnewline
20 & 272599 & 284650.407580408 & -12051.4075804081 \tabularnewline
21 & 270333 & 277702.627691029 & -7369.62769102923 \tabularnewline
22 & 270846 & 275738.776185179 & -4892.77618517873 \tabularnewline
23 & 270491 & 276406.225683229 & -5915.22568322856 \tabularnewline
24 & 269160 & 275700.815783619 & -6540.81578361859 \tabularnewline
25 & 274027 & 279637.280488949 & -5610.28048894894 \tabularnewline
26 & 273784 & 280687.130321632 & -6903.13032163233 \tabularnewline
27 & 276663 & 281246.037902040 & -4583.03790204042 \tabularnewline
28 & 274525 & 277938.15339749 & -3413.15339749002 \tabularnewline
29 & 271344 & 278581.953732123 & -7237.95373212347 \tabularnewline
30 & 271115 & 281797.730990899 & -10682.7309908992 \tabularnewline
31 & 270798 & 286184.127091459 & -15386.1270914590 \tabularnewline
32 & 273911 & 289410.962097960 & -15499.9620979596 \tabularnewline
33 & 273985 & 282463.182208581 & -8478.18220858074 \tabularnewline
34 & 271917 & 279970.38020078 & -8053.38020078007 \tabularnewline
35 & 273338 & 280108.87919688 & -6770.87919687974 \tabularnewline
36 & 270601 & 279932.41979922 & -9331.41979921994 \tabularnewline
37 & 273547 & 284397.835006500 & -10850.8350065005 \tabularnewline
38 & 275363 & 286505.585843084 & -11142.5858430842 \tabularnewline
39 & 281229 & 288122.394427393 & -6893.39442739259 \tabularnewline
40 & 277793 & 284285.559420892 & -6492.55942089202 \tabularnewline
41 & 279913 & 284400.409253575 & -4487.40925357531 \tabularnewline
42 & 282500 & 286558.285508451 & -4058.28550845072 \tabularnewline
43 & 280041 & 287242.028095359 & -7201.02809535937 \tabularnewline
44 & 282166 & 289410.962097960 & -7244.96209795959 \tabularnewline
45 & 290304 & 284050.033714431 & 6253.96628556876 \tabularnewline
46 & 283519 & 283144.083212481 & 374.916787518922 \tabularnewline
47 & 287816 & 284340.483212481 & 3475.51678751892 \tabularnewline
48 & 285226 & 283106.122810921 & 2119.87718907906 \tabularnewline
49 & 287595 & 286513.637014301 & 1081.36298569888 \tabularnewline
50 & 289741 & 288092.437348935 & 1648.56265106533 \tabularnewline
51 & 289148 & 290767.146937143 & -1619.14693714342 \tabularnewline
52 & 288301 & 289046.113938444 & -745.113938443531 \tabularnewline
53 & 290155 & 289689.914273077 & 465.085726923015 \tabularnewline
54 & 289648 & 288145.137014301 & 1502.86298569877 \tabularnewline
55 & 288225 & 284597.275585609 & 3627.72441439147 \tabularnewline
56 & 289351 & 285708.308584308 & 3642.69141569158 \tabularnewline
57 & 294735 & 281405.28120468 & 13329.7187953196 \tabularnewline
58 & 305333 & 284201.984216381 & 21131.0157836186 \tabularnewline
59 & 309030 & 286456.285220282 & 22573.7147797182 \tabularnewline
60 & 310215 & 284692.974316771 & 25522.0256832286 \tabularnewline
61 & 321935 & 284926.785508451 & 37008.2144915494 \tabularnewline
62 & 325734 & 283331.882831383 & 42402.1171686168 \tabularnewline
63 & 320846 & 282832.889407891 & 38013.1105921091 \tabularnewline
64 & 323023 & 280582.905907241 & 42440.0940927591 \tabularnewline
65 & 319753 & 281226.706241874 & 38526.2937581257 \tabularnewline
66 & 321753 & 280739.829986999 & 41013.1700130011 \tabularnewline
67 & 320757 & 280365.671570007 & 40391.3284299928 \tabularnewline
68 & 324479 & 281476.704568707 & 43002.2954312929 \tabularnewline
\hline
\end{tabular}
%Source: https://freestatistics.org/blog/index.php?pk=58533&T=4

[TABLE]
[ROW][C]Multiple Linear Regression - Actuals, Interpolation, and Residuals[/C][/ROW]
[ROW][C]Time or Index[/C][C]Actuals[/C][C]InterpolationForecast[/C][C]ResidualsPrediction Error[/C][/ROW]
[ROW][C]1[/C][C]269285[/C][C]279108.329986999[/C][C]-9823.32998699944[/C][/ROW]
[ROW][C]2[/C][C]269829[/C][C]281745.031325533[/C][C]-11916.0313255327[/C][/ROW]
[ROW][C]3[/C][C]270911[/C][C]284948.691415692[/C][C]-14037.6914156916[/C][/ROW]
[ROW][C]4[/C][C]266844[/C][C]285343.460424792[/C][C]-18499.4604247924[/C][/ROW]
[ROW][C]5[/C][C]271244[/C][C]285987.260759426[/C][C]-14743.2607594258[/C][/ROW]
[ROW][C]6[/C][C]269907[/C][C]285500.384504550[/C][C]-15593.3845045504[/C][/ROW]
[ROW][C]7[/C][C]271296[/C][C]282481.473577808[/C][C]-11185.4735778079[/C][/ROW]
[ROW][C]8[/C][C]270157[/C][C]282005.655070657[/C][C]-11848.6550706572[/C][/ROW]
[ROW][C]9[/C][C]271322[/C][C]275057.875181278[/C][C]-3735.87518127840[/C][/ROW]
[ROW][C]10[/C][C]267179[/C][C]275738.776185179[/C][C]-8559.77618517873[/C][/ROW]
[ROW][C]11[/C][C]264101[/C][C]277464.126687129[/C][C]-13363.1266871289[/C][/ROW]
[ROW][C]12[/C][C]265518[/C][C]277287.667289469[/C][C]-11769.6672894691[/C][/ROW]
[ROW][C]13[/C][C]269419[/C][C]281224.131994799[/C][C]-11805.1319947995[/C][/ROW]
[ROW][C]14[/C][C]268714[/C][C]282802.932329433[/C][C]-14088.932329433[/C][/ROW]
[ROW][C]15[/C][C]272482[/C][C]283361.839909841[/C][C]-10879.8399098411[/C][/ROW]
[ROW][C]16[/C][C]268351[/C][C]281640.806911141[/C][C]-13289.8069111412[/C][/ROW]
[ROW][C]17[/C][C]268175[/C][C]280697.755739924[/C][C]-12522.7557399241[/C][/ROW]
[ROW][C]18[/C][C]270674[/C][C]282855.631994800[/C][C]-12181.6319947996[/C][/ROW]
[ROW][C]19[/C][C]272764[/C][C]283010.424079758[/C][C]-10246.4240797580[/C][/ROW]
[ROW][C]20[/C][C]272599[/C][C]284650.407580408[/C][C]-12051.4075804081[/C][/ROW]
[ROW][C]21[/C][C]270333[/C][C]277702.627691029[/C][C]-7369.62769102923[/C][/ROW]
[ROW][C]22[/C][C]270846[/C][C]275738.776185179[/C][C]-4892.77618517873[/C][/ROW]
[ROW][C]23[/C][C]270491[/C][C]276406.225683229[/C][C]-5915.22568322856[/C][/ROW]
[ROW][C]24[/C][C]269160[/C][C]275700.815783619[/C][C]-6540.81578361859[/C][/ROW]
[ROW][C]25[/C][C]274027[/C][C]279637.280488949[/C][C]-5610.28048894894[/C][/ROW]
[ROW][C]26[/C][C]273784[/C][C]280687.130321632[/C][C]-6903.13032163233[/C][/ROW]
[ROW][C]27[/C][C]276663[/C][C]281246.037902040[/C][C]-4583.03790204042[/C][/ROW]
[ROW][C]28[/C][C]274525[/C][C]277938.15339749[/C][C]-3413.15339749002[/C][/ROW]
[ROW][C]29[/C][C]271344[/C][C]278581.953732123[/C][C]-7237.95373212347[/C][/ROW]
[ROW][C]30[/C][C]271115[/C][C]281797.730990899[/C][C]-10682.7309908992[/C][/ROW]
[ROW][C]31[/C][C]270798[/C][C]286184.127091459[/C][C]-15386.1270914590[/C][/ROW]
[ROW][C]32[/C][C]273911[/C][C]289410.962097960[/C][C]-15499.9620979596[/C][/ROW]
[ROW][C]33[/C][C]273985[/C][C]282463.182208581[/C][C]-8478.18220858074[/C][/ROW]
[ROW][C]34[/C][C]271917[/C][C]279970.38020078[/C][C]-8053.38020078007[/C][/ROW]
[ROW][C]35[/C][C]273338[/C][C]280108.87919688[/C][C]-6770.87919687974[/C][/ROW]
[ROW][C]36[/C][C]270601[/C][C]279932.41979922[/C][C]-9331.41979921994[/C][/ROW]
[ROW][C]37[/C][C]273547[/C][C]284397.835006500[/C][C]-10850.8350065005[/C][/ROW]
[ROW][C]38[/C][C]275363[/C][C]286505.585843084[/C][C]-11142.5858430842[/C][/ROW]
[ROW][C]39[/C][C]281229[/C][C]288122.394427393[/C][C]-6893.39442739259[/C][/ROW]
[ROW][C]40[/C][C]277793[/C][C]284285.559420892[/C][C]-6492.55942089202[/C][/ROW]
[ROW][C]41[/C][C]279913[/C][C]284400.409253575[/C][C]-4487.40925357531[/C][/ROW]
[ROW][C]42[/C][C]282500[/C][C]286558.285508451[/C][C]-4058.28550845072[/C][/ROW]
[ROW][C]43[/C][C]280041[/C][C]287242.028095359[/C][C]-7201.02809535937[/C][/ROW]
[ROW][C]44[/C][C]282166[/C][C]289410.962097960[/C][C]-7244.96209795959[/C][/ROW]
[ROW][C]45[/C][C]290304[/C][C]284050.033714431[/C][C]6253.96628556876[/C][/ROW]
[ROW][C]46[/C][C]283519[/C][C]283144.083212481[/C][C]374.916787518922[/C][/ROW]
[ROW][C]47[/C][C]287816[/C][C]284340.483212481[/C][C]3475.51678751892[/C][/ROW]
[ROW][C]48[/C][C]285226[/C][C]283106.122810921[/C][C]2119.87718907906[/C][/ROW]
[ROW][C]49[/C][C]287595[/C][C]286513.637014301[/C][C]1081.36298569888[/C][/ROW]
[ROW][C]50[/C][C]289741[/C][C]288092.437348935[/C][C]1648.56265106533[/C][/ROW]
[ROW][C]51[/C][C]289148[/C][C]290767.146937143[/C][C]-1619.14693714342[/C][/ROW]
[ROW][C]52[/C][C]288301[/C][C]289046.113938444[/C][C]-745.113938443531[/C][/ROW]
[ROW][C]53[/C][C]290155[/C][C]289689.914273077[/C][C]465.085726923015[/C][/ROW]
[ROW][C]54[/C][C]289648[/C][C]288145.137014301[/C][C]1502.86298569877[/C][/ROW]
[ROW][C]55[/C][C]288225[/C][C]284597.275585609[/C][C]3627.72441439147[/C][/ROW]
[ROW][C]56[/C][C]289351[/C][C]285708.308584308[/C][C]3642.69141569158[/C][/ROW]
[ROW][C]57[/C][C]294735[/C][C]281405.28120468[/C][C]13329.7187953196[/C][/ROW]
[ROW][C]58[/C][C]305333[/C][C]284201.984216381[/C][C]21131.0157836186[/C][/ROW]
[ROW][C]59[/C][C]309030[/C][C]286456.285220282[/C][C]22573.7147797182[/C][/ROW]
[ROW][C]60[/C][C]310215[/C][C]284692.974316771[/C][C]25522.0256832286[/C][/ROW]
[ROW][C]61[/C][C]321935[/C][C]284926.785508451[/C][C]37008.2144915494[/C][/ROW]
[ROW][C]62[/C][C]325734[/C][C]283331.882831383[/C][C]42402.1171686168[/C][/ROW]
[ROW][C]63[/C][C]320846[/C][C]282832.889407891[/C][C]38013.1105921091[/C][/ROW]
[ROW][C]64[/C][C]323023[/C][C]280582.905907241[/C][C]42440.0940927591[/C][/ROW]
[ROW][C]65[/C][C]319753[/C][C]281226.706241874[/C][C]38526.2937581257[/C][/ROW]
[ROW][C]66[/C][C]321753[/C][C]280739.829986999[/C][C]41013.1700130011[/C][/ROW]
[ROW][C]67[/C][C]320757[/C][C]280365.671570007[/C][C]40391.3284299928[/C][/ROW]
[ROW][C]68[/C][C]324479[/C][C]281476.704568707[/C][C]43002.2954312929[/C][/ROW]
[/TABLE]
Source: https://freestatistics.org/blog/index.php?pk=58533&T=4

Globally Unique Identifier (entire table): ba.freestatistics.org/blog/index.php?pk=58533&T=4

As an alternative you can also use a QR Code:  

The GUIDs for individual cells are displayed in the table below:

Multiple Linear Regression - Actuals, Interpolation, and Residuals
Time or IndexActualsInterpolationForecastResidualsPrediction Error
1269285279108.329986999-9823.32998699944
2269829281745.031325533-11916.0313255327
3270911284948.691415692-14037.6914156916
4266844285343.460424792-18499.4604247924
5271244285987.260759426-14743.2607594258
6269907285500.384504550-15593.3845045504
7271296282481.473577808-11185.4735778079
8270157282005.655070657-11848.6550706572
9271322275057.875181278-3735.87518127840
10267179275738.776185179-8559.77618517873
11264101277464.126687129-13363.1266871289
12265518277287.667289469-11769.6672894691
13269419281224.131994799-11805.1319947995
14268714282802.932329433-14088.932329433
15272482283361.839909841-10879.8399098411
16268351281640.806911141-13289.8069111412
17268175280697.755739924-12522.7557399241
18270674282855.631994800-12181.6319947996
19272764283010.424079758-10246.4240797580
20272599284650.407580408-12051.4075804081
21270333277702.627691029-7369.62769102923
22270846275738.776185179-4892.77618517873
23270491276406.225683229-5915.22568322856
24269160275700.815783619-6540.81578361859
25274027279637.280488949-5610.28048894894
26273784280687.130321632-6903.13032163233
27276663281246.037902040-4583.03790204042
28274525277938.15339749-3413.15339749002
29271344278581.953732123-7237.95373212347
30271115281797.730990899-10682.7309908992
31270798286184.127091459-15386.1270914590
32273911289410.962097960-15499.9620979596
33273985282463.182208581-8478.18220858074
34271917279970.38020078-8053.38020078007
35273338280108.87919688-6770.87919687974
36270601279932.41979922-9331.41979921994
37273547284397.835006500-10850.8350065005
38275363286505.585843084-11142.5858430842
39281229288122.394427393-6893.39442739259
40277793284285.559420892-6492.55942089202
41279913284400.409253575-4487.40925357531
42282500286558.285508451-4058.28550845072
43280041287242.028095359-7201.02809535937
44282166289410.962097960-7244.96209795959
45290304284050.0337144316253.96628556876
46283519283144.083212481374.916787518922
47287816284340.4832124813475.51678751892
48285226283106.1228109212119.87718907906
49287595286513.6370143011081.36298569888
50289741288092.4373489351648.56265106533
51289148290767.146937143-1619.14693714342
52288301289046.113938444-745.113938443531
53290155289689.914273077465.085726923015
54289648288145.1370143011502.86298569877
55288225284597.2755856093627.72441439147
56289351285708.3085843083642.69141569158
57294735281405.2812046813329.7187953196
58305333284201.98421638121131.0157836186
59309030286456.28522028222573.7147797182
60310215284692.97431677125522.0256832286
61321935284926.78550845137008.2144915494
62325734283331.88283138342402.1171686168
63320846282832.88940789138013.1105921091
64323023280582.90590724142440.0940927591
65319753281226.70624187438526.2937581257
66321753280739.82998699941013.1700130011
67320757280365.67157000740391.3284299928
68324479281476.70456870743002.2954312929


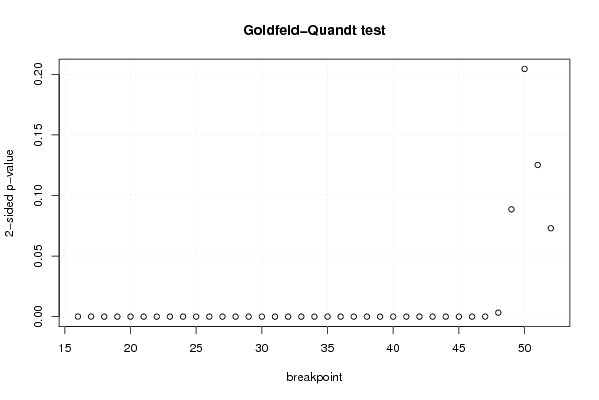
Goldfeld-Quandt test for Heteroskedasticity
p-valuesAlternative Hypothesis
breakpoint indexgreater2-sidedless
164.04726383938087e-058.09452767876174e-050.999959527361606
173.9635164909055e-057.927032981811e-050.99996036483509
182.7899084026308e-065.5798168052616e-060.999997210091597
192.1997906532819e-074.3995813065638e-070.999999780020935
202.5628955899716e-085.1257911799432e-080.999999974371044
212.06248990383508e-094.12497980767016e-090.99999999793751
228.60435482866107e-101.72087096573221e-090.999999999139564
232.56441790436846e-095.12883580873693e-090.999999997435582
245.96786655598481e-101.19357331119696e-090.999999999403213
253.21063236347167e-106.42126472694335e-100.999999999678937
261.37950811913018e-102.75901623826036e-100.99999999986205
275.37675037074263e-111.07535007414853e-100.999999999946233
282.35299604439305e-114.7059920887861e-110.99999999997647
297.35448261911208e-121.47089652382242e-110.999999999992645
302.07098427221814e-124.14196854443628e-120.999999999997929
313.27682319596922e-136.55364639193843e-130.999999999999672
322.24942649977273e-134.49885299954545e-130.999999999999775
331.22913332100359e-132.45826664200718e-130.999999999999877
347.51178128900476e-141.50235625780095e-130.999999999999925
354.03046746371523e-138.06093492743047e-130.999999999999597
369.98760480636597e-131.99752096127319e-120.999999999999001
371.93846373570703e-123.87692747141405e-120.999999999998062
383.78648413945245e-127.57296827890491e-120.999999999996213
391.08072496182894e-112.16144992365788e-110.999999999989193
401.35726153600103e-102.71452307200205e-100.999999999864274
414.67434826407799e-099.34869652815598e-090.999999995325652
423.31522028514376e-086.63044057028753e-080.999999966847797
432.34034184644552e-084.68068369289105e-080.999999976596581
441.81622521119419e-083.63245042238839e-080.999999981837748
451.31141761759197e-072.62283523518394e-070.999999868858238
466.70895848320283e-071.34179169664057e-060.999999329104152
472.3674338603258e-054.7348677206516e-050.999976325661397
480.001651794099632210.003303588199264410.998348205900368
490.04430116453091870.08860232906183750.955698835469081
500.1022510113528160.2045020227056330.897748988647184
510.0625983017594480.1251966035188960.937401698240552
520.03648448932240370.07296897864480730.963515510677596

\begin{tabular}{lllllllll}
\hline
Goldfeld-Quandt test for Heteroskedasticity \tabularnewline
p-values & Alternative Hypothesis \tabularnewline
breakpoint index & greater & 2-sided & less \tabularnewline
16 & 4.04726383938087e-05 & 8.09452767876174e-05 & 0.999959527361606 \tabularnewline
17 & 3.9635164909055e-05 & 7.927032981811e-05 & 0.99996036483509 \tabularnewline
18 & 2.7899084026308e-06 & 5.5798168052616e-06 & 0.999997210091597 \tabularnewline
19 & 2.1997906532819e-07 & 4.3995813065638e-07 & 0.999999780020935 \tabularnewline
20 & 2.5628955899716e-08 & 5.1257911799432e-08 & 0.999999974371044 \tabularnewline
21 & 2.06248990383508e-09 & 4.12497980767016e-09 & 0.99999999793751 \tabularnewline
22 & 8.60435482866107e-10 & 1.72087096573221e-09 & 0.999999999139564 \tabularnewline
23 & 2.56441790436846e-09 & 5.12883580873693e-09 & 0.999999997435582 \tabularnewline
24 & 5.96786655598481e-10 & 1.19357331119696e-09 & 0.999999999403213 \tabularnewline
25 & 3.21063236347167e-10 & 6.42126472694335e-10 & 0.999999999678937 \tabularnewline
26 & 1.37950811913018e-10 & 2.75901623826036e-10 & 0.99999999986205 \tabularnewline
27 & 5.37675037074263e-11 & 1.07535007414853e-10 & 0.999999999946233 \tabularnewline
28 & 2.35299604439305e-11 & 4.7059920887861e-11 & 0.99999999997647 \tabularnewline
29 & 7.35448261911208e-12 & 1.47089652382242e-11 & 0.999999999992645 \tabularnewline
30 & 2.07098427221814e-12 & 4.14196854443628e-12 & 0.999999999997929 \tabularnewline
31 & 3.27682319596922e-13 & 6.55364639193843e-13 & 0.999999999999672 \tabularnewline
32 & 2.24942649977273e-13 & 4.49885299954545e-13 & 0.999999999999775 \tabularnewline
33 & 1.22913332100359e-13 & 2.45826664200718e-13 & 0.999999999999877 \tabularnewline
34 & 7.51178128900476e-14 & 1.50235625780095e-13 & 0.999999999999925 \tabularnewline
35 & 4.03046746371523e-13 & 8.06093492743047e-13 & 0.999999999999597 \tabularnewline
36 & 9.98760480636597e-13 & 1.99752096127319e-12 & 0.999999999999001 \tabularnewline
37 & 1.93846373570703e-12 & 3.87692747141405e-12 & 0.999999999998062 \tabularnewline
38 & 3.78648413945245e-12 & 7.57296827890491e-12 & 0.999999999996213 \tabularnewline
39 & 1.08072496182894e-11 & 2.16144992365788e-11 & 0.999999999989193 \tabularnewline
40 & 1.35726153600103e-10 & 2.71452307200205e-10 & 0.999999999864274 \tabularnewline
41 & 4.67434826407799e-09 & 9.34869652815598e-09 & 0.999999995325652 \tabularnewline
42 & 3.31522028514376e-08 & 6.63044057028753e-08 & 0.999999966847797 \tabularnewline
43 & 2.34034184644552e-08 & 4.68068369289105e-08 & 0.999999976596581 \tabularnewline
44 & 1.81622521119419e-08 & 3.63245042238839e-08 & 0.999999981837748 \tabularnewline
45 & 1.31141761759197e-07 & 2.62283523518394e-07 & 0.999999868858238 \tabularnewline
46 & 6.70895848320283e-07 & 1.34179169664057e-06 & 0.999999329104152 \tabularnewline
47 & 2.3674338603258e-05 & 4.7348677206516e-05 & 0.999976325661397 \tabularnewline
48 & 0.00165179409963221 & 0.00330358819926441 & 0.998348205900368 \tabularnewline
49 & 0.0443011645309187 & 0.0886023290618375 & 0.955698835469081 \tabularnewline
50 & 0.102251011352816 & 0.204502022705633 & 0.897748988647184 \tabularnewline
51 & 0.062598301759448 & 0.125196603518896 & 0.937401698240552 \tabularnewline
52 & 0.0364844893224037 & 0.0729689786448073 & 0.963515510677596 \tabularnewline
\hline
\end{tabular}
%Source: https://freestatistics.org/blog/index.php?pk=58533&T=5

[TABLE]
[ROW][C]Goldfeld-Quandt test for Heteroskedasticity[/C][/ROW]
[ROW][C]p-values[/C][C]Alternative Hypothesis[/C][/ROW]
[ROW][C]breakpoint index[/C][C]greater[/C][C]2-sided[/C][C]less[/C][/ROW]
[ROW][C]16[/C][C]4.04726383938087e-05[/C][C]8.09452767876174e-05[/C][C]0.999959527361606[/C][/ROW]
[ROW][C]17[/C][C]3.9635164909055e-05[/C][C]7.927032981811e-05[/C][C]0.99996036483509[/C][/ROW]
[ROW][C]18[/C][C]2.7899084026308e-06[/C][C]5.5798168052616e-06[/C][C]0.999997210091597[/C][/ROW]
[ROW][C]19[/C][C]2.1997906532819e-07[/C][C]4.3995813065638e-07[/C][C]0.999999780020935[/C][/ROW]
[ROW][C]20[/C][C]2.5628955899716e-08[/C][C]5.1257911799432e-08[/C][C]0.999999974371044[/C][/ROW]
[ROW][C]21[/C][C]2.06248990383508e-09[/C][C]4.12497980767016e-09[/C][C]0.99999999793751[/C][/ROW]
[ROW][C]22[/C][C]8.60435482866107e-10[/C][C]1.72087096573221e-09[/C][C]0.999999999139564[/C][/ROW]
[ROW][C]23[/C][C]2.56441790436846e-09[/C][C]5.12883580873693e-09[/C][C]0.999999997435582[/C][/ROW]
[ROW][C]24[/C][C]5.96786655598481e-10[/C][C]1.19357331119696e-09[/C][C]0.999999999403213[/C][/ROW]
[ROW][C]25[/C][C]3.21063236347167e-10[/C][C]6.42126472694335e-10[/C][C]0.999999999678937[/C][/ROW]
[ROW][C]26[/C][C]1.37950811913018e-10[/C][C]2.75901623826036e-10[/C][C]0.99999999986205[/C][/ROW]
[ROW][C]27[/C][C]5.37675037074263e-11[/C][C]1.07535007414853e-10[/C][C]0.999999999946233[/C][/ROW]
[ROW][C]28[/C][C]2.35299604439305e-11[/C][C]4.7059920887861e-11[/C][C]0.99999999997647[/C][/ROW]
[ROW][C]29[/C][C]7.35448261911208e-12[/C][C]1.47089652382242e-11[/C][C]0.999999999992645[/C][/ROW]
[ROW][C]30[/C][C]2.07098427221814e-12[/C][C]4.14196854443628e-12[/C][C]0.999999999997929[/C][/ROW]
[ROW][C]31[/C][C]3.27682319596922e-13[/C][C]6.55364639193843e-13[/C][C]0.999999999999672[/C][/ROW]
[ROW][C]32[/C][C]2.24942649977273e-13[/C][C]4.49885299954545e-13[/C][C]0.999999999999775[/C][/ROW]
[ROW][C]33[/C][C]1.22913332100359e-13[/C][C]2.45826664200718e-13[/C][C]0.999999999999877[/C][/ROW]
[ROW][C]34[/C][C]7.51178128900476e-14[/C][C]1.50235625780095e-13[/C][C]0.999999999999925[/C][/ROW]
[ROW][C]35[/C][C]4.03046746371523e-13[/C][C]8.06093492743047e-13[/C][C]0.999999999999597[/C][/ROW]
[ROW][C]36[/C][C]9.98760480636597e-13[/C][C]1.99752096127319e-12[/C][C]0.999999999999001[/C][/ROW]
[ROW][C]37[/C][C]1.93846373570703e-12[/C][C]3.87692747141405e-12[/C][C]0.999999999998062[/C][/ROW]
[ROW][C]38[/C][C]3.78648413945245e-12[/C][C]7.57296827890491e-12[/C][C]0.999999999996213[/C][/ROW]
[ROW][C]39[/C][C]1.08072496182894e-11[/C][C]2.16144992365788e-11[/C][C]0.999999999989193[/C][/ROW]
[ROW][C]40[/C][C]1.35726153600103e-10[/C][C]2.71452307200205e-10[/C][C]0.999999999864274[/C][/ROW]
[ROW][C]41[/C][C]4.67434826407799e-09[/C][C]9.34869652815598e-09[/C][C]0.999999995325652[/C][/ROW]
[ROW][C]42[/C][C]3.31522028514376e-08[/C][C]6.63044057028753e-08[/C][C]0.999999966847797[/C][/ROW]
[ROW][C]43[/C][C]2.34034184644552e-08[/C][C]4.68068369289105e-08[/C][C]0.999999976596581[/C][/ROW]
[ROW][C]44[/C][C]1.81622521119419e-08[/C][C]3.63245042238839e-08[/C][C]0.999999981837748[/C][/ROW]
[ROW][C]45[/C][C]1.31141761759197e-07[/C][C]2.62283523518394e-07[/C][C]0.999999868858238[/C][/ROW]
[ROW][C]46[/C][C]6.70895848320283e-07[/C][C]1.34179169664057e-06[/C][C]0.999999329104152[/C][/ROW]
[ROW][C]47[/C][C]2.3674338603258e-05[/C][C]4.7348677206516e-05[/C][C]0.999976325661397[/C][/ROW]
[ROW][C]48[/C][C]0.00165179409963221[/C][C]0.00330358819926441[/C][C]0.998348205900368[/C][/ROW]
[ROW][C]49[/C][C]0.0443011645309187[/C][C]0.0886023290618375[/C][C]0.955698835469081[/C][/ROW]
[ROW][C]50[/C][C]0.102251011352816[/C][C]0.204502022705633[/C][C]0.897748988647184[/C][/ROW]
[ROW][C]51[/C][C]0.062598301759448[/C][C]0.125196603518896[/C][C]0.937401698240552[/C][/ROW]
[ROW][C]52[/C][C]0.0364844893224037[/C][C]0.0729689786448073[/C][C]0.963515510677596[/C][/ROW]
[/TABLE]
Source: https://freestatistics.org/blog/index.php?pk=58533&T=5

Globally Unique Identifier (entire table): ba.freestatistics.org/blog/index.php?pk=58533&T=5

As an alternative you can also use a QR Code:  

The GUIDs for individual cells are displayed in the table below:

Goldfeld-Quandt test for Heteroskedasticity
p-valuesAlternative Hypothesis
breakpoint indexgreater2-sidedless
164.04726383938087e-058.09452767876174e-050.999959527361606
173.9635164909055e-057.927032981811e-050.99996036483509
182.7899084026308e-065.5798168052616e-060.999997210091597
192.1997906532819e-074.3995813065638e-070.999999780020935
202.5628955899716e-085.1257911799432e-080.999999974371044
212.06248990383508e-094.12497980767016e-090.99999999793751
228.60435482866107e-101.72087096573221e-090.999999999139564
232.56441790436846e-095.12883580873693e-090.999999997435582
245.96786655598481e-101.19357331119696e-090.999999999403213
253.21063236347167e-106.42126472694335e-100.999999999678937
261.37950811913018e-102.75901623826036e-100.99999999986205
275.37675037074263e-111.07535007414853e-100.999999999946233
282.35299604439305e-114.7059920887861e-110.99999999997647
297.35448261911208e-121.47089652382242e-110.999999999992645
302.07098427221814e-124.14196854443628e-120.999999999997929
313.27682319596922e-136.55364639193843e-130.999999999999672
322.24942649977273e-134.49885299954545e-130.999999999999775
331.22913332100359e-132.45826664200718e-130.999999999999877
347.51178128900476e-141.50235625780095e-130.999999999999925
354.03046746371523e-138.06093492743047e-130.999999999999597
369.98760480636597e-131.99752096127319e-120.999999999999001
371.93846373570703e-123.87692747141405e-120.999999999998062
383.78648413945245e-127.57296827890491e-120.999999999996213
391.08072496182894e-112.16144992365788e-110.999999999989193
401.35726153600103e-102.71452307200205e-100.999999999864274
414.67434826407799e-099.34869652815598e-090.999999995325652
423.31522028514376e-086.63044057028753e-080.999999966847797
432.34034184644552e-084.68068369289105e-080.999999976596581
441.81622521119419e-083.63245042238839e-080.999999981837748
451.31141761759197e-072.62283523518394e-070.999999868858238
466.70895848320283e-071.34179169664057e-060.999999329104152
472.3674338603258e-054.7348677206516e-050.999976325661397
480.001651794099632210.003303588199264410.998348205900368
490.04430116453091870.08860232906183750.955698835469081
500.1022510113528160.2045020227056330.897748988647184
510.0625983017594480.1251966035188960.937401698240552
520.03648448932240370.07296897864480730.963515510677596


Meta Analysis of Goldfeld-Quandt test for Heteroskedasticity
Description# significant tests% significant testsOK/NOK
1% type I error level330.891891891891892NOK
5% type I error level330.891891891891892NOK
10% type I error level350.945945945945946NOK

\begin{tabular}{lllllllll}
\hline
Meta Analysis of Goldfeld-Quandt test for Heteroskedasticity \tabularnewline
Description & # significant tests & % significant tests & OK/NOK \tabularnewline
1% type I error level & 33 & 0.891891891891892 & NOK \tabularnewline
5% type I error level & 33 & 0.891891891891892 & NOK \tabularnewline
10% type I error level & 35 & 0.945945945945946 & NOK \tabularnewline
\hline
\end{tabular}
%Source: https://freestatistics.org/blog/index.php?pk=58533&T=6

[TABLE]
[ROW][C]Meta Analysis of Goldfeld-Quandt test for Heteroskedasticity[/C][/ROW]
[ROW][C]Description[/C][C]# significant tests[/C][C]% significant tests[/C][C]OK/NOK[/C][/ROW]
[ROW][C]1% type I error level[/C][C]33[/C][C]0.891891891891892[/C][C]NOK[/C][/ROW]
[ROW][C]5% type I error level[/C][C]33[/C][C]0.891891891891892[/C][C]NOK[/C][/ROW]
[ROW][C]10% type I error level[/C][C]35[/C][C]0.945945945945946[/C][C]NOK[/C][/ROW]
[/TABLE]
Source: https://freestatistics.org/blog/index.php?pk=58533&T=6

Globally Unique Identifier (entire table): ba.freestatistics.org/blog/index.php?pk=58533&T=6

As an alternative you can also use a QR Code:  

The GUIDs for individual cells are displayed in the table below:

Meta Analysis of Goldfeld-Quandt test for Heteroskedasticity
Description# significant tests% significant testsOK/NOK
1% type I error level330.891891891891892NOK
5% type I error level330.891891891891892NOK
10% type I error level350.945945945945946NOK


Parameters (Session):
par1 = 1 ; par2 = Include Monthly Dummies ; par3 = No Linear Trend ;
Parameters (R input):
par1 = 1 ; par2 = Include Monthly Dummies ; par3 = No Linear Trend ;
R code (references can be found in the software module):
library(lattice)
library(lmtest)
n25 <- 25 #minimum number of obs. for Goldfeld-Quandt test
par1 <- as.numeric(par1)
x <- t(y)
k <- length(x[1,])
n <- length(x[,1])
x1 <- cbind(x[,par1], x[,1:k!=par1])
mycolnames <- c(colnames(x)[par1], colnames(x)[1:k!=par1])
colnames(x1) <- mycolnames #colnames(x)[par1]
x <- x1
if (par3 == 'First Differences'){
x2 <- array(0, dim=c(n-1,k), dimnames=list(1:(n-1), paste('(1-B)',colnames(x),sep='')))
for (i in 1:n-1) {
for (j in 1:k) {
x2[i,j] <- x[i+1,j] - x[i,j]
}
}
x <- x2
}
if (par2 == 'Include Monthly Dummies'){
x2 <- array(0, dim=c(n,11), dimnames=list(1:n, paste('M', seq(1:11), sep ='')))
for (i in 1:11){
x2[seq(i,n,12),i] <- 1
}
x <- cbind(x, x2)
}
if (par2 == 'Include Quarterly Dummies'){
x2 <- array(0, dim=c(n,3), dimnames=list(1:n, paste('Q', seq(1:3), sep ='')))
for (i in 1:3){
x2[seq(i,n,4),i] <- 1
}
x <- cbind(x, x2)
}
k <- length(x[1,])
if (par3 == 'Linear Trend'){
x <- cbind(x, c(1:n))
colnames(x)[k+1] <- 't'
}
x
k <- length(x[1,])
df <- as.data.frame(x)
(mylm <- lm(df))
(mysum <- summary(mylm))
if (n > n25) {
kp3 <- k + 3
nmkm3 <- n - k - 3
gqarr <- array(NA, dim=c(nmkm3-kp3+1,3))
numgqtests <- 0
numsignificant1 <- 0
numsignificant5 <- 0
numsignificant10 <- 0
for (mypoint in kp3:nmkm3) {
j <- 0
numgqtests <- numgqtests + 1
for (myalt in c('greater', 'two.sided', 'less')) {
j <- j + 1
gqarr[mypoint-kp3+1,j] <- gqtest(mylm, point=mypoint, alternative=myalt)$p.value
}
if (gqarr[mypoint-kp3+1,2] < 0.01) numsignificant1 <- numsignificant1 + 1
if (gqarr[mypoint-kp3+1,2] < 0.05) numsignificant5 <- numsignificant5 + 1
if (gqarr[mypoint-kp3+1,2] < 0.10) numsignificant10 <- numsignificant10 + 1
}
gqarr
}
bitmap(file='test0.png')
plot(x[,1], type='l', main='Actuals and Interpolation', ylab='value of Actuals and Interpolation (dots)', xlab='time or index')
points(x[,1]-mysum$resid)
grid()
dev.off()
bitmap(file='test1.png')
plot(mysum$resid, type='b', pch=19, main='Residuals', ylab='value of Residuals', xlab='time or index')
grid()
dev.off()
bitmap(file='test2.png')
hist(mysum$resid, main='Residual Histogram', xlab='values of Residuals')
grid()
dev.off()
bitmap(file='test3.png')
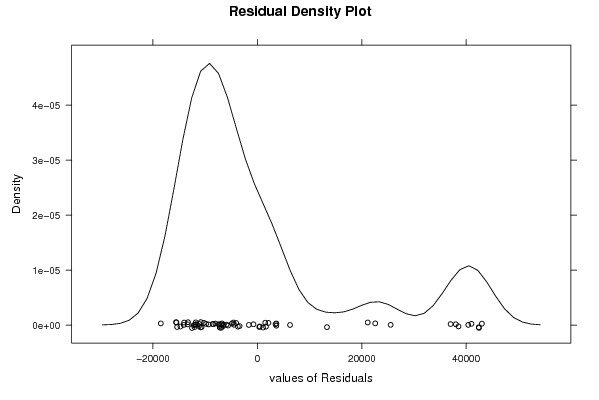
densityplot(~mysum$resid,col='black',main='Residual Density Plot', xlab='values of Residuals')
dev.off()
bitmap(file='test4.png')
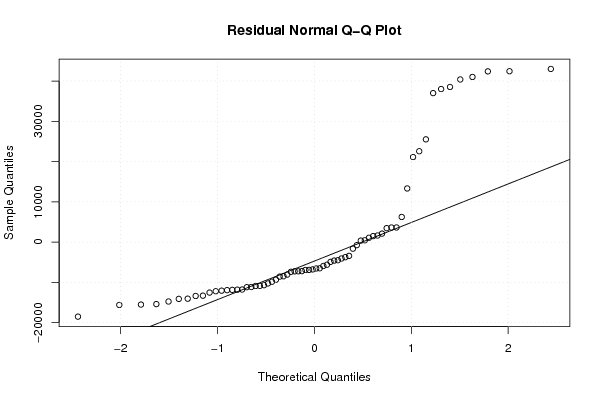
qqnorm(mysum$resid, main='Residual Normal Q-Q Plot')
qqline(mysum$resid)
grid()
dev.off()
(myerror <- as.ts(mysum$resid))
bitmap(file='test5.png')
dum <- cbind(lag(myerror,k=1),myerror)
dum
dum1 <- dum[2:length(myerror),]
dum1
z <- as.data.frame(dum1)
z
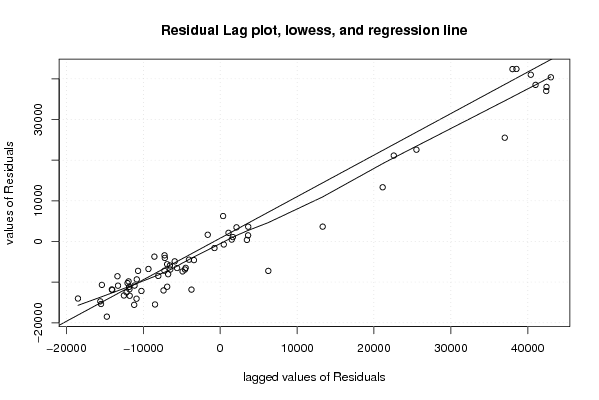
plot(z,main=paste('Residual Lag plot, lowess, and regression line'), ylab='values of Residuals', xlab='lagged values of Residuals')
lines(lowess(z))
abline(lm(z))
grid()
dev.off()
bitmap(file='test6.png')
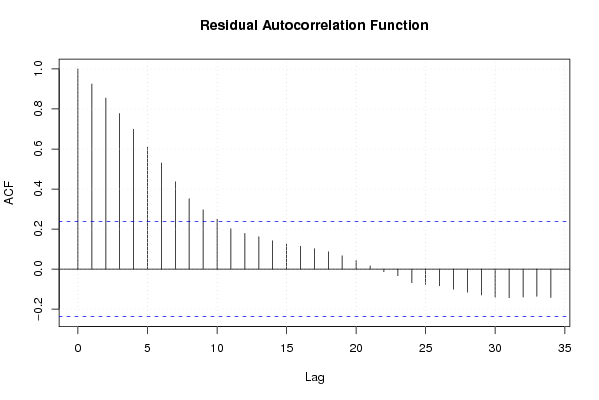
acf(mysum$resid, lag.max=length(mysum$resid)/2, main='Residual Autocorrelation Function')
grid()
dev.off()
bitmap(file='test7.png')
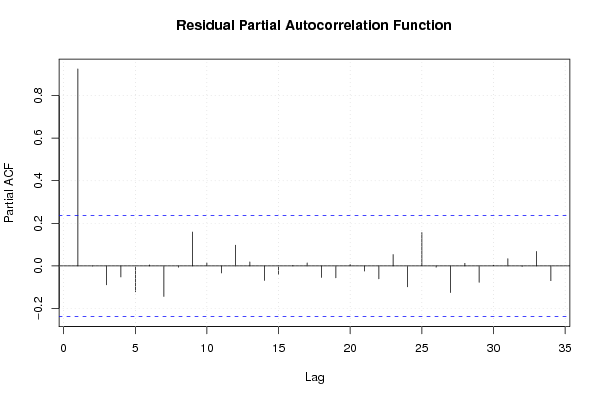
pacf(mysum$resid, lag.max=length(mysum$resid)/2, main='Residual Partial Autocorrelation Function')
grid()
dev.off()
bitmap(file='test8.png')
opar <- par(mfrow = c(2,2), oma = c(0, 0, 1.1, 0))
plot(mylm, las = 1, sub='Residual Diagnostics')
par(opar)
dev.off()
if (n > n25) {
bitmap(file='test9.png')
plot(kp3:nmkm3,gqarr[,2], main='Goldfeld-Quandt test',ylab='2-sided p-value',xlab='breakpoint')
grid()
dev.off()
}
load(file='createtable')
a<-table.start()
a<-table.row.start(a)
a<-table.element(a, 'Multiple Linear Regression - Estimated Regression Equation', 1, TRUE)
a<-table.row.end(a)
myeq <- colnames(x)[1]
myeq <- paste(myeq, '[t] = ', sep='')
for (i in 1:k){
if (mysum$coefficients[i,1] > 0) myeq <- paste(myeq, '+', '')
myeq <- paste(myeq, mysum$coefficients[i,1], sep=' ')
if (rownames(mysum$coefficients)[i] != '(Intercept)') {
myeq <- paste(myeq, rownames(mysum$coefficients)[i], sep='')
if (rownames(mysum$coefficients)[i] != 't') myeq <- paste(myeq, '[t]', sep='')
}
}
myeq <- paste(myeq, ' + e[t]')
a<-table.row.start(a)
a<-table.element(a, myeq)
a<-table.row.end(a)
a<-table.end(a)
table.save(a,file='mytable1.tab')
a<-table.start()
a<-table.row.start(a)
a<-table.element(a,hyperlink('ols1.htm','Multiple Linear Regression - Ordinary Least Squares',''), 6, TRUE)
a<-table.row.end(a)
a<-table.row.start(a)
a<-table.element(a,'Variable',header=TRUE)
a<-table.element(a,'Parameter',header=TRUE)
a<-table.element(a,'S.D.',header=TRUE)
a<-table.element(a,'T-STAT
H0: parameter = 0',header=TRUE)
a<-table.element(a,'2-tail p-value',header=TRUE)
a<-table.element(a,'1-tail p-value',header=TRUE)
a<-table.row.end(a)
for (i in 1:k){
a<-table.row.start(a)
a<-table.element(a,rownames(mysum$coefficients)[i],header=TRUE)
a<-table.element(a,mysum$coefficients[i,1])
a<-table.element(a, round(mysum$coefficients[i,2],6))
a<-table.element(a, round(mysum$coefficients[i,3],4))
a<-table.element(a, round(mysum$coefficients[i,4],6))
a<-table.element(a, round(mysum$coefficients[i,4]/2,6))
a<-table.row.end(a)
}
a<-table.end(a)
table.save(a,file='mytable2.tab')
a<-table.start()
a<-table.row.start(a)
a<-table.element(a, 'Multiple Linear Regression - Regression Statistics', 2, TRUE)
a<-table.row.end(a)
a<-table.row.start(a)
a<-table.element(a, 'Multiple R',1,TRUE)
a<-table.element(a, sqrt(mysum$r.squared))
a<-table.row.end(a)
a<-table.row.start(a)
a<-table.element(a, 'R-squared',1,TRUE)
a<-table.element(a, mysum$r.squared)
a<-table.row.end(a)
a<-table.row.start(a)
a<-table.element(a, 'Adjusted R-squared',1,TRUE)
a<-table.element(a, mysum$adj.r.squared)
a<-table.row.end(a)
a<-table.row.start(a)
a<-table.element(a, 'F-TEST (value)',1,TRUE)
a<-table.element(a, mysum$fstatistic[1])
a<-table.row.end(a)
a<-table.row.start(a)
a<-table.element(a, 'F-TEST (DF numerator)',1,TRUE)
a<-table.element(a, mysum$fstatistic[2])
a<-table.row.end(a)
a<-table.row.start(a)
a<-table.element(a, 'F-TEST (DF denominator)',1,TRUE)
a<-table.element(a, mysum$fstatistic[3])
a<-table.row.end(a)
a<-table.row.start(a)
a<-table.element(a, 'p-value',1,TRUE)
a<-table.element(a, 1-pf(mysum$fstatistic[1],mysum$fstatistic[2],mysum$fstatistic[3]))
a<-table.row.end(a)
a<-table.row.start(a)
a<-table.element(a, 'Multiple Linear Regression - Residual Statistics', 2, TRUE)
a<-table.row.end(a)
a<-table.row.start(a)
a<-table.element(a, 'Residual Standard Deviation',1,TRUE)
a<-table.element(a, mysum$sigma)
a<-table.row.end(a)
a<-table.row.start(a)
a<-table.element(a, 'Sum Squared Residuals',1,TRUE)
a<-table.element(a, sum(myerror*myerror))
a<-table.row.end(a)
a<-table.end(a)
table.save(a,file='mytable3.tab')
a<-table.start()
a<-table.row.start(a)
a<-table.element(a, 'Multiple Linear Regression - Actuals, Interpolation, and Residuals', 4, TRUE)
a<-table.row.end(a)
a<-table.row.start(a)
a<-table.element(a, 'Time or Index', 1, TRUE)
a<-table.element(a, 'Actuals', 1, TRUE)
a<-table.element(a, 'Interpolation
Forecast', 1, TRUE)
a<-table.element(a, 'Residuals
Prediction Error', 1, TRUE)
a<-table.row.end(a)
for (i in 1:n) {
a<-table.row.start(a)
a<-table.element(a,i, 1, TRUE)
a<-table.element(a,x[i])
a<-table.element(a,x[i]-mysum$resid[i])
a<-table.element(a,mysum$resid[i])
a<-table.row.end(a)
}
a<-table.end(a)
table.save(a,file='mytable4.tab')
if (n > n25) {
a<-table.start()
a<-table.row.start(a)
a<-table.element(a,'Goldfeld-Quandt test for Heteroskedasticity',4,TRUE)
a<-table.row.end(a)
a<-table.row.start(a)
a<-table.element(a,'p-values',header=TRUE)
a<-table.element(a,'Alternative Hypothesis',3,header=TRUE)
a<-table.row.end(a)
a<-table.row.start(a)
a<-table.element(a,'breakpoint index',header=TRUE)
a<-table.element(a,'greater',header=TRUE)
a<-table.element(a,'2-sided',header=TRUE)
a<-table.element(a,'less',header=TRUE)
a<-table.row.end(a)
for (mypoint in kp3:nmkm3) {
a<-table.row.start(a)
a<-table.element(a,mypoint,header=TRUE)
a<-table.element(a,gqarr[mypoint-kp3+1,1])
a<-table.element(a,gqarr[mypoint-kp3+1,2])
a<-table.element(a,gqarr[mypoint-kp3+1,3])
a<-table.row.end(a)
}
a<-table.end(a)
table.save(a,file='mytable5.tab')
a<-table.start()
a<-table.row.start(a)
a<-table.element(a,'Meta Analysis of Goldfeld-Quandt test for Heteroskedasticity',4,TRUE)
a<-table.row.end(a)
a<-table.row.start(a)
a<-table.element(a,'Description',header=TRUE)
a<-table.element(a,'# significant tests',header=TRUE)
a<-table.element(a,'% significant tests',header=TRUE)
a<-table.element(a,'OK/NOK',header=TRUE)
a<-table.row.end(a)
a<-table.row.start(a)
a<-table.element(a,'1% type I error level',header=TRUE)
a<-table.element(a,numsignificant1)
a<-table.element(a,numsignificant1/numgqtests)
if (numsignificant1/numgqtests < 0.01) dum <- 'OK' else dum <- 'NOK'
a<-table.element(a,dum)
a<-table.row.end(a)
a<-table.row.start(a)
a<-table.element(a,'5% type I error level',header=TRUE)
a<-table.element(a,numsignificant5)
a<-table.element(a,numsignificant5/numgqtests)
if (numsignificant5/numgqtests < 0.05) dum <- 'OK' else dum <- 'NOK'
a<-table.element(a,dum)
a<-table.row.end(a)
a<-table.row.start(a)
a<-table.element(a,'10% type I error level',header=TRUE)
a<-table.element(a,numsignificant10)
a<-table.element(a,numsignificant10/numgqtests)
if (numsignificant10/numgqtests < 0.1) dum <- 'OK' else dum <- 'NOK'
a<-table.element(a,dum)
a<-table.row.end(a)
a<-table.end(a)
table.save(a,file='mytable6.tab')
}