Free Statistics

of Irreproducible Research!

Author's title

Author*The author of this computation has been verified*
R Software Modulerwasp_multipleregression.wasp
Title produced by softwareMultiple Regression
Date of computationSat, 21 Nov 2009 05:10:07 -0700
Cite this page as followsStatistical Computations at FreeStatistics.org, Office for Research Development and Education, URL https://freestatistics.org/blog/index.php?v=date/2009/Nov/21/t1258806170f43xt4g21hr7bae.htm/, Retrieved Sun, 28 Apr 2024 00:50:17 +0000
Statistical Computations at FreeStatistics.org, Office for Research Development and Education, URL https://freestatistics.org/blog/index.php?pk=58534, Retrieved Sun, 28 Apr 2024 00:50:17 +0000
QR Codes:

Original text written by user:
IsPrivate?No (this computation is public)
User-defined keywords
Estimated Impact190
Family? (F = Feedback message, R = changed R code, M = changed R Module, P = changed Parameters, D = changed Data)
-     [Multiple Regression] [Q1 The Seatbeltlaw] [2007-11-14 19:27:43] [8cd6641b921d30ebe00b648d1481bba0]
- RMPD  [Multiple Regression] [Seatbelt] [2009-11-12 13:54:52] [b98453cac15ba1066b407e146608df68]
-   PD      [Multiple Regression] [WS7.3] [2009-11-21 12:10:07] [dd4f17965cad1d38de7a1c062d32d75d] [Current]
Feedback Forum

Post a new message
Dataseries X:
269285	8.2
269829	8
270911	7.5
266844	6.8
271244	6.5
269907	6.6
271296	7.6
270157	8
271322	8.1
267179	7.7
264101	7.5
265518	7.6
269419	7.8
268714	7.8
272482	7.8
268351	7.5
268175	7.5
270674	7.1
272764	7.5
272599	7.5
270333	7.6
270846	7.7
270491	7.7
269160	7.9
274027	8.1
273784	8.2
276663	8.2
274525	8.2
271344	7.9
271115	7.3
270798	6.9
273911	6.6
273985	6.7
271917	6.9
273338	7
270601	7.1
273547	7.2
275363	7.1
281229	6.9
277793	7
279913	6.8
282500	6.4
280041	6.7
282166	6.6
290304	6.4
283519	6.3
287816	6.2
285226	6.5
287595	6.8
289741	6.8
289148	6.4
288301	6.1
290155	5.8
289648	6.1
288225	7.2
289351	7.3
294735	6.9
305333	6.1
309030	5.8
310215	6.2
321935	7.1
325734	7.7
320846	7.9
323023	7.7
319753	7.4
321753	7.5
320757	8
324479	8.1


Summary of computational transaction
Raw Inputview raw input (R code)
Raw Outputview raw output of R engine
Computing time4 seconds
R Server'Gwilym Jenkins' @ 72.249.127.135

\begin{tabular}{lllllllll}
\hline
Summary of computational transaction \tabularnewline
Raw Input & view raw input (R code)  \tabularnewline
Raw Output & view raw output of R engine  \tabularnewline
Computing time & 4 seconds \tabularnewline
R Server & 'Gwilym Jenkins' @ 72.249.127.135 \tabularnewline
\hline
\end{tabular}
%Source: https://freestatistics.org/blog/index.php?pk=58534&T=0

[TABLE]
[ROW][C]Summary of computational transaction[/C][/ROW]
[ROW][C]Raw Input[/C][C]view raw input (R code) [/C][/ROW]
[ROW][C]Raw Output[/C][C]view raw output of R engine [/C][/ROW]
[ROW][C]Computing time[/C][C]4 seconds[/C][/ROW]
[ROW][C]R Server[/C][C]'Gwilym Jenkins' @ 72.249.127.135[/C][/ROW]
[/TABLE]
Source: https://freestatistics.org/blog/index.php?pk=58534&T=0

Globally Unique Identifier (entire table): ba.freestatistics.org/blog/index.php?pk=58534&T=0

As an alternative you can also use a QR Code:  

The GUIDs for individual cells are displayed in the table below:

Summary of computational transaction
Raw Inputview raw input (R code)
Raw Outputview raw output of R engine
Computing time4 seconds
R Server'Gwilym Jenkins' @ 72.249.127.135


Multiple Linear Regression - Estimated Regression Equation
Y[t] = + 209353.868069024 + 5735.54723429517X[t] + 3983.78103921857M1[t] + 3985.98987757529M2[t] + 5357.06728336256M3[t] + 3780.10695867444M4[t] + 4567.97996731963M5[t] + 5422.22403977358M6[t] + 1522.45486384059M7[t] + 1953.34861000709M8[t] + 2057.72025932738M9[t] + 1986.24169349609M10[t] + 2914.60840423528M11[t] + 841.58801269033t + e[t]

\begin{tabular}{lllllllll}
\hline
Multiple Linear Regression - Estimated Regression Equation \tabularnewline
Y[t] =  +  209353.868069024 +  5735.54723429517X[t] +  3983.78103921857M1[t] +  3985.98987757529M2[t] +  5357.06728336256M3[t] +  3780.10695867444M4[t] +  4567.97996731963M5[t] +  5422.22403977358M6[t] +  1522.45486384059M7[t] +  1953.34861000709M8[t] +  2057.72025932738M9[t] +  1986.24169349609M10[t] +  2914.60840423528M11[t] +  841.58801269033t  + e[t] \tabularnewline
\hline
\end{tabular}
%Source: https://freestatistics.org/blog/index.php?pk=58534&T=1

[TABLE]
[ROW][C]Multiple Linear Regression - Estimated Regression Equation[/C][/ROW]
[ROW][C]Y[t] =  +  209353.868069024 +  5735.54723429517X[t] +  3983.78103921857M1[t] +  3985.98987757529M2[t] +  5357.06728336256M3[t] +  3780.10695867444M4[t] +  4567.97996731963M5[t] +  5422.22403977358M6[t] +  1522.45486384059M7[t] +  1953.34861000709M8[t] +  2057.72025932738M9[t] +  1986.24169349609M10[t] +  2914.60840423528M11[t] +  841.58801269033t  + e[t][/C][/ROW]
[/TABLE]
Source: https://freestatistics.org/blog/index.php?pk=58534&T=1

Globally Unique Identifier (entire table): ba.freestatistics.org/blog/index.php?pk=58534&T=1

As an alternative you can also use a QR Code:  

The GUIDs for individual cells are displayed in the table below:

Multiple Linear Regression - Estimated Regression Equation
Y[t] = + 209353.868069024 + 5735.54723429517X[t] + 3983.78103921857M1[t] + 3985.98987757529M2[t] + 5357.06728336256M3[t] + 3780.10695867444M4[t] + 4567.97996731963M5[t] + 5422.22403977358M6[t] + 1522.45486384059M7[t] + 1953.34861000709M8[t] + 2057.72025932738M9[t] + 1986.24169349609M10[t] + 2914.60840423528M11[t] + 841.58801269033t + e[t]


Multiple Linear Regression - Ordinary Least Squares
VariableParameterS.D.T-STATH0: parameter = 02-tail p-value1-tail p-value
(Intercept)209353.86806902415462.82380513.539200
X5735.547234295171969.6459732.9120.0052120.002606
M13983.781039218575502.9906240.72390.4722330.236117
M23985.989877575295525.5445630.72140.4737910.236895
M35357.067283362565482.786410.97710.3328910.166446
M43780.106958674445443.4392190.69440.4903870.245194
M54567.979967319635439.2537650.83980.4047140.202357
M65422.224039773585454.4293640.99410.324610.162305
M71522.454863840595462.2162720.27870.7815210.39076
M81953.348610007095472.5862490.35690.7225330.361266
M92057.720259327385680.9242760.36220.7186050.359302
M101986.241693496095686.1355830.34930.7282130.364106
M112914.608404235285696.5712160.51160.6109870.305494
t841.5880126903361.01065113.794100

\begin{tabular}{lllllllll}
\hline
Multiple Linear Regression - Ordinary Least Squares \tabularnewline
Variable & Parameter & S.D. & T-STATH0: parameter = 0 & 2-tail p-value & 1-tail p-value \tabularnewline
(Intercept) & 209353.868069024 & 15462.823805 & 13.5392 & 0 & 0 \tabularnewline
X & 5735.54723429517 & 1969.645973 & 2.912 & 0.005212 & 0.002606 \tabularnewline
M1 & 3983.78103921857 & 5502.990624 & 0.7239 & 0.472233 & 0.236117 \tabularnewline
M2 & 3985.98987757529 & 5525.544563 & 0.7214 & 0.473791 & 0.236895 \tabularnewline
M3 & 5357.06728336256 & 5482.78641 & 0.9771 & 0.332891 & 0.166446 \tabularnewline
M4 & 3780.10695867444 & 5443.439219 & 0.6944 & 0.490387 & 0.245194 \tabularnewline
M5 & 4567.97996731963 & 5439.253765 & 0.8398 & 0.404714 & 0.202357 \tabularnewline
M6 & 5422.22403977358 & 5454.429364 & 0.9941 & 0.32461 & 0.162305 \tabularnewline
M7 & 1522.45486384059 & 5462.216272 & 0.2787 & 0.781521 & 0.39076 \tabularnewline
M8 & 1953.34861000709 & 5472.586249 & 0.3569 & 0.722533 & 0.361266 \tabularnewline
M9 & 2057.72025932738 & 5680.924276 & 0.3622 & 0.718605 & 0.359302 \tabularnewline
M10 & 1986.24169349609 & 5686.135583 & 0.3493 & 0.728213 & 0.364106 \tabularnewline
M11 & 2914.60840423528 & 5696.571216 & 0.5116 & 0.610987 & 0.305494 \tabularnewline
t & 841.58801269033 & 61.010651 & 13.7941 & 0 & 0 \tabularnewline
\hline
\end{tabular}
%Source: https://freestatistics.org/blog/index.php?pk=58534&T=2

[TABLE]
[ROW][C]Multiple Linear Regression - Ordinary Least Squares[/C][/ROW]
[ROW][C]Variable[/C][C]Parameter[/C][C]S.D.[/C][C]T-STATH0: parameter = 0[/C][C]2-tail p-value[/C][C]1-tail p-value[/C][/ROW]
[ROW][C](Intercept)[/C][C]209353.868069024[/C][C]15462.823805[/C][C]13.5392[/C][C]0[/C][C]0[/C][/ROW]
[ROW][C]X[/C][C]5735.54723429517[/C][C]1969.645973[/C][C]2.912[/C][C]0.005212[/C][C]0.002606[/C][/ROW]
[ROW][C]M1[/C][C]3983.78103921857[/C][C]5502.990624[/C][C]0.7239[/C][C]0.472233[/C][C]0.236117[/C][/ROW]
[ROW][C]M2[/C][C]3985.98987757529[/C][C]5525.544563[/C][C]0.7214[/C][C]0.473791[/C][C]0.236895[/C][/ROW]
[ROW][C]M3[/C][C]5357.06728336256[/C][C]5482.78641[/C][C]0.9771[/C][C]0.332891[/C][C]0.166446[/C][/ROW]
[ROW][C]M4[/C][C]3780.10695867444[/C][C]5443.439219[/C][C]0.6944[/C][C]0.490387[/C][C]0.245194[/C][/ROW]
[ROW][C]M5[/C][C]4567.97996731963[/C][C]5439.253765[/C][C]0.8398[/C][C]0.404714[/C][C]0.202357[/C][/ROW]
[ROW][C]M6[/C][C]5422.22403977358[/C][C]5454.429364[/C][C]0.9941[/C][C]0.32461[/C][C]0.162305[/C][/ROW]
[ROW][C]M7[/C][C]1522.45486384059[/C][C]5462.216272[/C][C]0.2787[/C][C]0.781521[/C][C]0.39076[/C][/ROW]
[ROW][C]M8[/C][C]1953.34861000709[/C][C]5472.586249[/C][C]0.3569[/C][C]0.722533[/C][C]0.361266[/C][/ROW]
[ROW][C]M9[/C][C]2057.72025932738[/C][C]5680.924276[/C][C]0.3622[/C][C]0.718605[/C][C]0.359302[/C][/ROW]
[ROW][C]M10[/C][C]1986.24169349609[/C][C]5686.135583[/C][C]0.3493[/C][C]0.728213[/C][C]0.364106[/C][/ROW]
[ROW][C]M11[/C][C]2914.60840423528[/C][C]5696.571216[/C][C]0.5116[/C][C]0.610987[/C][C]0.305494[/C][/ROW]
[ROW][C]t[/C][C]841.58801269033[/C][C]61.010651[/C][C]13.7941[/C][C]0[/C][C]0[/C][/ROW]
[/TABLE]
Source: https://freestatistics.org/blog/index.php?pk=58534&T=2

Globally Unique Identifier (entire table): ba.freestatistics.org/blog/index.php?pk=58534&T=2

As an alternative you can also use a QR Code:  

The GUIDs for individual cells are displayed in the table below:

Multiple Linear Regression - Ordinary Least Squares
VariableParameterS.D.T-STATH0: parameter = 02-tail p-value1-tail p-value
(Intercept)209353.86806902415462.82380513.539200
X5735.547234295171969.6459732.9120.0052120.002606
M13983.781039218575502.9906240.72390.4722330.236117
M23985.989877575295525.5445630.72140.4737910.236895
M35357.067283362565482.786410.97710.3328910.166446
M43780.106958674445443.4392190.69440.4903870.245194
M54567.979967319635439.2537650.83980.4047140.202357
M65422.224039773585454.4293640.99410.324610.162305
M71522.454863840595462.2162720.27870.7815210.39076
M81953.348610007095472.5862490.35690.7225330.361266
M92057.720259327385680.9242760.36220.7186050.359302
M101986.241693496095686.1355830.34930.7282130.364106
M112914.608404235285696.5712160.51160.6109870.305494
t841.5880126903361.01065113.794100


Multiple Linear Regression - Regression Statistics
Multiple R0.888249380073616
R-squared0.788986961201163
Adjusted R-squared0.738187525934777
F-TEST (value)15.5314120533782
F-TEST (DF numerator)13
F-TEST (DF denominator)54
p-value7.84927678409986e-14
Multiple Linear Regression - Residual Statistics
Residual Standard Deviation8977.46866398717
Sum Squared Residuals4352126955.09506

\begin{tabular}{lllllllll}
\hline
Multiple Linear Regression - Regression Statistics \tabularnewline
Multiple R & 0.888249380073616 \tabularnewline
R-squared & 0.788986961201163 \tabularnewline
Adjusted R-squared & 0.738187525934777 \tabularnewline
F-TEST (value) & 15.5314120533782 \tabularnewline
F-TEST (DF numerator) & 13 \tabularnewline
F-TEST (DF denominator) & 54 \tabularnewline
p-value & 7.84927678409986e-14 \tabularnewline
Multiple Linear Regression - Residual Statistics \tabularnewline
Residual Standard Deviation & 8977.46866398717 \tabularnewline
Sum Squared Residuals & 4352126955.09506 \tabularnewline
\hline
\end{tabular}
%Source: https://freestatistics.org/blog/index.php?pk=58534&T=3

[TABLE]
[ROW][C]Multiple Linear Regression - Regression Statistics[/C][/ROW]
[ROW][C]Multiple R[/C][C]0.888249380073616[/C][/ROW]
[ROW][C]R-squared[/C][C]0.788986961201163[/C][/ROW]
[ROW][C]Adjusted R-squared[/C][C]0.738187525934777[/C][/ROW]
[ROW][C]F-TEST (value)[/C][C]15.5314120533782[/C][/ROW]
[ROW][C]F-TEST (DF numerator)[/C][C]13[/C][/ROW]
[ROW][C]F-TEST (DF denominator)[/C][C]54[/C][/ROW]
[ROW][C]p-value[/C][C]7.84927678409986e-14[/C][/ROW]
[ROW][C]Multiple Linear Regression - Residual Statistics[/C][/ROW]
[ROW][C]Residual Standard Deviation[/C][C]8977.46866398717[/C][/ROW]
[ROW][C]Sum Squared Residuals[/C][C]4352126955.09506[/C][/ROW]
[/TABLE]
Source: https://freestatistics.org/blog/index.php?pk=58534&T=3

Globally Unique Identifier (entire table): ba.freestatistics.org/blog/index.php?pk=58534&T=3

As an alternative you can also use a QR Code:  

The GUIDs for individual cells are displayed in the table below:

Multiple Linear Regression - Regression Statistics
Multiple R0.888249380073616
R-squared0.788986961201163
Adjusted R-squared0.738187525934777
F-TEST (value)15.5314120533782
F-TEST (DF numerator)13
F-TEST (DF denominator)54
p-value7.84927678409986e-14
Multiple Linear Regression - Residual Statistics
Residual Standard Deviation8977.46866398717
Sum Squared Residuals4352126955.09506


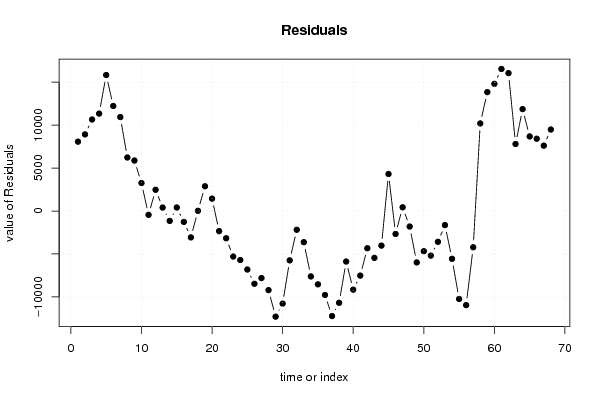
Multiple Linear Regression - Actuals, Interpolation, and Residuals
Time or IndexActualsInterpolationForecastResidualsPrediction Error
1269285261210.7244421548074.2755578462
2269829260907.4118463418921.58815365855
3270911260252.30364767210658.6963523285
4266844255502.04827166711341.9517283329
5271244255410.84512271415833.1548772859
6269907257680.23193128812226.7680687121
7271296260357.59800234010938.4019976596
8270157263924.2986549156232.70134508474
9271322265443.8130403555878.18695964458
10267179263919.7035934963259.29640650361
11264101264542.548870067-441.548870066871
12265518263043.0832019512474.91679804856
13269419269015.561700719403.438299280631
14268714269859.358551766-1145.35855176644
15272482272072.023970244409.976029755979
16268351269615.987487958-1264.98748795769
17268175271245.448509293-3070.44850929322
18270674270647.06170071926.9382992805758
19272764269883.0994311952880.90056880517
20272599271155.5811900521443.41880994835
21270333272675.095575492-2342.09557549180
22270846274018.759745780-3172.75974578036
23270491275788.71446921-5297.71446920987
24269160274862.803524524-5702.80352452396
25274027280835.282023292-6808.2820232919
26273784282252.633597768-8468.63359776845
27276663284465.299016246-7802.29901624605
28274525283729.926704248-9204.92670424827
29271344283638.723555295-12294.7235552953
30271115281893.227299862-10778.2272998624
31270798276540.827242902-5742.8272429017
32273911276092.64483147-2181.64483146998
33273985277612.15921691-3627.15921691013
34271917279529.378110628-7612.3781106282
35273338281872.887557487-8534.88755748723
36270601280373.421889372-9772.4218893718
37273547285772.34566471-12225.3456647102
38275363286042.587792328-10679.5877923277
39281229287108.143763946-5879.14376394631
40277793286946.326175378-9153.32617537805
41279913287428.677749855-7515.67774985453
42282500286830.290941281-4330.29094128075
43280041285492.773948327-5451.77394832664
44282166286191.700983754-4025.70098375394
45290304285990.5511989064313.44880109446
46283519286187.105922335-2668.10592233506
47287816287383.505922335432.494077664936
48285226287031.149701079-1805.14970107867
49287595293577.182923276-5982.18292327611
50289741294420.979774323-4679.97977432315
51289148294339.426299083-5191.4262990827
52288301291883.389816796-3582.38981679636
53290155291792.186667843-1637.18666784334
54289648295208.682923276-5560.68292327616
55288225298459.603717758-10234.6037177582
56289351300305.640200045-10954.6402000445
57294735298957.380968337-4222.38096833709
58305333295139.0526277610193.94737224
59309030295188.34318090113841.6568190990
60310215295409.54168307414805.4583169259
61321935305396.90324584916538.0967541514
62325734309682.02843747316051.9715625272
63320846313041.8033028097804.19669719057
64323023311159.32154395311863.6784560474
65319753311068.1183950008684.88160500044
66321753313337.5052035738415.49479642665
67320757313147.0976574787609.90234252172
68324479314993.1341397659485.86586023536

\begin{tabular}{lllllllll}
\hline
Multiple Linear Regression - Actuals, Interpolation, and Residuals \tabularnewline
Time or Index & Actuals & InterpolationForecast & ResidualsPrediction Error \tabularnewline
1 & 269285 & 261210.724442154 & 8074.2755578462 \tabularnewline
2 & 269829 & 260907.411846341 & 8921.58815365855 \tabularnewline
3 & 270911 & 260252.303647672 & 10658.6963523285 \tabularnewline
4 & 266844 & 255502.048271667 & 11341.9517283329 \tabularnewline
5 & 271244 & 255410.845122714 & 15833.1548772859 \tabularnewline
6 & 269907 & 257680.231931288 & 12226.7680687121 \tabularnewline
7 & 271296 & 260357.598002340 & 10938.4019976596 \tabularnewline
8 & 270157 & 263924.298654915 & 6232.70134508474 \tabularnewline
9 & 271322 & 265443.813040355 & 5878.18695964458 \tabularnewline
10 & 267179 & 263919.703593496 & 3259.29640650361 \tabularnewline
11 & 264101 & 264542.548870067 & -441.548870066871 \tabularnewline
12 & 265518 & 263043.083201951 & 2474.91679804856 \tabularnewline
13 & 269419 & 269015.561700719 & 403.438299280631 \tabularnewline
14 & 268714 & 269859.358551766 & -1145.35855176644 \tabularnewline
15 & 272482 & 272072.023970244 & 409.976029755979 \tabularnewline
16 & 268351 & 269615.987487958 & -1264.98748795769 \tabularnewline
17 & 268175 & 271245.448509293 & -3070.44850929322 \tabularnewline
18 & 270674 & 270647.061700719 & 26.9382992805758 \tabularnewline
19 & 272764 & 269883.099431195 & 2880.90056880517 \tabularnewline
20 & 272599 & 271155.581190052 & 1443.41880994835 \tabularnewline
21 & 270333 & 272675.095575492 & -2342.09557549180 \tabularnewline
22 & 270846 & 274018.759745780 & -3172.75974578036 \tabularnewline
23 & 270491 & 275788.71446921 & -5297.71446920987 \tabularnewline
24 & 269160 & 274862.803524524 & -5702.80352452396 \tabularnewline
25 & 274027 & 280835.282023292 & -6808.2820232919 \tabularnewline
26 & 273784 & 282252.633597768 & -8468.63359776845 \tabularnewline
27 & 276663 & 284465.299016246 & -7802.29901624605 \tabularnewline
28 & 274525 & 283729.926704248 & -9204.92670424827 \tabularnewline
29 & 271344 & 283638.723555295 & -12294.7235552953 \tabularnewline
30 & 271115 & 281893.227299862 & -10778.2272998624 \tabularnewline
31 & 270798 & 276540.827242902 & -5742.8272429017 \tabularnewline
32 & 273911 & 276092.64483147 & -2181.64483146998 \tabularnewline
33 & 273985 & 277612.15921691 & -3627.15921691013 \tabularnewline
34 & 271917 & 279529.378110628 & -7612.3781106282 \tabularnewline
35 & 273338 & 281872.887557487 & -8534.88755748723 \tabularnewline
36 & 270601 & 280373.421889372 & -9772.4218893718 \tabularnewline
37 & 273547 & 285772.34566471 & -12225.3456647102 \tabularnewline
38 & 275363 & 286042.587792328 & -10679.5877923277 \tabularnewline
39 & 281229 & 287108.143763946 & -5879.14376394631 \tabularnewline
40 & 277793 & 286946.326175378 & -9153.32617537805 \tabularnewline
41 & 279913 & 287428.677749855 & -7515.67774985453 \tabularnewline
42 & 282500 & 286830.290941281 & -4330.29094128075 \tabularnewline
43 & 280041 & 285492.773948327 & -5451.77394832664 \tabularnewline
44 & 282166 & 286191.700983754 & -4025.70098375394 \tabularnewline
45 & 290304 & 285990.551198906 & 4313.44880109446 \tabularnewline
46 & 283519 & 286187.105922335 & -2668.10592233506 \tabularnewline
47 & 287816 & 287383.505922335 & 432.494077664936 \tabularnewline
48 & 285226 & 287031.149701079 & -1805.14970107867 \tabularnewline
49 & 287595 & 293577.182923276 & -5982.18292327611 \tabularnewline
50 & 289741 & 294420.979774323 & -4679.97977432315 \tabularnewline
51 & 289148 & 294339.426299083 & -5191.4262990827 \tabularnewline
52 & 288301 & 291883.389816796 & -3582.38981679636 \tabularnewline
53 & 290155 & 291792.186667843 & -1637.18666784334 \tabularnewline
54 & 289648 & 295208.682923276 & -5560.68292327616 \tabularnewline
55 & 288225 & 298459.603717758 & -10234.6037177582 \tabularnewline
56 & 289351 & 300305.640200045 & -10954.6402000445 \tabularnewline
57 & 294735 & 298957.380968337 & -4222.38096833709 \tabularnewline
58 & 305333 & 295139.05262776 & 10193.94737224 \tabularnewline
59 & 309030 & 295188.343180901 & 13841.6568190990 \tabularnewline
60 & 310215 & 295409.541683074 & 14805.4583169259 \tabularnewline
61 & 321935 & 305396.903245849 & 16538.0967541514 \tabularnewline
62 & 325734 & 309682.028437473 & 16051.9715625272 \tabularnewline
63 & 320846 & 313041.803302809 & 7804.19669719057 \tabularnewline
64 & 323023 & 311159.321543953 & 11863.6784560474 \tabularnewline
65 & 319753 & 311068.118395000 & 8684.88160500044 \tabularnewline
66 & 321753 & 313337.505203573 & 8415.49479642665 \tabularnewline
67 & 320757 & 313147.097657478 & 7609.90234252172 \tabularnewline
68 & 324479 & 314993.134139765 & 9485.86586023536 \tabularnewline
\hline
\end{tabular}
%Source: https://freestatistics.org/blog/index.php?pk=58534&T=4

[TABLE]
[ROW][C]Multiple Linear Regression - Actuals, Interpolation, and Residuals[/C][/ROW]
[ROW][C]Time or Index[/C][C]Actuals[/C][C]InterpolationForecast[/C][C]ResidualsPrediction Error[/C][/ROW]
[ROW][C]1[/C][C]269285[/C][C]261210.724442154[/C][C]8074.2755578462[/C][/ROW]
[ROW][C]2[/C][C]269829[/C][C]260907.411846341[/C][C]8921.58815365855[/C][/ROW]
[ROW][C]3[/C][C]270911[/C][C]260252.303647672[/C][C]10658.6963523285[/C][/ROW]
[ROW][C]4[/C][C]266844[/C][C]255502.048271667[/C][C]11341.9517283329[/C][/ROW]
[ROW][C]5[/C][C]271244[/C][C]255410.845122714[/C][C]15833.1548772859[/C][/ROW]
[ROW][C]6[/C][C]269907[/C][C]257680.231931288[/C][C]12226.7680687121[/C][/ROW]
[ROW][C]7[/C][C]271296[/C][C]260357.598002340[/C][C]10938.4019976596[/C][/ROW]
[ROW][C]8[/C][C]270157[/C][C]263924.298654915[/C][C]6232.70134508474[/C][/ROW]
[ROW][C]9[/C][C]271322[/C][C]265443.813040355[/C][C]5878.18695964458[/C][/ROW]
[ROW][C]10[/C][C]267179[/C][C]263919.703593496[/C][C]3259.29640650361[/C][/ROW]
[ROW][C]11[/C][C]264101[/C][C]264542.548870067[/C][C]-441.548870066871[/C][/ROW]
[ROW][C]12[/C][C]265518[/C][C]263043.083201951[/C][C]2474.91679804856[/C][/ROW]
[ROW][C]13[/C][C]269419[/C][C]269015.561700719[/C][C]403.438299280631[/C][/ROW]
[ROW][C]14[/C][C]268714[/C][C]269859.358551766[/C][C]-1145.35855176644[/C][/ROW]
[ROW][C]15[/C][C]272482[/C][C]272072.023970244[/C][C]409.976029755979[/C][/ROW]
[ROW][C]16[/C][C]268351[/C][C]269615.987487958[/C][C]-1264.98748795769[/C][/ROW]
[ROW][C]17[/C][C]268175[/C][C]271245.448509293[/C][C]-3070.44850929322[/C][/ROW]
[ROW][C]18[/C][C]270674[/C][C]270647.061700719[/C][C]26.9382992805758[/C][/ROW]
[ROW][C]19[/C][C]272764[/C][C]269883.099431195[/C][C]2880.90056880517[/C][/ROW]
[ROW][C]20[/C][C]272599[/C][C]271155.581190052[/C][C]1443.41880994835[/C][/ROW]
[ROW][C]21[/C][C]270333[/C][C]272675.095575492[/C][C]-2342.09557549180[/C][/ROW]
[ROW][C]22[/C][C]270846[/C][C]274018.759745780[/C][C]-3172.75974578036[/C][/ROW]
[ROW][C]23[/C][C]270491[/C][C]275788.71446921[/C][C]-5297.71446920987[/C][/ROW]
[ROW][C]24[/C][C]269160[/C][C]274862.803524524[/C][C]-5702.80352452396[/C][/ROW]
[ROW][C]25[/C][C]274027[/C][C]280835.282023292[/C][C]-6808.2820232919[/C][/ROW]
[ROW][C]26[/C][C]273784[/C][C]282252.633597768[/C][C]-8468.63359776845[/C][/ROW]
[ROW][C]27[/C][C]276663[/C][C]284465.299016246[/C][C]-7802.29901624605[/C][/ROW]
[ROW][C]28[/C][C]274525[/C][C]283729.926704248[/C][C]-9204.92670424827[/C][/ROW]
[ROW][C]29[/C][C]271344[/C][C]283638.723555295[/C][C]-12294.7235552953[/C][/ROW]
[ROW][C]30[/C][C]271115[/C][C]281893.227299862[/C][C]-10778.2272998624[/C][/ROW]
[ROW][C]31[/C][C]270798[/C][C]276540.827242902[/C][C]-5742.8272429017[/C][/ROW]
[ROW][C]32[/C][C]273911[/C][C]276092.64483147[/C][C]-2181.64483146998[/C][/ROW]
[ROW][C]33[/C][C]273985[/C][C]277612.15921691[/C][C]-3627.15921691013[/C][/ROW]
[ROW][C]34[/C][C]271917[/C][C]279529.378110628[/C][C]-7612.3781106282[/C][/ROW]
[ROW][C]35[/C][C]273338[/C][C]281872.887557487[/C][C]-8534.88755748723[/C][/ROW]
[ROW][C]36[/C][C]270601[/C][C]280373.421889372[/C][C]-9772.4218893718[/C][/ROW]
[ROW][C]37[/C][C]273547[/C][C]285772.34566471[/C][C]-12225.3456647102[/C][/ROW]
[ROW][C]38[/C][C]275363[/C][C]286042.587792328[/C][C]-10679.5877923277[/C][/ROW]
[ROW][C]39[/C][C]281229[/C][C]287108.143763946[/C][C]-5879.14376394631[/C][/ROW]
[ROW][C]40[/C][C]277793[/C][C]286946.326175378[/C][C]-9153.32617537805[/C][/ROW]
[ROW][C]41[/C][C]279913[/C][C]287428.677749855[/C][C]-7515.67774985453[/C][/ROW]
[ROW][C]42[/C][C]282500[/C][C]286830.290941281[/C][C]-4330.29094128075[/C][/ROW]
[ROW][C]43[/C][C]280041[/C][C]285492.773948327[/C][C]-5451.77394832664[/C][/ROW]
[ROW][C]44[/C][C]282166[/C][C]286191.700983754[/C][C]-4025.70098375394[/C][/ROW]
[ROW][C]45[/C][C]290304[/C][C]285990.551198906[/C][C]4313.44880109446[/C][/ROW]
[ROW][C]46[/C][C]283519[/C][C]286187.105922335[/C][C]-2668.10592233506[/C][/ROW]
[ROW][C]47[/C][C]287816[/C][C]287383.505922335[/C][C]432.494077664936[/C][/ROW]
[ROW][C]48[/C][C]285226[/C][C]287031.149701079[/C][C]-1805.14970107867[/C][/ROW]
[ROW][C]49[/C][C]287595[/C][C]293577.182923276[/C][C]-5982.18292327611[/C][/ROW]
[ROW][C]50[/C][C]289741[/C][C]294420.979774323[/C][C]-4679.97977432315[/C][/ROW]
[ROW][C]51[/C][C]289148[/C][C]294339.426299083[/C][C]-5191.4262990827[/C][/ROW]
[ROW][C]52[/C][C]288301[/C][C]291883.389816796[/C][C]-3582.38981679636[/C][/ROW]
[ROW][C]53[/C][C]290155[/C][C]291792.186667843[/C][C]-1637.18666784334[/C][/ROW]
[ROW][C]54[/C][C]289648[/C][C]295208.682923276[/C][C]-5560.68292327616[/C][/ROW]
[ROW][C]55[/C][C]288225[/C][C]298459.603717758[/C][C]-10234.6037177582[/C][/ROW]
[ROW][C]56[/C][C]289351[/C][C]300305.640200045[/C][C]-10954.6402000445[/C][/ROW]
[ROW][C]57[/C][C]294735[/C][C]298957.380968337[/C][C]-4222.38096833709[/C][/ROW]
[ROW][C]58[/C][C]305333[/C][C]295139.05262776[/C][C]10193.94737224[/C][/ROW]
[ROW][C]59[/C][C]309030[/C][C]295188.343180901[/C][C]13841.6568190990[/C][/ROW]
[ROW][C]60[/C][C]310215[/C][C]295409.541683074[/C][C]14805.4583169259[/C][/ROW]
[ROW][C]61[/C][C]321935[/C][C]305396.903245849[/C][C]16538.0967541514[/C][/ROW]
[ROW][C]62[/C][C]325734[/C][C]309682.028437473[/C][C]16051.9715625272[/C][/ROW]
[ROW][C]63[/C][C]320846[/C][C]313041.803302809[/C][C]7804.19669719057[/C][/ROW]
[ROW][C]64[/C][C]323023[/C][C]311159.321543953[/C][C]11863.6784560474[/C][/ROW]
[ROW][C]65[/C][C]319753[/C][C]311068.118395000[/C][C]8684.88160500044[/C][/ROW]
[ROW][C]66[/C][C]321753[/C][C]313337.505203573[/C][C]8415.49479642665[/C][/ROW]
[ROW][C]67[/C][C]320757[/C][C]313147.097657478[/C][C]7609.90234252172[/C][/ROW]
[ROW][C]68[/C][C]324479[/C][C]314993.134139765[/C][C]9485.86586023536[/C][/ROW]
[/TABLE]
Source: https://freestatistics.org/blog/index.php?pk=58534&T=4

Globally Unique Identifier (entire table): ba.freestatistics.org/blog/index.php?pk=58534&T=4

As an alternative you can also use a QR Code:  

The GUIDs for individual cells are displayed in the table below:

Multiple Linear Regression - Actuals, Interpolation, and Residuals
Time or IndexActualsInterpolationForecastResidualsPrediction Error
1269285261210.7244421548074.2755578462
2269829260907.4118463418921.58815365855
3270911260252.30364767210658.6963523285
4266844255502.04827166711341.9517283329
5271244255410.84512271415833.1548772859
6269907257680.23193128812226.7680687121
7271296260357.59800234010938.4019976596
8270157263924.2986549156232.70134508474
9271322265443.8130403555878.18695964458
10267179263919.7035934963259.29640650361
11264101264542.548870067-441.548870066871
12265518263043.0832019512474.91679804856
13269419269015.561700719403.438299280631
14268714269859.358551766-1145.35855176644
15272482272072.023970244409.976029755979
16268351269615.987487958-1264.98748795769
17268175271245.448509293-3070.44850929322
18270674270647.06170071926.9382992805758
19272764269883.0994311952880.90056880517
20272599271155.5811900521443.41880994835
21270333272675.095575492-2342.09557549180
22270846274018.759745780-3172.75974578036
23270491275788.71446921-5297.71446920987
24269160274862.803524524-5702.80352452396
25274027280835.282023292-6808.2820232919
26273784282252.633597768-8468.63359776845
27276663284465.299016246-7802.29901624605
28274525283729.926704248-9204.92670424827
29271344283638.723555295-12294.7235552953
30271115281893.227299862-10778.2272998624
31270798276540.827242902-5742.8272429017
32273911276092.64483147-2181.64483146998
33273985277612.15921691-3627.15921691013
34271917279529.378110628-7612.3781106282
35273338281872.887557487-8534.88755748723
36270601280373.421889372-9772.4218893718
37273547285772.34566471-12225.3456647102
38275363286042.587792328-10679.5877923277
39281229287108.143763946-5879.14376394631
40277793286946.326175378-9153.32617537805
41279913287428.677749855-7515.67774985453
42282500286830.290941281-4330.29094128075
43280041285492.773948327-5451.77394832664
44282166286191.700983754-4025.70098375394
45290304285990.5511989064313.44880109446
46283519286187.105922335-2668.10592233506
47287816287383.505922335432.494077664936
48285226287031.149701079-1805.14970107867
49287595293577.182923276-5982.18292327611
50289741294420.979774323-4679.97977432315
51289148294339.426299083-5191.4262990827
52288301291883.389816796-3582.38981679636
53290155291792.186667843-1637.18666784334
54289648295208.682923276-5560.68292327616
55288225298459.603717758-10234.6037177582
56289351300305.640200045-10954.6402000445
57294735298957.380968337-4222.38096833709
58305333295139.0526277610193.94737224
59309030295188.34318090113841.6568190990
60310215295409.54168307414805.4583169259
61321935305396.90324584916538.0967541514
62325734309682.02843747316051.9715625272
63320846313041.8033028097804.19669719057
64323023311159.32154395311863.6784560474
65319753311068.1183950008684.88160500044
66321753313337.5052035738415.49479642665
67320757313147.0976574787609.90234252172
68324479314993.1341397659485.86586023536


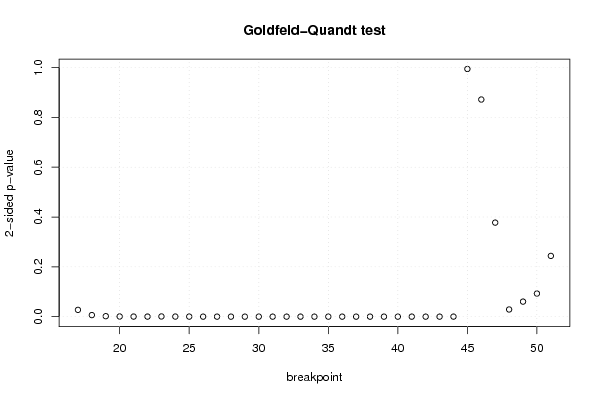
Goldfeld-Quandt test for Heteroskedasticity
p-valuesAlternative Hypothesis
breakpoint indexgreater2-sidedless
170.01361270428415860.02722540856831720.986387295715841
180.003148426780821650.00629685356164330.996851573219178
190.0009265535397369210.001853107079473840.999073446460263
200.000323159192375470.000646318384750940.999676840807625
210.0001344998537893800.0002689997075787590.99986550014621
220.0001079409429868320.0002158818859736640.999892059057013
230.0003887416410427120.0007774832820854230.999611258358957
240.0001682688082502720.0003365376165005440.99983173119175
257.98350298557177e-050.0001596700597114350.999920164970144
263.0192511435412e-056.0385022870824e-050.999969807488565
271.29134604938512e-052.58269209877024e-050.999987086539506
288.66212765085053e-061.73242553017011e-050.999991337872349
293.65358385010062e-067.30716770020125e-060.99999634641615
301.74393837761806e-063.48787675523612e-060.999998256061622
312.27324846482756e-064.54649692965513e-060.999997726751535
324.13727261753147e-068.27454523506293e-060.999995862727382
332.77690728167555e-065.5538145633511e-060.999997223092718
348.81442547307764e-071.76288509461553e-060.999999118557453
356.8750161209482e-071.37500322418964e-060.999999312498388
362.18355626330723e-074.36711252661446e-070.999999781644374
378.26575429268427e-081.65315085853685e-070.999999917342457
382.78229728818504e-085.56459457637008e-080.999999972177027
393.98039941130153e-087.96079882260305e-080.999999960196006
402.89059402668932e-085.78118805337863e-080.99999997109406
414.6528532325386e-089.3057064650772e-080.999999953471468
424.17072541309245e-078.3414508261849e-070.999999582927459
431.13542918955451e-062.27085837910902e-060.99999886457081
443.41279194283345e-056.8255838856669e-050.999965872080572
450.5026614491668270.9946771016663460.497338550833173
460.5640458364424720.8719083271150570.435954163557528
470.8112007668538010.3775984662923980.188799233146199
480.9856066327875310.02878673442493690.0143933672124685
490.9697948297653850.06041034046922960.0302051702346148
500.9536151499682630.09276970006347340.0463848500317367
510.8780209191858460.2439581616283090.121979080814154

\begin{tabular}{lllllllll}
\hline
Goldfeld-Quandt test for Heteroskedasticity \tabularnewline
p-values & Alternative Hypothesis \tabularnewline
breakpoint index & greater & 2-sided & less \tabularnewline
17 & 0.0136127042841586 & 0.0272254085683172 & 0.986387295715841 \tabularnewline
18 & 0.00314842678082165 & 0.0062968535616433 & 0.996851573219178 \tabularnewline
19 & 0.000926553539736921 & 0.00185310707947384 & 0.999073446460263 \tabularnewline
20 & 0.00032315919237547 & 0.00064631838475094 & 0.999676840807625 \tabularnewline
21 & 0.000134499853789380 & 0.000268999707578759 & 0.99986550014621 \tabularnewline
22 & 0.000107940942986832 & 0.000215881885973664 & 0.999892059057013 \tabularnewline
23 & 0.000388741641042712 & 0.000777483282085423 & 0.999611258358957 \tabularnewline
24 & 0.000168268808250272 & 0.000336537616500544 & 0.99983173119175 \tabularnewline
25 & 7.98350298557177e-05 & 0.000159670059711435 & 0.999920164970144 \tabularnewline
26 & 3.0192511435412e-05 & 6.0385022870824e-05 & 0.999969807488565 \tabularnewline
27 & 1.29134604938512e-05 & 2.58269209877024e-05 & 0.999987086539506 \tabularnewline
28 & 8.66212765085053e-06 & 1.73242553017011e-05 & 0.999991337872349 \tabularnewline
29 & 3.65358385010062e-06 & 7.30716770020125e-06 & 0.99999634641615 \tabularnewline
30 & 1.74393837761806e-06 & 3.48787675523612e-06 & 0.999998256061622 \tabularnewline
31 & 2.27324846482756e-06 & 4.54649692965513e-06 & 0.999997726751535 \tabularnewline
32 & 4.13727261753147e-06 & 8.27454523506293e-06 & 0.999995862727382 \tabularnewline
33 & 2.77690728167555e-06 & 5.5538145633511e-06 & 0.999997223092718 \tabularnewline
34 & 8.81442547307764e-07 & 1.76288509461553e-06 & 0.999999118557453 \tabularnewline
35 & 6.8750161209482e-07 & 1.37500322418964e-06 & 0.999999312498388 \tabularnewline
36 & 2.18355626330723e-07 & 4.36711252661446e-07 & 0.999999781644374 \tabularnewline
37 & 8.26575429268427e-08 & 1.65315085853685e-07 & 0.999999917342457 \tabularnewline
38 & 2.78229728818504e-08 & 5.56459457637008e-08 & 0.999999972177027 \tabularnewline
39 & 3.98039941130153e-08 & 7.96079882260305e-08 & 0.999999960196006 \tabularnewline
40 & 2.89059402668932e-08 & 5.78118805337863e-08 & 0.99999997109406 \tabularnewline
41 & 4.6528532325386e-08 & 9.3057064650772e-08 & 0.999999953471468 \tabularnewline
42 & 4.17072541309245e-07 & 8.3414508261849e-07 & 0.999999582927459 \tabularnewline
43 & 1.13542918955451e-06 & 2.27085837910902e-06 & 0.99999886457081 \tabularnewline
44 & 3.41279194283345e-05 & 6.8255838856669e-05 & 0.999965872080572 \tabularnewline
45 & 0.502661449166827 & 0.994677101666346 & 0.497338550833173 \tabularnewline
46 & 0.564045836442472 & 0.871908327115057 & 0.435954163557528 \tabularnewline
47 & 0.811200766853801 & 0.377598466292398 & 0.188799233146199 \tabularnewline
48 & 0.985606632787531 & 0.0287867344249369 & 0.0143933672124685 \tabularnewline
49 & 0.969794829765385 & 0.0604103404692296 & 0.0302051702346148 \tabularnewline
50 & 0.953615149968263 & 0.0927697000634734 & 0.0463848500317367 \tabularnewline
51 & 0.878020919185846 & 0.243958161628309 & 0.121979080814154 \tabularnewline
\hline
\end{tabular}
%Source: https://freestatistics.org/blog/index.php?pk=58534&T=5

[TABLE]
[ROW][C]Goldfeld-Quandt test for Heteroskedasticity[/C][/ROW]
[ROW][C]p-values[/C][C]Alternative Hypothesis[/C][/ROW]
[ROW][C]breakpoint index[/C][C]greater[/C][C]2-sided[/C][C]less[/C][/ROW]
[ROW][C]17[/C][C]0.0136127042841586[/C][C]0.0272254085683172[/C][C]0.986387295715841[/C][/ROW]
[ROW][C]18[/C][C]0.00314842678082165[/C][C]0.0062968535616433[/C][C]0.996851573219178[/C][/ROW]
[ROW][C]19[/C][C]0.000926553539736921[/C][C]0.00185310707947384[/C][C]0.999073446460263[/C][/ROW]
[ROW][C]20[/C][C]0.00032315919237547[/C][C]0.00064631838475094[/C][C]0.999676840807625[/C][/ROW]
[ROW][C]21[/C][C]0.000134499853789380[/C][C]0.000268999707578759[/C][C]0.99986550014621[/C][/ROW]
[ROW][C]22[/C][C]0.000107940942986832[/C][C]0.000215881885973664[/C][C]0.999892059057013[/C][/ROW]
[ROW][C]23[/C][C]0.000388741641042712[/C][C]0.000777483282085423[/C][C]0.999611258358957[/C][/ROW]
[ROW][C]24[/C][C]0.000168268808250272[/C][C]0.000336537616500544[/C][C]0.99983173119175[/C][/ROW]
[ROW][C]25[/C][C]7.98350298557177e-05[/C][C]0.000159670059711435[/C][C]0.999920164970144[/C][/ROW]
[ROW][C]26[/C][C]3.0192511435412e-05[/C][C]6.0385022870824e-05[/C][C]0.999969807488565[/C][/ROW]
[ROW][C]27[/C][C]1.29134604938512e-05[/C][C]2.58269209877024e-05[/C][C]0.999987086539506[/C][/ROW]
[ROW][C]28[/C][C]8.66212765085053e-06[/C][C]1.73242553017011e-05[/C][C]0.999991337872349[/C][/ROW]
[ROW][C]29[/C][C]3.65358385010062e-06[/C][C]7.30716770020125e-06[/C][C]0.99999634641615[/C][/ROW]
[ROW][C]30[/C][C]1.74393837761806e-06[/C][C]3.48787675523612e-06[/C][C]0.999998256061622[/C][/ROW]
[ROW][C]31[/C][C]2.27324846482756e-06[/C][C]4.54649692965513e-06[/C][C]0.999997726751535[/C][/ROW]
[ROW][C]32[/C][C]4.13727261753147e-06[/C][C]8.27454523506293e-06[/C][C]0.999995862727382[/C][/ROW]
[ROW][C]33[/C][C]2.77690728167555e-06[/C][C]5.5538145633511e-06[/C][C]0.999997223092718[/C][/ROW]
[ROW][C]34[/C][C]8.81442547307764e-07[/C][C]1.76288509461553e-06[/C][C]0.999999118557453[/C][/ROW]
[ROW][C]35[/C][C]6.8750161209482e-07[/C][C]1.37500322418964e-06[/C][C]0.999999312498388[/C][/ROW]
[ROW][C]36[/C][C]2.18355626330723e-07[/C][C]4.36711252661446e-07[/C][C]0.999999781644374[/C][/ROW]
[ROW][C]37[/C][C]8.26575429268427e-08[/C][C]1.65315085853685e-07[/C][C]0.999999917342457[/C][/ROW]
[ROW][C]38[/C][C]2.78229728818504e-08[/C][C]5.56459457637008e-08[/C][C]0.999999972177027[/C][/ROW]
[ROW][C]39[/C][C]3.98039941130153e-08[/C][C]7.96079882260305e-08[/C][C]0.999999960196006[/C][/ROW]
[ROW][C]40[/C][C]2.89059402668932e-08[/C][C]5.78118805337863e-08[/C][C]0.99999997109406[/C][/ROW]
[ROW][C]41[/C][C]4.6528532325386e-08[/C][C]9.3057064650772e-08[/C][C]0.999999953471468[/C][/ROW]
[ROW][C]42[/C][C]4.17072541309245e-07[/C][C]8.3414508261849e-07[/C][C]0.999999582927459[/C][/ROW]
[ROW][C]43[/C][C]1.13542918955451e-06[/C][C]2.27085837910902e-06[/C][C]0.99999886457081[/C][/ROW]
[ROW][C]44[/C][C]3.41279194283345e-05[/C][C]6.8255838856669e-05[/C][C]0.999965872080572[/C][/ROW]
[ROW][C]45[/C][C]0.502661449166827[/C][C]0.994677101666346[/C][C]0.497338550833173[/C][/ROW]
[ROW][C]46[/C][C]0.564045836442472[/C][C]0.871908327115057[/C][C]0.435954163557528[/C][/ROW]
[ROW][C]47[/C][C]0.811200766853801[/C][C]0.377598466292398[/C][C]0.188799233146199[/C][/ROW]
[ROW][C]48[/C][C]0.985606632787531[/C][C]0.0287867344249369[/C][C]0.0143933672124685[/C][/ROW]
[ROW][C]49[/C][C]0.969794829765385[/C][C]0.0604103404692296[/C][C]0.0302051702346148[/C][/ROW]
[ROW][C]50[/C][C]0.953615149968263[/C][C]0.0927697000634734[/C][C]0.0463848500317367[/C][/ROW]
[ROW][C]51[/C][C]0.878020919185846[/C][C]0.243958161628309[/C][C]0.121979080814154[/C][/ROW]
[/TABLE]
Source: https://freestatistics.org/blog/index.php?pk=58534&T=5

Globally Unique Identifier (entire table): ba.freestatistics.org/blog/index.php?pk=58534&T=5

As an alternative you can also use a QR Code:  

The GUIDs for individual cells are displayed in the table below:

Goldfeld-Quandt test for Heteroskedasticity
p-valuesAlternative Hypothesis
breakpoint indexgreater2-sidedless
170.01361270428415860.02722540856831720.986387295715841
180.003148426780821650.00629685356164330.996851573219178
190.0009265535397369210.001853107079473840.999073446460263
200.000323159192375470.000646318384750940.999676840807625
210.0001344998537893800.0002689997075787590.99986550014621
220.0001079409429868320.0002158818859736640.999892059057013
230.0003887416410427120.0007774832820854230.999611258358957
240.0001682688082502720.0003365376165005440.99983173119175
257.98350298557177e-050.0001596700597114350.999920164970144
263.0192511435412e-056.0385022870824e-050.999969807488565
271.29134604938512e-052.58269209877024e-050.999987086539506
288.66212765085053e-061.73242553017011e-050.999991337872349
293.65358385010062e-067.30716770020125e-060.99999634641615
301.74393837761806e-063.48787675523612e-060.999998256061622
312.27324846482756e-064.54649692965513e-060.999997726751535
324.13727261753147e-068.27454523506293e-060.999995862727382
332.77690728167555e-065.5538145633511e-060.999997223092718
348.81442547307764e-071.76288509461553e-060.999999118557453
356.8750161209482e-071.37500322418964e-060.999999312498388
362.18355626330723e-074.36711252661446e-070.999999781644374
378.26575429268427e-081.65315085853685e-070.999999917342457
382.78229728818504e-085.56459457637008e-080.999999972177027
393.98039941130153e-087.96079882260305e-080.999999960196006
402.89059402668932e-085.78118805337863e-080.99999997109406
414.6528532325386e-089.3057064650772e-080.999999953471468
424.17072541309245e-078.3414508261849e-070.999999582927459
431.13542918955451e-062.27085837910902e-060.99999886457081
443.41279194283345e-056.8255838856669e-050.999965872080572
450.5026614491668270.9946771016663460.497338550833173
460.5640458364424720.8719083271150570.435954163557528
470.8112007668538010.3775984662923980.188799233146199
480.9856066327875310.02878673442493690.0143933672124685
490.9697948297653850.06041034046922960.0302051702346148
500.9536151499682630.09276970006347340.0463848500317367
510.8780209191858460.2439581616283090.121979080814154


Meta Analysis of Goldfeld-Quandt test for Heteroskedasticity
Description# significant tests% significant testsOK/NOK
1% type I error level270.771428571428571NOK
5% type I error level290.828571428571429NOK
10% type I error level310.885714285714286NOK

\begin{tabular}{lllllllll}
\hline
Meta Analysis of Goldfeld-Quandt test for Heteroskedasticity \tabularnewline
Description & # significant tests & % significant tests & OK/NOK \tabularnewline
1% type I error level & 27 & 0.771428571428571 & NOK \tabularnewline
5% type I error level & 29 & 0.828571428571429 & NOK \tabularnewline
10% type I error level & 31 & 0.885714285714286 & NOK \tabularnewline
\hline
\end{tabular}
%Source: https://freestatistics.org/blog/index.php?pk=58534&T=6

[TABLE]
[ROW][C]Meta Analysis of Goldfeld-Quandt test for Heteroskedasticity[/C][/ROW]
[ROW][C]Description[/C][C]# significant tests[/C][C]% significant tests[/C][C]OK/NOK[/C][/ROW]
[ROW][C]1% type I error level[/C][C]27[/C][C]0.771428571428571[/C][C]NOK[/C][/ROW]
[ROW][C]5% type I error level[/C][C]29[/C][C]0.828571428571429[/C][C]NOK[/C][/ROW]
[ROW][C]10% type I error level[/C][C]31[/C][C]0.885714285714286[/C][C]NOK[/C][/ROW]
[/TABLE]
Source: https://freestatistics.org/blog/index.php?pk=58534&T=6

Globally Unique Identifier (entire table): ba.freestatistics.org/blog/index.php?pk=58534&T=6

As an alternative you can also use a QR Code:  

The GUIDs for individual cells are displayed in the table below:

Meta Analysis of Goldfeld-Quandt test for Heteroskedasticity
Description# significant tests% significant testsOK/NOK
1% type I error level270.771428571428571NOK
5% type I error level290.828571428571429NOK
10% type I error level310.885714285714286NOK


Parameters (Session):
par1 = 1 ; par2 = Include Monthly Dummies ; par3 = Linear Trend ;
Parameters (R input):
par1 = 1 ; par2 = Include Monthly Dummies ; par3 = Linear Trend ;
R code (references can be found in the software module):
library(lattice)
library(lmtest)
n25 <- 25 #minimum number of obs. for Goldfeld-Quandt test
par1 <- as.numeric(par1)
x <- t(y)
k <- length(x[1,])
n <- length(x[,1])
x1 <- cbind(x[,par1], x[,1:k!=par1])
mycolnames <- c(colnames(x)[par1], colnames(x)[1:k!=par1])
colnames(x1) <- mycolnames #colnames(x)[par1]
x <- x1
if (par3 == 'First Differences'){
x2 <- array(0, dim=c(n-1,k), dimnames=list(1:(n-1), paste('(1-B)',colnames(x),sep='')))
for (i in 1:n-1) {
for (j in 1:k) {
x2[i,j] <- x[i+1,j] - x[i,j]
}
}
x <- x2
}
if (par2 == 'Include Monthly Dummies'){
x2 <- array(0, dim=c(n,11), dimnames=list(1:n, paste('M', seq(1:11), sep ='')))
for (i in 1:11){
x2[seq(i,n,12),i] <- 1
}
x <- cbind(x, x2)
}
if (par2 == 'Include Quarterly Dummies'){
x2 <- array(0, dim=c(n,3), dimnames=list(1:n, paste('Q', seq(1:3), sep ='')))
for (i in 1:3){
x2[seq(i,n,4),i] <- 1
}
x <- cbind(x, x2)
}
k <- length(x[1,])
if (par3 == 'Linear Trend'){
x <- cbind(x, c(1:n))
colnames(x)[k+1] <- 't'
}
x
k <- length(x[1,])
df <- as.data.frame(x)
(mylm <- lm(df))
(mysum <- summary(mylm))
if (n > n25) {
kp3 <- k + 3
nmkm3 <- n - k - 3
gqarr <- array(NA, dim=c(nmkm3-kp3+1,3))
numgqtests <- 0
numsignificant1 <- 0
numsignificant5 <- 0
numsignificant10 <- 0
for (mypoint in kp3:nmkm3) {
j <- 0
numgqtests <- numgqtests + 1
for (myalt in c('greater', 'two.sided', 'less')) {
j <- j + 1
gqarr[mypoint-kp3+1,j] <- gqtest(mylm, point=mypoint, alternative=myalt)$p.value
}
if (gqarr[mypoint-kp3+1,2] < 0.01) numsignificant1 <- numsignificant1 + 1
if (gqarr[mypoint-kp3+1,2] < 0.05) numsignificant5 <- numsignificant5 + 1
if (gqarr[mypoint-kp3+1,2] < 0.10) numsignificant10 <- numsignificant10 + 1
}
gqarr
}
bitmap(file='test0.png')
plot(x[,1], type='l', main='Actuals and Interpolation', ylab='value of Actuals and Interpolation (dots)', xlab='time or index')
points(x[,1]-mysum$resid)
grid()
dev.off()
bitmap(file='test1.png')
plot(mysum$resid, type='b', pch=19, main='Residuals', ylab='value of Residuals', xlab='time or index')
grid()
dev.off()
bitmap(file='test2.png')
hist(mysum$resid, main='Residual Histogram', xlab='values of Residuals')
grid()
dev.off()
bitmap(file='test3.png')
densityplot(~mysum$resid,col='black',main='Residual Density Plot', xlab='values of Residuals')
dev.off()
bitmap(file='test4.png')
qqnorm(mysum$resid, main='Residual Normal Q-Q Plot')
qqline(mysum$resid)
grid()
dev.off()
(myerror <- as.ts(mysum$resid))
bitmap(file='test5.png')
dum <- cbind(lag(myerror,k=1),myerror)
dum
dum1 <- dum[2:length(myerror),]
dum1
z <- as.data.frame(dum1)
z
plot(z,main=paste('Residual Lag plot, lowess, and regression line'), ylab='values of Residuals', xlab='lagged values of Residuals')
lines(lowess(z))
abline(lm(z))
grid()
dev.off()
bitmap(file='test6.png')
acf(mysum$resid, lag.max=length(mysum$resid)/2, main='Residual Autocorrelation Function')
grid()
dev.off()
bitmap(file='test7.png')
pacf(mysum$resid, lag.max=length(mysum$resid)/2, main='Residual Partial Autocorrelation Function')
grid()
dev.off()
bitmap(file='test8.png')
opar <- par(mfrow = c(2,2), oma = c(0, 0, 1.1, 0))
plot(mylm, las = 1, sub='Residual Diagnostics')
par(opar)
dev.off()
if (n > n25) {
bitmap(file='test9.png')
plot(kp3:nmkm3,gqarr[,2], main='Goldfeld-Quandt test',ylab='2-sided p-value',xlab='breakpoint')
grid()
dev.off()
}
load(file='createtable')
a<-table.start()
a<-table.row.start(a)
a<-table.element(a, 'Multiple Linear Regression - Estimated Regression Equation', 1, TRUE)
a<-table.row.end(a)
myeq <- colnames(x)[1]
myeq <- paste(myeq, '[t] = ', sep='')
for (i in 1:k){
if (mysum$coefficients[i,1] > 0) myeq <- paste(myeq, '+', '')
myeq <- paste(myeq, mysum$coefficients[i,1], sep=' ')
if (rownames(mysum$coefficients)[i] != '(Intercept)') {
myeq <- paste(myeq, rownames(mysum$coefficients)[i], sep='')
if (rownames(mysum$coefficients)[i] != 't') myeq <- paste(myeq, '[t]', sep='')
}
}
myeq <- paste(myeq, ' + e[t]')
a<-table.row.start(a)
a<-table.element(a, myeq)
a<-table.row.end(a)
a<-table.end(a)
table.save(a,file='mytable1.tab')
a<-table.start()
a<-table.row.start(a)
a<-table.element(a,hyperlink('ols1.htm','Multiple Linear Regression - Ordinary Least Squares',''), 6, TRUE)
a<-table.row.end(a)
a<-table.row.start(a)
a<-table.element(a,'Variable',header=TRUE)
a<-table.element(a,'Parameter',header=TRUE)
a<-table.element(a,'S.D.',header=TRUE)
a<-table.element(a,'T-STAT
H0: parameter = 0',header=TRUE)
a<-table.element(a,'2-tail p-value',header=TRUE)
a<-table.element(a,'1-tail p-value',header=TRUE)
a<-table.row.end(a)
for (i in 1:k){
a<-table.row.start(a)
a<-table.element(a,rownames(mysum$coefficients)[i],header=TRUE)
a<-table.element(a,mysum$coefficients[i,1])
a<-table.element(a, round(mysum$coefficients[i,2],6))
a<-table.element(a, round(mysum$coefficients[i,3],4))
a<-table.element(a, round(mysum$coefficients[i,4],6))
a<-table.element(a, round(mysum$coefficients[i,4]/2,6))
a<-table.row.end(a)
}
a<-table.end(a)
table.save(a,file='mytable2.tab')
a<-table.start()
a<-table.row.start(a)
a<-table.element(a, 'Multiple Linear Regression - Regression Statistics', 2, TRUE)
a<-table.row.end(a)
a<-table.row.start(a)
a<-table.element(a, 'Multiple R',1,TRUE)
a<-table.element(a, sqrt(mysum$r.squared))
a<-table.row.end(a)
a<-table.row.start(a)
a<-table.element(a, 'R-squared',1,TRUE)
a<-table.element(a, mysum$r.squared)
a<-table.row.end(a)
a<-table.row.start(a)
a<-table.element(a, 'Adjusted R-squared',1,TRUE)
a<-table.element(a, mysum$adj.r.squared)
a<-table.row.end(a)
a<-table.row.start(a)
a<-table.element(a, 'F-TEST (value)',1,TRUE)
a<-table.element(a, mysum$fstatistic[1])
a<-table.row.end(a)
a<-table.row.start(a)
a<-table.element(a, 'F-TEST (DF numerator)',1,TRUE)
a<-table.element(a, mysum$fstatistic[2])
a<-table.row.end(a)
a<-table.row.start(a)
a<-table.element(a, 'F-TEST (DF denominator)',1,TRUE)
a<-table.element(a, mysum$fstatistic[3])
a<-table.row.end(a)
a<-table.row.start(a)
a<-table.element(a, 'p-value',1,TRUE)
a<-table.element(a, 1-pf(mysum$fstatistic[1],mysum$fstatistic[2],mysum$fstatistic[3]))
a<-table.row.end(a)
a<-table.row.start(a)
a<-table.element(a, 'Multiple Linear Regression - Residual Statistics', 2, TRUE)
a<-table.row.end(a)
a<-table.row.start(a)
a<-table.element(a, 'Residual Standard Deviation',1,TRUE)
a<-table.element(a, mysum$sigma)
a<-table.row.end(a)
a<-table.row.start(a)
a<-table.element(a, 'Sum Squared Residuals',1,TRUE)
a<-table.element(a, sum(myerror*myerror))
a<-table.row.end(a)
a<-table.end(a)
table.save(a,file='mytable3.tab')
a<-table.start()
a<-table.row.start(a)
a<-table.element(a, 'Multiple Linear Regression - Actuals, Interpolation, and Residuals', 4, TRUE)
a<-table.row.end(a)
a<-table.row.start(a)
a<-table.element(a, 'Time or Index', 1, TRUE)
a<-table.element(a, 'Actuals', 1, TRUE)
a<-table.element(a, 'Interpolation
Forecast', 1, TRUE)
a<-table.element(a, 'Residuals
Prediction Error', 1, TRUE)
a<-table.row.end(a)
for (i in 1:n) {
a<-table.row.start(a)
a<-table.element(a,i, 1, TRUE)
a<-table.element(a,x[i])
a<-table.element(a,x[i]-mysum$resid[i])
a<-table.element(a,mysum$resid[i])
a<-table.row.end(a)
}
a<-table.end(a)
table.save(a,file='mytable4.tab')
if (n > n25) {
a<-table.start()
a<-table.row.start(a)
a<-table.element(a,'Goldfeld-Quandt test for Heteroskedasticity',4,TRUE)
a<-table.row.end(a)
a<-table.row.start(a)
a<-table.element(a,'p-values',header=TRUE)
a<-table.element(a,'Alternative Hypothesis',3,header=TRUE)
a<-table.row.end(a)
a<-table.row.start(a)
a<-table.element(a,'breakpoint index',header=TRUE)
a<-table.element(a,'greater',header=TRUE)
a<-table.element(a,'2-sided',header=TRUE)
a<-table.element(a,'less',header=TRUE)
a<-table.row.end(a)
for (mypoint in kp3:nmkm3) {
a<-table.row.start(a)
a<-table.element(a,mypoint,header=TRUE)
a<-table.element(a,gqarr[mypoint-kp3+1,1])
a<-table.element(a,gqarr[mypoint-kp3+1,2])
a<-table.element(a,gqarr[mypoint-kp3+1,3])
a<-table.row.end(a)
}
a<-table.end(a)
table.save(a,file='mytable5.tab')
a<-table.start()
a<-table.row.start(a)
a<-table.element(a,'Meta Analysis of Goldfeld-Quandt test for Heteroskedasticity',4,TRUE)
a<-table.row.end(a)
a<-table.row.start(a)
a<-table.element(a,'Description',header=TRUE)
a<-table.element(a,'# significant tests',header=TRUE)
a<-table.element(a,'% significant tests',header=TRUE)
a<-table.element(a,'OK/NOK',header=TRUE)
a<-table.row.end(a)
a<-table.row.start(a)
a<-table.element(a,'1% type I error level',header=TRUE)
a<-table.element(a,numsignificant1)
a<-table.element(a,numsignificant1/numgqtests)
if (numsignificant1/numgqtests < 0.01) dum <- 'OK' else dum <- 'NOK'
a<-table.element(a,dum)
a<-table.row.end(a)
a<-table.row.start(a)
a<-table.element(a,'5% type I error level',header=TRUE)
a<-table.element(a,numsignificant5)
a<-table.element(a,numsignificant5/numgqtests)
if (numsignificant5/numgqtests < 0.05) dum <- 'OK' else dum <- 'NOK'
a<-table.element(a,dum)
a<-table.row.end(a)
a<-table.row.start(a)
a<-table.element(a,'10% type I error level',header=TRUE)
a<-table.element(a,numsignificant10)
a<-table.element(a,numsignificant10/numgqtests)
if (numsignificant10/numgqtests < 0.1) dum <- 'OK' else dum <- 'NOK'
a<-table.element(a,dum)
a<-table.row.end(a)
a<-table.end(a)
table.save(a,file='mytable6.tab')
}