Free Statistics

of Irreproducible Research!

Author's title

Author*The author of this computation has been verified*
R Software Modulerwasp_multipleregression.wasp
Title produced by softwareMultiple Regression
Date of computationSat, 21 Nov 2009 07:50:48 -0700
Cite this page as followsStatistical Computations at FreeStatistics.org, Office for Research Development and Education, URL https://freestatistics.org/blog/index.php?v=date/2009/Nov/21/t12588152259lfvupxtn5ewytq.htm/, Retrieved Sat, 27 Apr 2024 19:48:32 +0000
Statistical Computations at FreeStatistics.org, Office for Research Development and Education, URL https://freestatistics.org/blog/index.php?pk=58558, Retrieved Sat, 27 Apr 2024 19:48:32 +0000
QR Codes:

Original text written by user:
IsPrivate?No (this computation is public)
User-defined keywordsws7m1.1
Estimated Impact158
Family? (F = Feedback message, R = changed R code, M = changed R Module, P = changed Parameters, D = changed Data)
-     [Multiple Regression] [Q1 The Seatbeltlaw] [2007-11-14 19:27:43] [8cd6641b921d30ebe00b648d1481bba0]
- RMPD  [Multiple Regression] [Seatbelt] [2009-11-12 13:54:52] [b98453cac15ba1066b407e146608df68]
-    D      [Multiple Regression] [] [2009-11-21 14:50:48] [9ea4b07b6662a0f40f92decdf1e3b5d5] [Current]
Feedback Forum

Post a new message
Dataseries X:
2756,76	0,86
2849,27	0,88
2921,44	0,88
2981,85	0,88
3080,58	0,87
3106,22	0,88
3119,31	0,87
3061,26	0,85
3097,31	0,84
3161,69	0,83
3257,16	0,86
3277,01	0,87
3295,32	0,85
3363,99	0,89
3494,17	0,98
3667,03	1,01
3813,06	1
3917,96	1,01
3895,51	1,05
3801,06	1
3570,12	0,99
3701,61	1,02
3862,27	1,11
3970,1	1,15
4138,52	1,18
4199,75	1,2
4290,89	1,22
4443,91	1,2
4502,64	1,23
4356,98	1,23
4591,27	1,21
4696,96	1,25
4621,4	1,2
4562,84	1,2
4202,52	1,21
4296,49	1,25
4435,23	1,23
4105,18	1,2
4116,68	1,18
3844,49	1,16
3720,98	1,12
3674,4	1,11
3857,62	1,1
3801,06	1,08
3504,37	1,01
3032,6	1,01
3047,03	0,99
2962,34	1,07
2197,82	1,13
2014,45	1,09
1862,83	0,95
1905,41	0,79
1810,99	0,73
1670,07	0,7
1864,44	0,65
2052,02	0,61
2029,6	0,53
2070,83	0,51
2293,41	0,41
2443,27	0,42


Summary of computational transaction
Raw Inputview raw input (R code)
Raw Outputview raw output of R engine
Computing time4 seconds
R Server'Gwilym Jenkins' @ 72.249.127.135
R Framework error message
The field 'Names of X columns' contains a hard return which cannot be interpreted.
Please, resubmit your request without hard returns in the 'Names of X columns'.

\begin{tabular}{lllllllll}
\hline
Summary of computational transaction \tabularnewline
Raw Input & view raw input (R code)  \tabularnewline
Raw Output & view raw output of R engine  \tabularnewline
Computing time & 4 seconds \tabularnewline
R Server & 'Gwilym Jenkins' @ 72.249.127.135 \tabularnewline
R Framework error message & 
The field 'Names of X columns' contains a hard return which cannot be interpreted.
Please, resubmit your request without hard returns in the 'Names of X columns'.
\tabularnewline \hline \end{tabular} %Source: https://freestatistics.org/blog/index.php?pk=58558&T=0

[TABLE]
[ROW][C]Summary of computational transaction[/C][/ROW]
[ROW][C]Raw Input[/C][C]view raw input (R code) [/C][/ROW]
[ROW][C]Raw Output[/C][C]view raw output of R engine [/C][/ROW]
[ROW][C]Computing time[/C][C]4 seconds[/C][/ROW]
[ROW][C]R Server[/C][C]'Gwilym Jenkins' @ 72.249.127.135[/C][/ROW]
[ROW][C]R Framework error message[/C][C]
The field 'Names of X columns' contains a hard return which cannot be interpreted.
Please, resubmit your request without hard returns in the 'Names of X columns'.
[/C][/ROW] [/TABLE] Source: https://freestatistics.org/blog/index.php?pk=58558&T=0

Globally Unique Identifier (entire table): ba.freestatistics.org/blog/index.php?pk=58558&T=0

As an alternative you can also use a QR Code:  

The GUIDs for individual cells are displayed in the table below:

Summary of computational transaction
Raw Inputview raw input (R code)
Raw Outputview raw output of R engine
Computing time4 seconds
R Server'Gwilym Jenkins' @ 72.249.127.135
R Framework error message
The field 'Names of X columns' contains a hard return which cannot be interpreted.
Please, resubmit your request without hard returns in the 'Names of X columns'.


Multiple Linear Regression - Estimated Regression Equation
BEL20[t] = + 217.853883931972 + 3217.76011165303`Depositorente `[t] + e[t]

\begin{tabular}{lllllllll}
\hline
Multiple Linear Regression - Estimated Regression Equation \tabularnewline
BEL20[t] =  +  217.853883931972 +  3217.76011165303`Depositorente
`[t]  + e[t] \tabularnewline
\hline
\end{tabular}
%Source: https://freestatistics.org/blog/index.php?pk=58558&T=1

[TABLE]
[ROW][C]Multiple Linear Regression - Estimated Regression Equation[/C][/ROW]
[ROW][C]BEL20[t] =  +  217.853883931972 +  3217.76011165303`Depositorente
`[t]  + e[t][/C][/ROW]
[/TABLE]
Source: https://freestatistics.org/blog/index.php?pk=58558&T=1

Globally Unique Identifier (entire table): ba.freestatistics.org/blog/index.php?pk=58558&T=1

As an alternative you can also use a QR Code:  

The GUIDs for individual cells are displayed in the table below:

Multiple Linear Regression - Estimated Regression Equation
BEL20[t] = + 217.853883931972 + 3217.76011165303`Depositorente `[t] + e[t]


Multiple Linear Regression - Ordinary Least Squares
VariableParameterS.D.T-STATH0: parameter = 02-tail p-value1-tail p-value
(Intercept)217.853883931972308.3283540.70660.4826660.241333
`Depositorente `3217.76011165303307.58413110.461400

\begin{tabular}{lllllllll}
\hline
Multiple Linear Regression - Ordinary Least Squares \tabularnewline
Variable & Parameter & S.D. & T-STATH0: parameter = 0 & 2-tail p-value & 1-tail p-value \tabularnewline
(Intercept) & 217.853883931972 & 308.328354 & 0.7066 & 0.482666 & 0.241333 \tabularnewline
`Depositorente
` & 3217.76011165303 & 307.584131 & 10.4614 & 0 & 0 \tabularnewline
\hline
\end{tabular}
%Source: https://freestatistics.org/blog/index.php?pk=58558&T=2

[TABLE]
[ROW][C]Multiple Linear Regression - Ordinary Least Squares[/C][/ROW]
[ROW][C]Variable[/C][C]Parameter[/C][C]S.D.[/C][C]T-STATH0: parameter = 0[/C][C]2-tail p-value[/C][C]1-tail p-value[/C][/ROW]
[ROW][C](Intercept)[/C][C]217.853883931972[/C][C]308.328354[/C][C]0.7066[/C][C]0.482666[/C][C]0.241333[/C][/ROW]
[ROW][C]`Depositorente
`[/C][C]3217.76011165303[/C][C]307.584131[/C][C]10.4614[/C][C]0[/C][C]0[/C][/ROW]
[/TABLE]
Source: https://freestatistics.org/blog/index.php?pk=58558&T=2

Globally Unique Identifier (entire table): ba.freestatistics.org/blog/index.php?pk=58558&T=2

As an alternative you can also use a QR Code:  

The GUIDs for individual cells are displayed in the table below:

Multiple Linear Regression - Ordinary Least Squares
VariableParameterS.D.T-STATH0: parameter = 02-tail p-value1-tail p-value
(Intercept)217.853883931972308.3283540.70660.4826660.241333
`Depositorente `3217.76011165303307.58413110.461400


Multiple Linear Regression - Regression Statistics
Multiple R0.808460902097025
R-squared0.653609030219535
Adjusted R-squared0.647636772119872
F-TEST (value)109.440854583360
F-TEST (DF numerator)1
F-TEST (DF denominator)58
p-value5.6621374255883e-15
Multiple Linear Regression - Residual Statistics
Residual Standard Deviation504.128264402531
Sum Squared Residuals14740427.8042315

\begin{tabular}{lllllllll}
\hline
Multiple Linear Regression - Regression Statistics \tabularnewline
Multiple R & 0.808460902097025 \tabularnewline
R-squared & 0.653609030219535 \tabularnewline
Adjusted R-squared & 0.647636772119872 \tabularnewline
F-TEST (value) & 109.440854583360 \tabularnewline
F-TEST (DF numerator) & 1 \tabularnewline
F-TEST (DF denominator) & 58 \tabularnewline
p-value & 5.6621374255883e-15 \tabularnewline
Multiple Linear Regression - Residual Statistics \tabularnewline
Residual Standard Deviation & 504.128264402531 \tabularnewline
Sum Squared Residuals & 14740427.8042315 \tabularnewline
\hline
\end{tabular}
%Source: https://freestatistics.org/blog/index.php?pk=58558&T=3

[TABLE]
[ROW][C]Multiple Linear Regression - Regression Statistics[/C][/ROW]
[ROW][C]Multiple R[/C][C]0.808460902097025[/C][/ROW]
[ROW][C]R-squared[/C][C]0.653609030219535[/C][/ROW]
[ROW][C]Adjusted R-squared[/C][C]0.647636772119872[/C][/ROW]
[ROW][C]F-TEST (value)[/C][C]109.440854583360[/C][/ROW]
[ROW][C]F-TEST (DF numerator)[/C][C]1[/C][/ROW]
[ROW][C]F-TEST (DF denominator)[/C][C]58[/C][/ROW]
[ROW][C]p-value[/C][C]5.6621374255883e-15[/C][/ROW]
[ROW][C]Multiple Linear Regression - Residual Statistics[/C][/ROW]
[ROW][C]Residual Standard Deviation[/C][C]504.128264402531[/C][/ROW]
[ROW][C]Sum Squared Residuals[/C][C]14740427.8042315[/C][/ROW]
[/TABLE]
Source: https://freestatistics.org/blog/index.php?pk=58558&T=3

Globally Unique Identifier (entire table): ba.freestatistics.org/blog/index.php?pk=58558&T=3

As an alternative you can also use a QR Code:  

The GUIDs for individual cells are displayed in the table below:

Multiple Linear Regression - Regression Statistics
Multiple R0.808460902097025
R-squared0.653609030219535
Adjusted R-squared0.647636772119872
F-TEST (value)109.440854583360
F-TEST (DF numerator)1
F-TEST (DF denominator)58
p-value5.6621374255883e-15
Multiple Linear Regression - Residual Statistics
Residual Standard Deviation504.128264402531
Sum Squared Residuals14740427.8042315


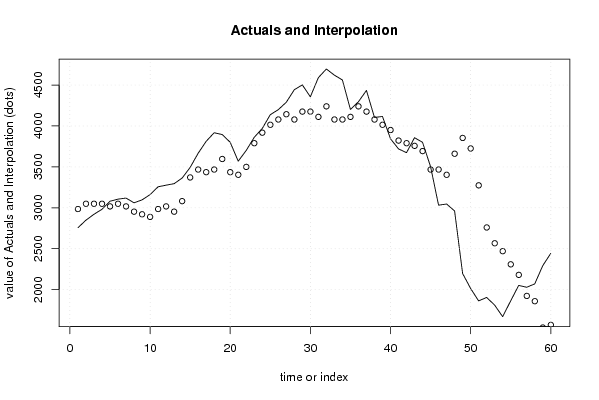
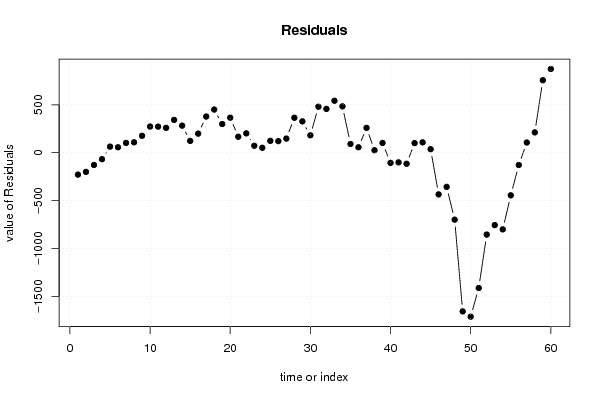
Multiple Linear Regression - Actuals, Interpolation, and Residuals
Time or IndexActualsInterpolationForecastResidualsPrediction Error
12756.762985.12757995361-228.367579953613
22849.273049.48278218664-200.21278218664
32921.443049.48278218664-128.042782186639
42981.853049.48278218664-67.6327821866392
53080.583017.3051810701163.2748189298911
63106.223049.4827821866456.7372178133607
73119.313017.30518107011102.004818929891
83061.262952.94997883705108.310021162952
93097.312920.77237772052176.537622279482
103161.692888.59477660399273.095223396012
113257.162985.12757995358272.032420046421
123277.013017.30518107011259.704818929891
133295.322952.94997883705342.370021162952
143363.993081.66038330317282.329616696830
153494.173371.25879335194122.911206648059
163667.033467.79159670153199.238403298468
173813.063435.613995585377.446004414998
183917.963467.79159670153450.168403298468
193895.513596.50200116765299.007998832347
203801.063435.613995585365.446004414998
213570.123403.43639446847166.683605531528
223701.613499.96919781806201.640802181937
233862.273789.5676078668472.7023921331647
243970.13918.2780123329651.8219876670442
254138.524014.81081568255123.709184317454
264199.754079.16601791561120.583982084393
274290.894143.52122014867147.368779851333
284443.914079.16601791561364.743982084393
294502.644175.6988212652326.941178734802
304356.984175.6988212652181.281178734802
314591.274111.34361903214479.926380967863
324696.964240.05402349826456.905976501742
334621.44079.16601791561542.233982084393
344562.844079.16601791561483.673982084393
354202.524111.3436190321491.176380967863
364296.494240.0540234982656.4359765017413
374435.234175.6988212652259.531178734802
384105.184079.1660179156126.0139820843932
394116.684014.81081568255101.869184317454
403844.493950.45561344949-105.965613449486
413720.983821.74520898337-100.765208983365
423674.43789.56760786684-115.167607866835
433857.623757.39000675031100.229993249695
443801.063693.03480451724108.025195482756
453504.373467.7915967015336.5784032984675
463032.63467.79159670153-435.191596701533
473047.033403.43639446847-356.406394468472
482962.343660.85720340071-698.517203400714
492197.823853.9228100999-1656.10281009989
502014.453725.21240563377-1710.76240563377
511862.833274.72599000235-1411.89599000235
521905.412759.88437213787-854.474372137867
531810.992566.81876543869-755.828765438685
541670.072470.28596208909-800.215962089094
551864.442309.39795650644-444.957956506443
562052.022180.68755204032-128.667552040322
572029.61923.26674310808106.333256891920
582070.831858.91154087502211.91845912498
592293.411537.13552970972756.274470290283
602443.271569.31313082625873.956869173752

\begin{tabular}{lllllllll}
\hline
Multiple Linear Regression - Actuals, Interpolation, and Residuals \tabularnewline
Time or Index & Actuals & InterpolationForecast & ResidualsPrediction Error \tabularnewline
1 & 2756.76 & 2985.12757995361 & -228.367579953613 \tabularnewline
2 & 2849.27 & 3049.48278218664 & -200.21278218664 \tabularnewline
3 & 2921.44 & 3049.48278218664 & -128.042782186639 \tabularnewline
4 & 2981.85 & 3049.48278218664 & -67.6327821866392 \tabularnewline
5 & 3080.58 & 3017.30518107011 & 63.2748189298911 \tabularnewline
6 & 3106.22 & 3049.48278218664 & 56.7372178133607 \tabularnewline
7 & 3119.31 & 3017.30518107011 & 102.004818929891 \tabularnewline
8 & 3061.26 & 2952.94997883705 & 108.310021162952 \tabularnewline
9 & 3097.31 & 2920.77237772052 & 176.537622279482 \tabularnewline
10 & 3161.69 & 2888.59477660399 & 273.095223396012 \tabularnewline
11 & 3257.16 & 2985.12757995358 & 272.032420046421 \tabularnewline
12 & 3277.01 & 3017.30518107011 & 259.704818929891 \tabularnewline
13 & 3295.32 & 2952.94997883705 & 342.370021162952 \tabularnewline
14 & 3363.99 & 3081.66038330317 & 282.329616696830 \tabularnewline
15 & 3494.17 & 3371.25879335194 & 122.911206648059 \tabularnewline
16 & 3667.03 & 3467.79159670153 & 199.238403298468 \tabularnewline
17 & 3813.06 & 3435.613995585 & 377.446004414998 \tabularnewline
18 & 3917.96 & 3467.79159670153 & 450.168403298468 \tabularnewline
19 & 3895.51 & 3596.50200116765 & 299.007998832347 \tabularnewline
20 & 3801.06 & 3435.613995585 & 365.446004414998 \tabularnewline
21 & 3570.12 & 3403.43639446847 & 166.683605531528 \tabularnewline
22 & 3701.61 & 3499.96919781806 & 201.640802181937 \tabularnewline
23 & 3862.27 & 3789.56760786684 & 72.7023921331647 \tabularnewline
24 & 3970.1 & 3918.27801233296 & 51.8219876670442 \tabularnewline
25 & 4138.52 & 4014.81081568255 & 123.709184317454 \tabularnewline
26 & 4199.75 & 4079.16601791561 & 120.583982084393 \tabularnewline
27 & 4290.89 & 4143.52122014867 & 147.368779851333 \tabularnewline
28 & 4443.91 & 4079.16601791561 & 364.743982084393 \tabularnewline
29 & 4502.64 & 4175.6988212652 & 326.941178734802 \tabularnewline
30 & 4356.98 & 4175.6988212652 & 181.281178734802 \tabularnewline
31 & 4591.27 & 4111.34361903214 & 479.926380967863 \tabularnewline
32 & 4696.96 & 4240.05402349826 & 456.905976501742 \tabularnewline
33 & 4621.4 & 4079.16601791561 & 542.233982084393 \tabularnewline
34 & 4562.84 & 4079.16601791561 & 483.673982084393 \tabularnewline
35 & 4202.52 & 4111.34361903214 & 91.176380967863 \tabularnewline
36 & 4296.49 & 4240.05402349826 & 56.4359765017413 \tabularnewline
37 & 4435.23 & 4175.6988212652 & 259.531178734802 \tabularnewline
38 & 4105.18 & 4079.16601791561 & 26.0139820843932 \tabularnewline
39 & 4116.68 & 4014.81081568255 & 101.869184317454 \tabularnewline
40 & 3844.49 & 3950.45561344949 & -105.965613449486 \tabularnewline
41 & 3720.98 & 3821.74520898337 & -100.765208983365 \tabularnewline
42 & 3674.4 & 3789.56760786684 & -115.167607866835 \tabularnewline
43 & 3857.62 & 3757.39000675031 & 100.229993249695 \tabularnewline
44 & 3801.06 & 3693.03480451724 & 108.025195482756 \tabularnewline
45 & 3504.37 & 3467.79159670153 & 36.5784032984675 \tabularnewline
46 & 3032.6 & 3467.79159670153 & -435.191596701533 \tabularnewline
47 & 3047.03 & 3403.43639446847 & -356.406394468472 \tabularnewline
48 & 2962.34 & 3660.85720340071 & -698.517203400714 \tabularnewline
49 & 2197.82 & 3853.9228100999 & -1656.10281009989 \tabularnewline
50 & 2014.45 & 3725.21240563377 & -1710.76240563377 \tabularnewline
51 & 1862.83 & 3274.72599000235 & -1411.89599000235 \tabularnewline
52 & 1905.41 & 2759.88437213787 & -854.474372137867 \tabularnewline
53 & 1810.99 & 2566.81876543869 & -755.828765438685 \tabularnewline
54 & 1670.07 & 2470.28596208909 & -800.215962089094 \tabularnewline
55 & 1864.44 & 2309.39795650644 & -444.957956506443 \tabularnewline
56 & 2052.02 & 2180.68755204032 & -128.667552040322 \tabularnewline
57 & 2029.6 & 1923.26674310808 & 106.333256891920 \tabularnewline
58 & 2070.83 & 1858.91154087502 & 211.91845912498 \tabularnewline
59 & 2293.41 & 1537.13552970972 & 756.274470290283 \tabularnewline
60 & 2443.27 & 1569.31313082625 & 873.956869173752 \tabularnewline
\hline
\end{tabular}
%Source: https://freestatistics.org/blog/index.php?pk=58558&T=4

[TABLE]
[ROW][C]Multiple Linear Regression - Actuals, Interpolation, and Residuals[/C][/ROW]
[ROW][C]Time or Index[/C][C]Actuals[/C][C]InterpolationForecast[/C][C]ResidualsPrediction Error[/C][/ROW]
[ROW][C]1[/C][C]2756.76[/C][C]2985.12757995361[/C][C]-228.367579953613[/C][/ROW]
[ROW][C]2[/C][C]2849.27[/C][C]3049.48278218664[/C][C]-200.21278218664[/C][/ROW]
[ROW][C]3[/C][C]2921.44[/C][C]3049.48278218664[/C][C]-128.042782186639[/C][/ROW]
[ROW][C]4[/C][C]2981.85[/C][C]3049.48278218664[/C][C]-67.6327821866392[/C][/ROW]
[ROW][C]5[/C][C]3080.58[/C][C]3017.30518107011[/C][C]63.2748189298911[/C][/ROW]
[ROW][C]6[/C][C]3106.22[/C][C]3049.48278218664[/C][C]56.7372178133607[/C][/ROW]
[ROW][C]7[/C][C]3119.31[/C][C]3017.30518107011[/C][C]102.004818929891[/C][/ROW]
[ROW][C]8[/C][C]3061.26[/C][C]2952.94997883705[/C][C]108.310021162952[/C][/ROW]
[ROW][C]9[/C][C]3097.31[/C][C]2920.77237772052[/C][C]176.537622279482[/C][/ROW]
[ROW][C]10[/C][C]3161.69[/C][C]2888.59477660399[/C][C]273.095223396012[/C][/ROW]
[ROW][C]11[/C][C]3257.16[/C][C]2985.12757995358[/C][C]272.032420046421[/C][/ROW]
[ROW][C]12[/C][C]3277.01[/C][C]3017.30518107011[/C][C]259.704818929891[/C][/ROW]
[ROW][C]13[/C][C]3295.32[/C][C]2952.94997883705[/C][C]342.370021162952[/C][/ROW]
[ROW][C]14[/C][C]3363.99[/C][C]3081.66038330317[/C][C]282.329616696830[/C][/ROW]
[ROW][C]15[/C][C]3494.17[/C][C]3371.25879335194[/C][C]122.911206648059[/C][/ROW]
[ROW][C]16[/C][C]3667.03[/C][C]3467.79159670153[/C][C]199.238403298468[/C][/ROW]
[ROW][C]17[/C][C]3813.06[/C][C]3435.613995585[/C][C]377.446004414998[/C][/ROW]
[ROW][C]18[/C][C]3917.96[/C][C]3467.79159670153[/C][C]450.168403298468[/C][/ROW]
[ROW][C]19[/C][C]3895.51[/C][C]3596.50200116765[/C][C]299.007998832347[/C][/ROW]
[ROW][C]20[/C][C]3801.06[/C][C]3435.613995585[/C][C]365.446004414998[/C][/ROW]
[ROW][C]21[/C][C]3570.12[/C][C]3403.43639446847[/C][C]166.683605531528[/C][/ROW]
[ROW][C]22[/C][C]3701.61[/C][C]3499.96919781806[/C][C]201.640802181937[/C][/ROW]
[ROW][C]23[/C][C]3862.27[/C][C]3789.56760786684[/C][C]72.7023921331647[/C][/ROW]
[ROW][C]24[/C][C]3970.1[/C][C]3918.27801233296[/C][C]51.8219876670442[/C][/ROW]
[ROW][C]25[/C][C]4138.52[/C][C]4014.81081568255[/C][C]123.709184317454[/C][/ROW]
[ROW][C]26[/C][C]4199.75[/C][C]4079.16601791561[/C][C]120.583982084393[/C][/ROW]
[ROW][C]27[/C][C]4290.89[/C][C]4143.52122014867[/C][C]147.368779851333[/C][/ROW]
[ROW][C]28[/C][C]4443.91[/C][C]4079.16601791561[/C][C]364.743982084393[/C][/ROW]
[ROW][C]29[/C][C]4502.64[/C][C]4175.6988212652[/C][C]326.941178734802[/C][/ROW]
[ROW][C]30[/C][C]4356.98[/C][C]4175.6988212652[/C][C]181.281178734802[/C][/ROW]
[ROW][C]31[/C][C]4591.27[/C][C]4111.34361903214[/C][C]479.926380967863[/C][/ROW]
[ROW][C]32[/C][C]4696.96[/C][C]4240.05402349826[/C][C]456.905976501742[/C][/ROW]
[ROW][C]33[/C][C]4621.4[/C][C]4079.16601791561[/C][C]542.233982084393[/C][/ROW]
[ROW][C]34[/C][C]4562.84[/C][C]4079.16601791561[/C][C]483.673982084393[/C][/ROW]
[ROW][C]35[/C][C]4202.52[/C][C]4111.34361903214[/C][C]91.176380967863[/C][/ROW]
[ROW][C]36[/C][C]4296.49[/C][C]4240.05402349826[/C][C]56.4359765017413[/C][/ROW]
[ROW][C]37[/C][C]4435.23[/C][C]4175.6988212652[/C][C]259.531178734802[/C][/ROW]
[ROW][C]38[/C][C]4105.18[/C][C]4079.16601791561[/C][C]26.0139820843932[/C][/ROW]
[ROW][C]39[/C][C]4116.68[/C][C]4014.81081568255[/C][C]101.869184317454[/C][/ROW]
[ROW][C]40[/C][C]3844.49[/C][C]3950.45561344949[/C][C]-105.965613449486[/C][/ROW]
[ROW][C]41[/C][C]3720.98[/C][C]3821.74520898337[/C][C]-100.765208983365[/C][/ROW]
[ROW][C]42[/C][C]3674.4[/C][C]3789.56760786684[/C][C]-115.167607866835[/C][/ROW]
[ROW][C]43[/C][C]3857.62[/C][C]3757.39000675031[/C][C]100.229993249695[/C][/ROW]
[ROW][C]44[/C][C]3801.06[/C][C]3693.03480451724[/C][C]108.025195482756[/C][/ROW]
[ROW][C]45[/C][C]3504.37[/C][C]3467.79159670153[/C][C]36.5784032984675[/C][/ROW]
[ROW][C]46[/C][C]3032.6[/C][C]3467.79159670153[/C][C]-435.191596701533[/C][/ROW]
[ROW][C]47[/C][C]3047.03[/C][C]3403.43639446847[/C][C]-356.406394468472[/C][/ROW]
[ROW][C]48[/C][C]2962.34[/C][C]3660.85720340071[/C][C]-698.517203400714[/C][/ROW]
[ROW][C]49[/C][C]2197.82[/C][C]3853.9228100999[/C][C]-1656.10281009989[/C][/ROW]
[ROW][C]50[/C][C]2014.45[/C][C]3725.21240563377[/C][C]-1710.76240563377[/C][/ROW]
[ROW][C]51[/C][C]1862.83[/C][C]3274.72599000235[/C][C]-1411.89599000235[/C][/ROW]
[ROW][C]52[/C][C]1905.41[/C][C]2759.88437213787[/C][C]-854.474372137867[/C][/ROW]
[ROW][C]53[/C][C]1810.99[/C][C]2566.81876543869[/C][C]-755.828765438685[/C][/ROW]
[ROW][C]54[/C][C]1670.07[/C][C]2470.28596208909[/C][C]-800.215962089094[/C][/ROW]
[ROW][C]55[/C][C]1864.44[/C][C]2309.39795650644[/C][C]-444.957956506443[/C][/ROW]
[ROW][C]56[/C][C]2052.02[/C][C]2180.68755204032[/C][C]-128.667552040322[/C][/ROW]
[ROW][C]57[/C][C]2029.6[/C][C]1923.26674310808[/C][C]106.333256891920[/C][/ROW]
[ROW][C]58[/C][C]2070.83[/C][C]1858.91154087502[/C][C]211.91845912498[/C][/ROW]
[ROW][C]59[/C][C]2293.41[/C][C]1537.13552970972[/C][C]756.274470290283[/C][/ROW]
[ROW][C]60[/C][C]2443.27[/C][C]1569.31313082625[/C][C]873.956869173752[/C][/ROW]
[/TABLE]
Source: https://freestatistics.org/blog/index.php?pk=58558&T=4

Globally Unique Identifier (entire table): ba.freestatistics.org/blog/index.php?pk=58558&T=4

As an alternative you can also use a QR Code:  

The GUIDs for individual cells are displayed in the table below:

Multiple Linear Regression - Actuals, Interpolation, and Residuals
Time or IndexActualsInterpolationForecastResidualsPrediction Error
12756.762985.12757995361-228.367579953613
22849.273049.48278218664-200.21278218664
32921.443049.48278218664-128.042782186639
42981.853049.48278218664-67.6327821866392
53080.583017.3051810701163.2748189298911
63106.223049.4827821866456.7372178133607
73119.313017.30518107011102.004818929891
83061.262952.94997883705108.310021162952
93097.312920.77237772052176.537622279482
103161.692888.59477660399273.095223396012
113257.162985.12757995358272.032420046421
123277.013017.30518107011259.704818929891
133295.322952.94997883705342.370021162952
143363.993081.66038330317282.329616696830
153494.173371.25879335194122.911206648059
163667.033467.79159670153199.238403298468
173813.063435.613995585377.446004414998
183917.963467.79159670153450.168403298468
193895.513596.50200116765299.007998832347
203801.063435.613995585365.446004414998
213570.123403.43639446847166.683605531528
223701.613499.96919781806201.640802181937
233862.273789.5676078668472.7023921331647
243970.13918.2780123329651.8219876670442
254138.524014.81081568255123.709184317454
264199.754079.16601791561120.583982084393
274290.894143.52122014867147.368779851333
284443.914079.16601791561364.743982084393
294502.644175.6988212652326.941178734802
304356.984175.6988212652181.281178734802
314591.274111.34361903214479.926380967863
324696.964240.05402349826456.905976501742
334621.44079.16601791561542.233982084393
344562.844079.16601791561483.673982084393
354202.524111.3436190321491.176380967863
364296.494240.0540234982656.4359765017413
374435.234175.6988212652259.531178734802
384105.184079.1660179156126.0139820843932
394116.684014.81081568255101.869184317454
403844.493950.45561344949-105.965613449486
413720.983821.74520898337-100.765208983365
423674.43789.56760786684-115.167607866835
433857.623757.39000675031100.229993249695
443801.063693.03480451724108.025195482756
453504.373467.7915967015336.5784032984675
463032.63467.79159670153-435.191596701533
473047.033403.43639446847-356.406394468472
482962.343660.85720340071-698.517203400714
492197.823853.9228100999-1656.10281009989
502014.453725.21240563377-1710.76240563377
511862.833274.72599000235-1411.89599000235
521905.412759.88437213787-854.474372137867
531810.992566.81876543869-755.828765438685
541670.072470.28596208909-800.215962089094
551864.442309.39795650644-444.957956506443
562052.022180.68755204032-128.667552040322
572029.61923.26674310808106.333256891920
582070.831858.91154087502211.91845912498
592293.411537.13552970972756.274470290283
602443.271569.31313082625873.956869173752


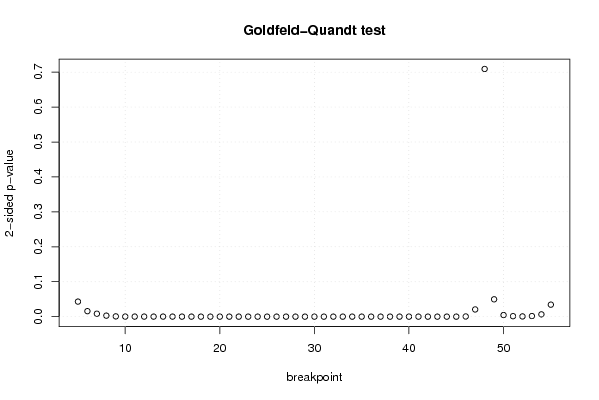
Goldfeld-Quandt test for Heteroskedasticity
p-valuesAlternative Hypothesis
breakpoint indexgreater2-sidedless
50.02154061118552960.04308122237105920.97845938881447
60.007847972763410120.01569594552682020.99215202723659
70.004189236375571170.008378472751142340.99581076362443
80.001443677540603400.002887355081206810.998556322459397
90.0003886733183530470.0007773466367060950.999611326681647
100.0001003381671565630.0002006763343131260.999899661832844
118.19307435356172e-050.0001638614870712340.999918069256464
127.67413700354303e-050.0001534827400708610.999923258629965
134.09035299078307e-058.18070598156613e-050.999959096470092
147.08848603603402e-050.0001417697207206800.99992911513964
154.8737334234757e-059.7474668469514e-050.999951262665765
162.00915820389891e-054.01831640779781e-050.99997990841796
171.28554557469427e-052.57109114938853e-050.999987144544253
187.997143236592e-061.5994286473184e-050.999992002856763
192.59974841886399e-065.19949683772799e-060.99999740025158
209.9169558632252e-071.98339117264504e-060.999999008304414
213.25875191564507e-076.51750383129015e-070.999999674124809
221.03405069918391e-072.06810139836782e-070.99999989659493
237.10877104598248e-081.42175420919650e-070.99999992891229
243.935311629854e-087.870623259708e-080.999999960646884
251.31886252679384e-082.63772505358768e-080.999999986811375
264.10756446128977e-098.21512892257953e-090.999999995892435
271.16580087724456e-092.33160175448912e-090.999999998834199
285.45172499191597e-101.09034499838319e-090.999999999454827
291.94410382653584e-103.88820765307168e-100.99999999980559
305.6644484066548e-111.13288968133096e-100.999999999943356
315.64217814987622e-111.12843562997524e-100.999999999943578
324.0610527753013e-118.1221055506026e-110.99999999995939
336.88593998951903e-111.37718799790381e-100.99999999993114
347.71948819115255e-111.54389763823051e-100.999999999922805
355.6058924593981e-111.12117849187962e-100.99999999994394
365.5014855234977e-111.10029710469954e-100.999999999944985
374.48856746474370e-118.97713492948739e-110.999999999955114
385.34049879731766e-111.06809975946353e-100.999999999946595
396.14793434596873e-111.22958686919375e-100.99999999993852
401.56930259873502e-103.13860519747003e-100.99999999984307
413.39373215722216e-106.78746431444433e-100.999999999660627
429.10237329605562e-101.82047465921112e-090.999999999089763
435.01985577535529e-091.00397115507106e-080.999999994980144
441.28255858960495e-072.5651171792099e-070.99999987174414
455.77539604271518e-061.15507920854304e-050.999994224603957
460.0002397852215615180.0004795704431230360.999760214778438
470.01031466252090570.02062932504181140.989685337479094
480.6454334332603420.7091331334793170.354566566739658
490.975170528430750.04965894313850070.0248294715692504
500.9977026281801680.004594743639664580.00229737181983229
510.9993096042483530.001380791503294690.000690395751647347
520.9996656618742250.0006686762515508580.000334338125775429
530.9991315868956860.001736826208627580.000868413104313788
540.9967220117809470.006555976438105260.00327798821905263
550.9828480004191770.03430399916164630.0171519995808231

\begin{tabular}{lllllllll}
\hline
Goldfeld-Quandt test for Heteroskedasticity \tabularnewline
p-values & Alternative Hypothesis \tabularnewline
breakpoint index & greater & 2-sided & less \tabularnewline
5 & 0.0215406111855296 & 0.0430812223710592 & 0.97845938881447 \tabularnewline
6 & 0.00784797276341012 & 0.0156959455268202 & 0.99215202723659 \tabularnewline
7 & 0.00418923637557117 & 0.00837847275114234 & 0.99581076362443 \tabularnewline
8 & 0.00144367754060340 & 0.00288735508120681 & 0.998556322459397 \tabularnewline
9 & 0.000388673318353047 & 0.000777346636706095 & 0.999611326681647 \tabularnewline
10 & 0.000100338167156563 & 0.000200676334313126 & 0.999899661832844 \tabularnewline
11 & 8.19307435356172e-05 & 0.000163861487071234 & 0.999918069256464 \tabularnewline
12 & 7.67413700354303e-05 & 0.000153482740070861 & 0.999923258629965 \tabularnewline
13 & 4.09035299078307e-05 & 8.18070598156613e-05 & 0.999959096470092 \tabularnewline
14 & 7.08848603603402e-05 & 0.000141769720720680 & 0.99992911513964 \tabularnewline
15 & 4.8737334234757e-05 & 9.7474668469514e-05 & 0.999951262665765 \tabularnewline
16 & 2.00915820389891e-05 & 4.01831640779781e-05 & 0.99997990841796 \tabularnewline
17 & 1.28554557469427e-05 & 2.57109114938853e-05 & 0.999987144544253 \tabularnewline
18 & 7.997143236592e-06 & 1.5994286473184e-05 & 0.999992002856763 \tabularnewline
19 & 2.59974841886399e-06 & 5.19949683772799e-06 & 0.99999740025158 \tabularnewline
20 & 9.9169558632252e-07 & 1.98339117264504e-06 & 0.999999008304414 \tabularnewline
21 & 3.25875191564507e-07 & 6.51750383129015e-07 & 0.999999674124809 \tabularnewline
22 & 1.03405069918391e-07 & 2.06810139836782e-07 & 0.99999989659493 \tabularnewline
23 & 7.10877104598248e-08 & 1.42175420919650e-07 & 0.99999992891229 \tabularnewline
24 & 3.935311629854e-08 & 7.870623259708e-08 & 0.999999960646884 \tabularnewline
25 & 1.31886252679384e-08 & 2.63772505358768e-08 & 0.999999986811375 \tabularnewline
26 & 4.10756446128977e-09 & 8.21512892257953e-09 & 0.999999995892435 \tabularnewline
27 & 1.16580087724456e-09 & 2.33160175448912e-09 & 0.999999998834199 \tabularnewline
28 & 5.45172499191597e-10 & 1.09034499838319e-09 & 0.999999999454827 \tabularnewline
29 & 1.94410382653584e-10 & 3.88820765307168e-10 & 0.99999999980559 \tabularnewline
30 & 5.6644484066548e-11 & 1.13288968133096e-10 & 0.999999999943356 \tabularnewline
31 & 5.64217814987622e-11 & 1.12843562997524e-10 & 0.999999999943578 \tabularnewline
32 & 4.0610527753013e-11 & 8.1221055506026e-11 & 0.99999999995939 \tabularnewline
33 & 6.88593998951903e-11 & 1.37718799790381e-10 & 0.99999999993114 \tabularnewline
34 & 7.71948819115255e-11 & 1.54389763823051e-10 & 0.999999999922805 \tabularnewline
35 & 5.6058924593981e-11 & 1.12117849187962e-10 & 0.99999999994394 \tabularnewline
36 & 5.5014855234977e-11 & 1.10029710469954e-10 & 0.999999999944985 \tabularnewline
37 & 4.48856746474370e-11 & 8.97713492948739e-11 & 0.999999999955114 \tabularnewline
38 & 5.34049879731766e-11 & 1.06809975946353e-10 & 0.999999999946595 \tabularnewline
39 & 6.14793434596873e-11 & 1.22958686919375e-10 & 0.99999999993852 \tabularnewline
40 & 1.56930259873502e-10 & 3.13860519747003e-10 & 0.99999999984307 \tabularnewline
41 & 3.39373215722216e-10 & 6.78746431444433e-10 & 0.999999999660627 \tabularnewline
42 & 9.10237329605562e-10 & 1.82047465921112e-09 & 0.999999999089763 \tabularnewline
43 & 5.01985577535529e-09 & 1.00397115507106e-08 & 0.999999994980144 \tabularnewline
44 & 1.28255858960495e-07 & 2.5651171792099e-07 & 0.99999987174414 \tabularnewline
45 & 5.77539604271518e-06 & 1.15507920854304e-05 & 0.999994224603957 \tabularnewline
46 & 0.000239785221561518 & 0.000479570443123036 & 0.999760214778438 \tabularnewline
47 & 0.0103146625209057 & 0.0206293250418114 & 0.989685337479094 \tabularnewline
48 & 0.645433433260342 & 0.709133133479317 & 0.354566566739658 \tabularnewline
49 & 0.97517052843075 & 0.0496589431385007 & 0.0248294715692504 \tabularnewline
50 & 0.997702628180168 & 0.00459474363966458 & 0.00229737181983229 \tabularnewline
51 & 0.999309604248353 & 0.00138079150329469 & 0.000690395751647347 \tabularnewline
52 & 0.999665661874225 & 0.000668676251550858 & 0.000334338125775429 \tabularnewline
53 & 0.999131586895686 & 0.00173682620862758 & 0.000868413104313788 \tabularnewline
54 & 0.996722011780947 & 0.00655597643810526 & 0.00327798821905263 \tabularnewline
55 & 0.982848000419177 & 0.0343039991616463 & 0.0171519995808231 \tabularnewline
\hline
\end{tabular}
%Source: https://freestatistics.org/blog/index.php?pk=58558&T=5

[TABLE]
[ROW][C]Goldfeld-Quandt test for Heteroskedasticity[/C][/ROW]
[ROW][C]p-values[/C][C]Alternative Hypothesis[/C][/ROW]
[ROW][C]breakpoint index[/C][C]greater[/C][C]2-sided[/C][C]less[/C][/ROW]
[ROW][C]5[/C][C]0.0215406111855296[/C][C]0.0430812223710592[/C][C]0.97845938881447[/C][/ROW]
[ROW][C]6[/C][C]0.00784797276341012[/C][C]0.0156959455268202[/C][C]0.99215202723659[/C][/ROW]
[ROW][C]7[/C][C]0.00418923637557117[/C][C]0.00837847275114234[/C][C]0.99581076362443[/C][/ROW]
[ROW][C]8[/C][C]0.00144367754060340[/C][C]0.00288735508120681[/C][C]0.998556322459397[/C][/ROW]
[ROW][C]9[/C][C]0.000388673318353047[/C][C]0.000777346636706095[/C][C]0.999611326681647[/C][/ROW]
[ROW][C]10[/C][C]0.000100338167156563[/C][C]0.000200676334313126[/C][C]0.999899661832844[/C][/ROW]
[ROW][C]11[/C][C]8.19307435356172e-05[/C][C]0.000163861487071234[/C][C]0.999918069256464[/C][/ROW]
[ROW][C]12[/C][C]7.67413700354303e-05[/C][C]0.000153482740070861[/C][C]0.999923258629965[/C][/ROW]
[ROW][C]13[/C][C]4.09035299078307e-05[/C][C]8.18070598156613e-05[/C][C]0.999959096470092[/C][/ROW]
[ROW][C]14[/C][C]7.08848603603402e-05[/C][C]0.000141769720720680[/C][C]0.99992911513964[/C][/ROW]
[ROW][C]15[/C][C]4.8737334234757e-05[/C][C]9.7474668469514e-05[/C][C]0.999951262665765[/C][/ROW]
[ROW][C]16[/C][C]2.00915820389891e-05[/C][C]4.01831640779781e-05[/C][C]0.99997990841796[/C][/ROW]
[ROW][C]17[/C][C]1.28554557469427e-05[/C][C]2.57109114938853e-05[/C][C]0.999987144544253[/C][/ROW]
[ROW][C]18[/C][C]7.997143236592e-06[/C][C]1.5994286473184e-05[/C][C]0.999992002856763[/C][/ROW]
[ROW][C]19[/C][C]2.59974841886399e-06[/C][C]5.19949683772799e-06[/C][C]0.99999740025158[/C][/ROW]
[ROW][C]20[/C][C]9.9169558632252e-07[/C][C]1.98339117264504e-06[/C][C]0.999999008304414[/C][/ROW]
[ROW][C]21[/C][C]3.25875191564507e-07[/C][C]6.51750383129015e-07[/C][C]0.999999674124809[/C][/ROW]
[ROW][C]22[/C][C]1.03405069918391e-07[/C][C]2.06810139836782e-07[/C][C]0.99999989659493[/C][/ROW]
[ROW][C]23[/C][C]7.10877104598248e-08[/C][C]1.42175420919650e-07[/C][C]0.99999992891229[/C][/ROW]
[ROW][C]24[/C][C]3.935311629854e-08[/C][C]7.870623259708e-08[/C][C]0.999999960646884[/C][/ROW]
[ROW][C]25[/C][C]1.31886252679384e-08[/C][C]2.63772505358768e-08[/C][C]0.999999986811375[/C][/ROW]
[ROW][C]26[/C][C]4.10756446128977e-09[/C][C]8.21512892257953e-09[/C][C]0.999999995892435[/C][/ROW]
[ROW][C]27[/C][C]1.16580087724456e-09[/C][C]2.33160175448912e-09[/C][C]0.999999998834199[/C][/ROW]
[ROW][C]28[/C][C]5.45172499191597e-10[/C][C]1.09034499838319e-09[/C][C]0.999999999454827[/C][/ROW]
[ROW][C]29[/C][C]1.94410382653584e-10[/C][C]3.88820765307168e-10[/C][C]0.99999999980559[/C][/ROW]
[ROW][C]30[/C][C]5.6644484066548e-11[/C][C]1.13288968133096e-10[/C][C]0.999999999943356[/C][/ROW]
[ROW][C]31[/C][C]5.64217814987622e-11[/C][C]1.12843562997524e-10[/C][C]0.999999999943578[/C][/ROW]
[ROW][C]32[/C][C]4.0610527753013e-11[/C][C]8.1221055506026e-11[/C][C]0.99999999995939[/C][/ROW]
[ROW][C]33[/C][C]6.88593998951903e-11[/C][C]1.37718799790381e-10[/C][C]0.99999999993114[/C][/ROW]
[ROW][C]34[/C][C]7.71948819115255e-11[/C][C]1.54389763823051e-10[/C][C]0.999999999922805[/C][/ROW]
[ROW][C]35[/C][C]5.6058924593981e-11[/C][C]1.12117849187962e-10[/C][C]0.99999999994394[/C][/ROW]
[ROW][C]36[/C][C]5.5014855234977e-11[/C][C]1.10029710469954e-10[/C][C]0.999999999944985[/C][/ROW]
[ROW][C]37[/C][C]4.48856746474370e-11[/C][C]8.97713492948739e-11[/C][C]0.999999999955114[/C][/ROW]
[ROW][C]38[/C][C]5.34049879731766e-11[/C][C]1.06809975946353e-10[/C][C]0.999999999946595[/C][/ROW]
[ROW][C]39[/C][C]6.14793434596873e-11[/C][C]1.22958686919375e-10[/C][C]0.99999999993852[/C][/ROW]
[ROW][C]40[/C][C]1.56930259873502e-10[/C][C]3.13860519747003e-10[/C][C]0.99999999984307[/C][/ROW]
[ROW][C]41[/C][C]3.39373215722216e-10[/C][C]6.78746431444433e-10[/C][C]0.999999999660627[/C][/ROW]
[ROW][C]42[/C][C]9.10237329605562e-10[/C][C]1.82047465921112e-09[/C][C]0.999999999089763[/C][/ROW]
[ROW][C]43[/C][C]5.01985577535529e-09[/C][C]1.00397115507106e-08[/C][C]0.999999994980144[/C][/ROW]
[ROW][C]44[/C][C]1.28255858960495e-07[/C][C]2.5651171792099e-07[/C][C]0.99999987174414[/C][/ROW]
[ROW][C]45[/C][C]5.77539604271518e-06[/C][C]1.15507920854304e-05[/C][C]0.999994224603957[/C][/ROW]
[ROW][C]46[/C][C]0.000239785221561518[/C][C]0.000479570443123036[/C][C]0.999760214778438[/C][/ROW]
[ROW][C]47[/C][C]0.0103146625209057[/C][C]0.0206293250418114[/C][C]0.989685337479094[/C][/ROW]
[ROW][C]48[/C][C]0.645433433260342[/C][C]0.709133133479317[/C][C]0.354566566739658[/C][/ROW]
[ROW][C]49[/C][C]0.97517052843075[/C][C]0.0496589431385007[/C][C]0.0248294715692504[/C][/ROW]
[ROW][C]50[/C][C]0.997702628180168[/C][C]0.00459474363966458[/C][C]0.00229737181983229[/C][/ROW]
[ROW][C]51[/C][C]0.999309604248353[/C][C]0.00138079150329469[/C][C]0.000690395751647347[/C][/ROW]
[ROW][C]52[/C][C]0.999665661874225[/C][C]0.000668676251550858[/C][C]0.000334338125775429[/C][/ROW]
[ROW][C]53[/C][C]0.999131586895686[/C][C]0.00173682620862758[/C][C]0.000868413104313788[/C][/ROW]
[ROW][C]54[/C][C]0.996722011780947[/C][C]0.00655597643810526[/C][C]0.00327798821905263[/C][/ROW]
[ROW][C]55[/C][C]0.982848000419177[/C][C]0.0343039991616463[/C][C]0.0171519995808231[/C][/ROW]
[/TABLE]
Source: https://freestatistics.org/blog/index.php?pk=58558&T=5

Globally Unique Identifier (entire table): ba.freestatistics.org/blog/index.php?pk=58558&T=5

As an alternative you can also use a QR Code:  

The GUIDs for individual cells are displayed in the table below:

Goldfeld-Quandt test for Heteroskedasticity
p-valuesAlternative Hypothesis
breakpoint indexgreater2-sidedless
50.02154061118552960.04308122237105920.97845938881447
60.007847972763410120.01569594552682020.99215202723659
70.004189236375571170.008378472751142340.99581076362443
80.001443677540603400.002887355081206810.998556322459397
90.0003886733183530470.0007773466367060950.999611326681647
100.0001003381671565630.0002006763343131260.999899661832844
118.19307435356172e-050.0001638614870712340.999918069256464
127.67413700354303e-050.0001534827400708610.999923258629965
134.09035299078307e-058.18070598156613e-050.999959096470092
147.08848603603402e-050.0001417697207206800.99992911513964
154.8737334234757e-059.7474668469514e-050.999951262665765
162.00915820389891e-054.01831640779781e-050.99997990841796
171.28554557469427e-052.57109114938853e-050.999987144544253
187.997143236592e-061.5994286473184e-050.999992002856763
192.59974841886399e-065.19949683772799e-060.99999740025158
209.9169558632252e-071.98339117264504e-060.999999008304414
213.25875191564507e-076.51750383129015e-070.999999674124809
221.03405069918391e-072.06810139836782e-070.99999989659493
237.10877104598248e-081.42175420919650e-070.99999992891229
243.935311629854e-087.870623259708e-080.999999960646884
251.31886252679384e-082.63772505358768e-080.999999986811375
264.10756446128977e-098.21512892257953e-090.999999995892435
271.16580087724456e-092.33160175448912e-090.999999998834199
285.45172499191597e-101.09034499838319e-090.999999999454827
291.94410382653584e-103.88820765307168e-100.99999999980559
305.6644484066548e-111.13288968133096e-100.999999999943356
315.64217814987622e-111.12843562997524e-100.999999999943578
324.0610527753013e-118.1221055506026e-110.99999999995939
336.88593998951903e-111.37718799790381e-100.99999999993114
347.71948819115255e-111.54389763823051e-100.999999999922805
355.6058924593981e-111.12117849187962e-100.99999999994394
365.5014855234977e-111.10029710469954e-100.999999999944985
374.48856746474370e-118.97713492948739e-110.999999999955114
385.34049879731766e-111.06809975946353e-100.999999999946595
396.14793434596873e-111.22958686919375e-100.99999999993852
401.56930259873502e-103.13860519747003e-100.99999999984307
413.39373215722216e-106.78746431444433e-100.999999999660627
429.10237329605562e-101.82047465921112e-090.999999999089763
435.01985577535529e-091.00397115507106e-080.999999994980144
441.28255858960495e-072.5651171792099e-070.99999987174414
455.77539604271518e-061.15507920854304e-050.999994224603957
460.0002397852215615180.0004795704431230360.999760214778438
470.01031466252090570.02062932504181140.989685337479094
480.6454334332603420.7091331334793170.354566566739658
490.975170528430750.04965894313850070.0248294715692504
500.9977026281801680.004594743639664580.00229737181983229
510.9993096042483530.001380791503294690.000690395751647347
520.9996656618742250.0006686762515508580.000334338125775429
530.9991315868956860.001736826208627580.000868413104313788
540.9967220117809470.006555976438105260.00327798821905263
550.9828480004191770.03430399916164630.0171519995808231


Meta Analysis of Goldfeld-Quandt test for Heteroskedasticity
Description# significant tests% significant testsOK/NOK
1% type I error level450.88235294117647NOK
5% type I error level500.980392156862745NOK
10% type I error level500.980392156862745NOK

\begin{tabular}{lllllllll}
\hline
Meta Analysis of Goldfeld-Quandt test for Heteroskedasticity \tabularnewline
Description & # significant tests & % significant tests & OK/NOK \tabularnewline
1% type I error level & 45 & 0.88235294117647 & NOK \tabularnewline
5% type I error level & 50 & 0.980392156862745 & NOK \tabularnewline
10% type I error level & 50 & 0.980392156862745 & NOK \tabularnewline
\hline
\end{tabular}
%Source: https://freestatistics.org/blog/index.php?pk=58558&T=6

[TABLE]
[ROW][C]Meta Analysis of Goldfeld-Quandt test for Heteroskedasticity[/C][/ROW]
[ROW][C]Description[/C][C]# significant tests[/C][C]% significant tests[/C][C]OK/NOK[/C][/ROW]
[ROW][C]1% type I error level[/C][C]45[/C][C]0.88235294117647[/C][C]NOK[/C][/ROW]
[ROW][C]5% type I error level[/C][C]50[/C][C]0.980392156862745[/C][C]NOK[/C][/ROW]
[ROW][C]10% type I error level[/C][C]50[/C][C]0.980392156862745[/C][C]NOK[/C][/ROW]
[/TABLE]
Source: https://freestatistics.org/blog/index.php?pk=58558&T=6

Globally Unique Identifier (entire table): ba.freestatistics.org/blog/index.php?pk=58558&T=6

As an alternative you can also use a QR Code:  

The GUIDs for individual cells are displayed in the table below:

Meta Analysis of Goldfeld-Quandt test for Heteroskedasticity
Description# significant tests% significant testsOK/NOK
1% type I error level450.88235294117647NOK
5% type I error level500.980392156862745NOK
10% type I error level500.980392156862745NOK


Parameters (Session):
par1 = 1 ; par2 = Do not include Seasonal Dummies ; par3 = No Linear Trend ;
Parameters (R input):
par1 = 1 ; par2 = Do not include Seasonal Dummies ; par3 = No Linear Trend ;
R code (references can be found in the software module):
library(lattice)
library(lmtest)
n25 <- 25 #minimum number of obs. for Goldfeld-Quandt test
par1 <- as.numeric(par1)
x <- t(y)
k <- length(x[1,])
n <- length(x[,1])
x1 <- cbind(x[,par1], x[,1:k!=par1])
mycolnames <- c(colnames(x)[par1], colnames(x)[1:k!=par1])
colnames(x1) <- mycolnames #colnames(x)[par1]
x <- x1
if (par3 == 'First Differences'){
x2 <- array(0, dim=c(n-1,k), dimnames=list(1:(n-1), paste('(1-B)',colnames(x),sep='')))
for (i in 1:n-1) {
for (j in 1:k) {
x2[i,j] <- x[i+1,j] - x[i,j]
}
}
x <- x2
}
if (par2 == 'Include Monthly Dummies'){
x2 <- array(0, dim=c(n,11), dimnames=list(1:n, paste('M', seq(1:11), sep ='')))
for (i in 1:11){
x2[seq(i,n,12),i] <- 1
}
x <- cbind(x, x2)
}
if (par2 == 'Include Quarterly Dummies'){
x2 <- array(0, dim=c(n,3), dimnames=list(1:n, paste('Q', seq(1:3), sep ='')))
for (i in 1:3){
x2[seq(i,n,4),i] <- 1
}
x <- cbind(x, x2)
}
k <- length(x[1,])
if (par3 == 'Linear Trend'){
x <- cbind(x, c(1:n))
colnames(x)[k+1] <- 't'
}
x
k <- length(x[1,])
df <- as.data.frame(x)
(mylm <- lm(df))
(mysum <- summary(mylm))
if (n > n25) {
kp3 <- k + 3
nmkm3 <- n - k - 3
gqarr <- array(NA, dim=c(nmkm3-kp3+1,3))
numgqtests <- 0
numsignificant1 <- 0
numsignificant5 <- 0
numsignificant10 <- 0
for (mypoint in kp3:nmkm3) {
j <- 0
numgqtests <- numgqtests + 1
for (myalt in c('greater', 'two.sided', 'less')) {
j <- j + 1
gqarr[mypoint-kp3+1,j] <- gqtest(mylm, point=mypoint, alternative=myalt)$p.value
}
if (gqarr[mypoint-kp3+1,2] < 0.01) numsignificant1 <- numsignificant1 + 1
if (gqarr[mypoint-kp3+1,2] < 0.05) numsignificant5 <- numsignificant5 + 1
if (gqarr[mypoint-kp3+1,2] < 0.10) numsignificant10 <- numsignificant10 + 1
}
gqarr
}
bitmap(file='test0.png')
plot(x[,1], type='l', main='Actuals and Interpolation', ylab='value of Actuals and Interpolation (dots)', xlab='time or index')
points(x[,1]-mysum$resid)
grid()
dev.off()
bitmap(file='test1.png')
plot(mysum$resid, type='b', pch=19, main='Residuals', ylab='value of Residuals', xlab='time or index')
grid()
dev.off()
bitmap(file='test2.png')
hist(mysum$resid, main='Residual Histogram', xlab='values of Residuals')
grid()
dev.off()
bitmap(file='test3.png')
densityplot(~mysum$resid,col='black',main='Residual Density Plot', xlab='values of Residuals')
dev.off()
bitmap(file='test4.png')
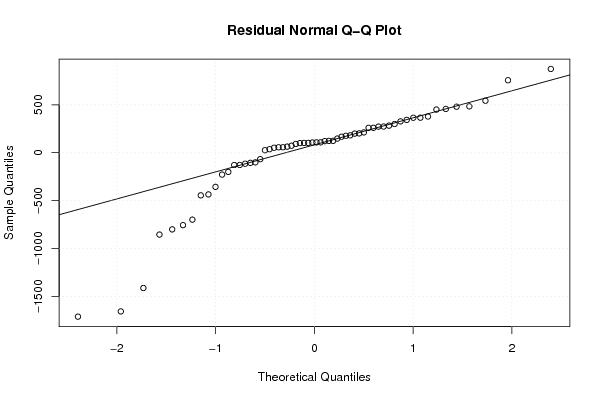
qqnorm(mysum$resid, main='Residual Normal Q-Q Plot')
qqline(mysum$resid)
grid()
dev.off()
(myerror <- as.ts(mysum$resid))
bitmap(file='test5.png')
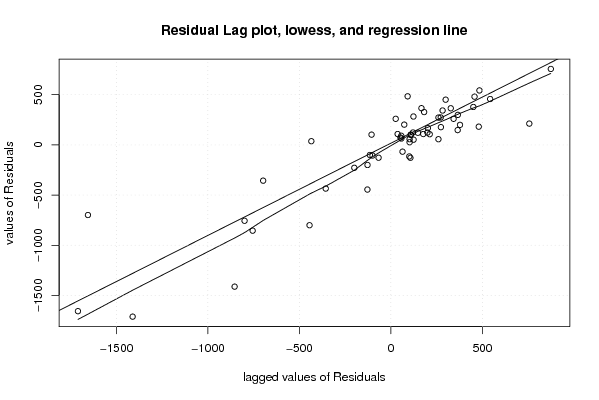
dum <- cbind(lag(myerror,k=1),myerror)
dum
dum1 <- dum[2:length(myerror),]
dum1
z <- as.data.frame(dum1)
z
plot(z,main=paste('Residual Lag plot, lowess, and regression line'), ylab='values of Residuals', xlab='lagged values of Residuals')
lines(lowess(z))
abline(lm(z))
grid()
dev.off()
bitmap(file='test6.png')
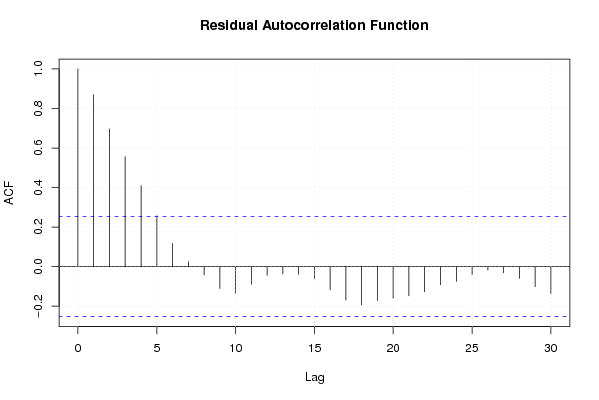
acf(mysum$resid, lag.max=length(mysum$resid)/2, main='Residual Autocorrelation Function')
grid()
dev.off()
bitmap(file='test7.png')
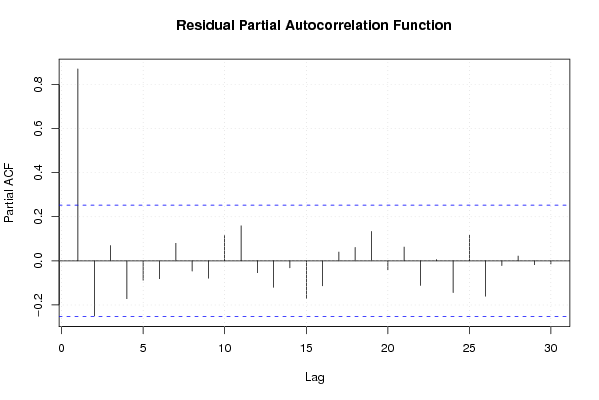
pacf(mysum$resid, lag.max=length(mysum$resid)/2, main='Residual Partial Autocorrelation Function')
grid()
dev.off()
bitmap(file='test8.png')
opar <- par(mfrow = c(2,2), oma = c(0, 0, 1.1, 0))
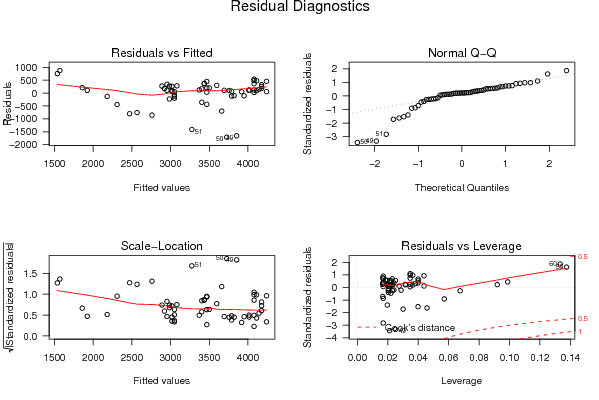
plot(mylm, las = 1, sub='Residual Diagnostics')
par(opar)
dev.off()
if (n > n25) {
bitmap(file='test9.png')
plot(kp3:nmkm3,gqarr[,2], main='Goldfeld-Quandt test',ylab='2-sided p-value',xlab='breakpoint')
grid()
dev.off()
}
load(file='createtable')
a<-table.start()
a<-table.row.start(a)
a<-table.element(a, 'Multiple Linear Regression - Estimated Regression Equation', 1, TRUE)
a<-table.row.end(a)
myeq <- colnames(x)[1]
myeq <- paste(myeq, '[t] = ', sep='')
for (i in 1:k){
if (mysum$coefficients[i,1] > 0) myeq <- paste(myeq, '+', '')
myeq <- paste(myeq, mysum$coefficients[i,1], sep=' ')
if (rownames(mysum$coefficients)[i] != '(Intercept)') {
myeq <- paste(myeq, rownames(mysum$coefficients)[i], sep='')
if (rownames(mysum$coefficients)[i] != 't') myeq <- paste(myeq, '[t]', sep='')
}
}
myeq <- paste(myeq, ' + e[t]')
a<-table.row.start(a)
a<-table.element(a, myeq)
a<-table.row.end(a)
a<-table.end(a)
table.save(a,file='mytable1.tab')
a<-table.start()
a<-table.row.start(a)
a<-table.element(a,hyperlink('ols1.htm','Multiple Linear Regression - Ordinary Least Squares',''), 6, TRUE)
a<-table.row.end(a)
a<-table.row.start(a)
a<-table.element(a,'Variable',header=TRUE)
a<-table.element(a,'Parameter',header=TRUE)
a<-table.element(a,'S.D.',header=TRUE)
a<-table.element(a,'T-STAT
H0: parameter = 0',header=TRUE)
a<-table.element(a,'2-tail p-value',header=TRUE)
a<-table.element(a,'1-tail p-value',header=TRUE)
a<-table.row.end(a)
for (i in 1:k){
a<-table.row.start(a)
a<-table.element(a,rownames(mysum$coefficients)[i],header=TRUE)
a<-table.element(a,mysum$coefficients[i,1])
a<-table.element(a, round(mysum$coefficients[i,2],6))
a<-table.element(a, round(mysum$coefficients[i,3],4))
a<-table.element(a, round(mysum$coefficients[i,4],6))
a<-table.element(a, round(mysum$coefficients[i,4]/2,6))
a<-table.row.end(a)
}
a<-table.end(a)
table.save(a,file='mytable2.tab')
a<-table.start()
a<-table.row.start(a)
a<-table.element(a, 'Multiple Linear Regression - Regression Statistics', 2, TRUE)
a<-table.row.end(a)
a<-table.row.start(a)
a<-table.element(a, 'Multiple R',1,TRUE)
a<-table.element(a, sqrt(mysum$r.squared))
a<-table.row.end(a)
a<-table.row.start(a)
a<-table.element(a, 'R-squared',1,TRUE)
a<-table.element(a, mysum$r.squared)
a<-table.row.end(a)
a<-table.row.start(a)
a<-table.element(a, 'Adjusted R-squared',1,TRUE)
a<-table.element(a, mysum$adj.r.squared)
a<-table.row.end(a)
a<-table.row.start(a)
a<-table.element(a, 'F-TEST (value)',1,TRUE)
a<-table.element(a, mysum$fstatistic[1])
a<-table.row.end(a)
a<-table.row.start(a)
a<-table.element(a, 'F-TEST (DF numerator)',1,TRUE)
a<-table.element(a, mysum$fstatistic[2])
a<-table.row.end(a)
a<-table.row.start(a)
a<-table.element(a, 'F-TEST (DF denominator)',1,TRUE)
a<-table.element(a, mysum$fstatistic[3])
a<-table.row.end(a)
a<-table.row.start(a)
a<-table.element(a, 'p-value',1,TRUE)
a<-table.element(a, 1-pf(mysum$fstatistic[1],mysum$fstatistic[2],mysum$fstatistic[3]))
a<-table.row.end(a)
a<-table.row.start(a)
a<-table.element(a, 'Multiple Linear Regression - Residual Statistics', 2, TRUE)
a<-table.row.end(a)
a<-table.row.start(a)
a<-table.element(a, 'Residual Standard Deviation',1,TRUE)
a<-table.element(a, mysum$sigma)
a<-table.row.end(a)
a<-table.row.start(a)
a<-table.element(a, 'Sum Squared Residuals',1,TRUE)
a<-table.element(a, sum(myerror*myerror))
a<-table.row.end(a)
a<-table.end(a)
table.save(a,file='mytable3.tab')
a<-table.start()
a<-table.row.start(a)
a<-table.element(a, 'Multiple Linear Regression - Actuals, Interpolation, and Residuals', 4, TRUE)
a<-table.row.end(a)
a<-table.row.start(a)
a<-table.element(a, 'Time or Index', 1, TRUE)
a<-table.element(a, 'Actuals', 1, TRUE)
a<-table.element(a, 'Interpolation
Forecast', 1, TRUE)
a<-table.element(a, 'Residuals
Prediction Error', 1, TRUE)
a<-table.row.end(a)
for (i in 1:n) {
a<-table.row.start(a)
a<-table.element(a,i, 1, TRUE)
a<-table.element(a,x[i])
a<-table.element(a,x[i]-mysum$resid[i])
a<-table.element(a,mysum$resid[i])
a<-table.row.end(a)
}
a<-table.end(a)
table.save(a,file='mytable4.tab')
if (n > n25) {
a<-table.start()
a<-table.row.start(a)
a<-table.element(a,'Goldfeld-Quandt test for Heteroskedasticity',4,TRUE)
a<-table.row.end(a)
a<-table.row.start(a)
a<-table.element(a,'p-values',header=TRUE)
a<-table.element(a,'Alternative Hypothesis',3,header=TRUE)
a<-table.row.end(a)
a<-table.row.start(a)
a<-table.element(a,'breakpoint index',header=TRUE)
a<-table.element(a,'greater',header=TRUE)
a<-table.element(a,'2-sided',header=TRUE)
a<-table.element(a,'less',header=TRUE)
a<-table.row.end(a)
for (mypoint in kp3:nmkm3) {
a<-table.row.start(a)
a<-table.element(a,mypoint,header=TRUE)
a<-table.element(a,gqarr[mypoint-kp3+1,1])
a<-table.element(a,gqarr[mypoint-kp3+1,2])
a<-table.element(a,gqarr[mypoint-kp3+1,3])
a<-table.row.end(a)
}
a<-table.end(a)
table.save(a,file='mytable5.tab')
a<-table.start()
a<-table.row.start(a)
a<-table.element(a,'Meta Analysis of Goldfeld-Quandt test for Heteroskedasticity',4,TRUE)
a<-table.row.end(a)
a<-table.row.start(a)
a<-table.element(a,'Description',header=TRUE)
a<-table.element(a,'# significant tests',header=TRUE)
a<-table.element(a,'% significant tests',header=TRUE)
a<-table.element(a,'OK/NOK',header=TRUE)
a<-table.row.end(a)
a<-table.row.start(a)
a<-table.element(a,'1% type I error level',header=TRUE)
a<-table.element(a,numsignificant1)
a<-table.element(a,numsignificant1/numgqtests)
if (numsignificant1/numgqtests < 0.01) dum <- 'OK' else dum <- 'NOK'
a<-table.element(a,dum)
a<-table.row.end(a)
a<-table.row.start(a)
a<-table.element(a,'5% type I error level',header=TRUE)
a<-table.element(a,numsignificant5)
a<-table.element(a,numsignificant5/numgqtests)
if (numsignificant5/numgqtests < 0.05) dum <- 'OK' else dum <- 'NOK'
a<-table.element(a,dum)
a<-table.row.end(a)
a<-table.row.start(a)
a<-table.element(a,'10% type I error level',header=TRUE)
a<-table.element(a,numsignificant10)
a<-table.element(a,numsignificant10/numgqtests)
if (numsignificant10/numgqtests < 0.1) dum <- 'OK' else dum <- 'NOK'
a<-table.element(a,dum)
a<-table.row.end(a)
a<-table.end(a)
table.save(a,file='mytable6.tab')
}