Free Statistics

of Irreproducible Research!

Author's title

Author*The author of this computation has been verified*
R Software Modulerwasp_autocorrelation.wasp
Title produced by software(Partial) Autocorrelation Function
Date of computationSat, 21 Nov 2009 12:45:06 -0700
Cite this page as followsStatistical Computations at FreeStatistics.org, Office for Research Development and Education, URL https://freestatistics.org/blog/index.php?v=date/2009/Nov/21/t125883278765dqq8ijypswufm.htm/, Retrieved Sat, 27 Apr 2024 22:22:38 +0000
Statistical Computations at FreeStatistics.org, Office for Research Development and Education, URL https://freestatistics.org/blog/index.php?pk=58581, Retrieved Sat, 27 Apr 2024 22:22:38 +0000
QR Codes:

Original text written by user:
IsPrivate?No (this computation is public)
User-defined keywords
Estimated Impact194
Family? (F = Feedback message, R = changed R code, M = changed R Module, P = changed Parameters, D = changed Data)
-       [(Partial) Autocorrelation Function] [Partiële autocorr...] [2009-11-21 19:45:06] [2622964eb3e61db9b0dfd11950e3a18c] [Current]
Feedback Forum

Post a new message
Dataseries X:
5560
3922
3759
4138
4634
3996
4308
4429
5219
4929
5755
5592
4163
4962
5208
4755
4491
5732
5731
5040
6102
4904
5369
5578
4619
4731
5011
5299
4146
4625
4736
4219
5116
4205
4121
5103
4300
4578
3809
5526
4247
3830
4394
4826
4409
4569
4106
4794
3914
3793
4405
4022
4100
4788
3163
3585
3903
4178
3863
4187


Summary of computational transaction
Raw Inputview raw input (R code)
Raw Outputview raw output of R engine
Computing time1 seconds
R Server'Gwilym Jenkins' @ 72.249.127.135

\begin{tabular}{lllllllll}
\hline
Summary of computational transaction \tabularnewline
Raw Input & view raw input (R code)  \tabularnewline
Raw Output & view raw output of R engine  \tabularnewline
Computing time & 1 seconds \tabularnewline
R Server & 'Gwilym Jenkins' @ 72.249.127.135 \tabularnewline
\hline
\end{tabular}
%Source: https://freestatistics.org/blog/index.php?pk=58581&T=0

[TABLE]
[ROW][C]Summary of computational transaction[/C][/ROW]
[ROW][C]Raw Input[/C][C]view raw input (R code) [/C][/ROW]
[ROW][C]Raw Output[/C][C]view raw output of R engine [/C][/ROW]
[ROW][C]Computing time[/C][C]1 seconds[/C][/ROW]
[ROW][C]R Server[/C][C]'Gwilym Jenkins' @ 72.249.127.135[/C][/ROW]
[/TABLE]
Source: https://freestatistics.org/blog/index.php?pk=58581&T=0

Globally Unique Identifier (entire table): ba.freestatistics.org/blog/index.php?pk=58581&T=0

As an alternative you can also use a QR Code:  

The GUIDs for individual cells are displayed in the table below:

Summary of computational transaction
Raw Inputview raw input (R code)
Raw Outputview raw output of R engine
Computing time1 seconds
R Server'Gwilym Jenkins' @ 72.249.127.135


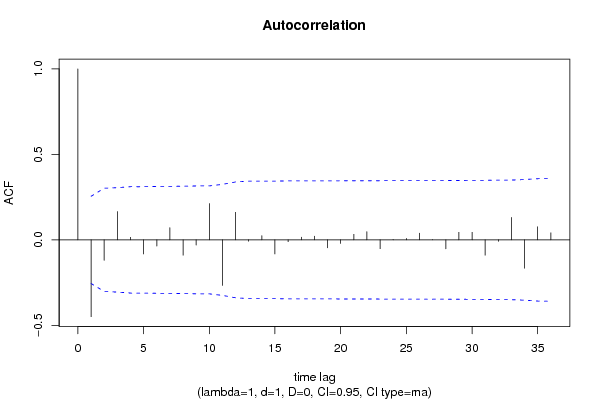
Autocorrelation Function
Time lag kACF(k)T-STATP-value
1-0.449196-3.45030.00052
2-0.119822-0.92040.180564
30.1653761.27030.104486
40.0149230.11460.454567
5-0.082225-0.63160.265049
6-0.036303-0.27880.390668
70.0712660.54740.293082
8-0.089746-0.68930.246653
9-0.030715-0.23590.407152
100.2121321.62940.054277
11-0.266228-2.04490.022665
120.1612711.23870.110173
13-0.007693-0.05910.476539
140.0246840.18960.425135
15-0.082678-0.63510.263922
16-0.01065-0.08180.46754
170.0158050.12140.451893
180.0218760.1680.433566
19-0.04629-0.35560.361718
20-0.020895-0.16050.436518
210.0322290.24760.402669
220.0479690.36850.356925
23-0.051726-0.39730.346283
240.0014850.01140.49547
250.0082920.06370.474715
260.0393110.3020.381875
270.0011620.00890.496454
28-0.052053-0.39980.345365
290.0439010.33720.368578
300.0441920.33940.367741
31-0.089505-0.68750.247231
32-0.008763-0.06730.473282
330.1314211.00950.158436
34-0.165424-1.27060.104421
350.07680.58990.278752
360.0414290.31820.37572

\begin{tabular}{lllllllll}
\hline
Autocorrelation Function \tabularnewline
Time lag k & ACF(k) & T-STAT & P-value \tabularnewline
1 & -0.449196 & -3.4503 & 0.00052 \tabularnewline
2 & -0.119822 & -0.9204 & 0.180564 \tabularnewline
3 & 0.165376 & 1.2703 & 0.104486 \tabularnewline
4 & 0.014923 & 0.1146 & 0.454567 \tabularnewline
5 & -0.082225 & -0.6316 & 0.265049 \tabularnewline
6 & -0.036303 & -0.2788 & 0.390668 \tabularnewline
7 & 0.071266 & 0.5474 & 0.293082 \tabularnewline
8 & -0.089746 & -0.6893 & 0.246653 \tabularnewline
9 & -0.030715 & -0.2359 & 0.407152 \tabularnewline
10 & 0.212132 & 1.6294 & 0.054277 \tabularnewline
11 & -0.266228 & -2.0449 & 0.022665 \tabularnewline
12 & 0.161271 & 1.2387 & 0.110173 \tabularnewline
13 & -0.007693 & -0.0591 & 0.476539 \tabularnewline
14 & 0.024684 & 0.1896 & 0.425135 \tabularnewline
15 & -0.082678 & -0.6351 & 0.263922 \tabularnewline
16 & -0.01065 & -0.0818 & 0.46754 \tabularnewline
17 & 0.015805 & 0.1214 & 0.451893 \tabularnewline
18 & 0.021876 & 0.168 & 0.433566 \tabularnewline
19 & -0.04629 & -0.3556 & 0.361718 \tabularnewline
20 & -0.020895 & -0.1605 & 0.436518 \tabularnewline
21 & 0.032229 & 0.2476 & 0.402669 \tabularnewline
22 & 0.047969 & 0.3685 & 0.356925 \tabularnewline
23 & -0.051726 & -0.3973 & 0.346283 \tabularnewline
24 & 0.001485 & 0.0114 & 0.49547 \tabularnewline
25 & 0.008292 & 0.0637 & 0.474715 \tabularnewline
26 & 0.039311 & 0.302 & 0.381875 \tabularnewline
27 & 0.001162 & 0.0089 & 0.496454 \tabularnewline
28 & -0.052053 & -0.3998 & 0.345365 \tabularnewline
29 & 0.043901 & 0.3372 & 0.368578 \tabularnewline
30 & 0.044192 & 0.3394 & 0.367741 \tabularnewline
31 & -0.089505 & -0.6875 & 0.247231 \tabularnewline
32 & -0.008763 & -0.0673 & 0.473282 \tabularnewline
33 & 0.131421 & 1.0095 & 0.158436 \tabularnewline
34 & -0.165424 & -1.2706 & 0.104421 \tabularnewline
35 & 0.0768 & 0.5899 & 0.278752 \tabularnewline
36 & 0.041429 & 0.3182 & 0.37572 \tabularnewline
\hline
\end{tabular}
%Source: https://freestatistics.org/blog/index.php?pk=58581&T=1

[TABLE]
[ROW][C]Autocorrelation Function[/C][/ROW]
[ROW][C]Time lag k[/C][C]ACF(k)[/C][C]T-STAT[/C][C]P-value[/C][/ROW]
[ROW][C]1[/C][C]-0.449196[/C][C]-3.4503[/C][C]0.00052[/C][/ROW]
[ROW][C]2[/C][C]-0.119822[/C][C]-0.9204[/C][C]0.180564[/C][/ROW]
[ROW][C]3[/C][C]0.165376[/C][C]1.2703[/C][C]0.104486[/C][/ROW]
[ROW][C]4[/C][C]0.014923[/C][C]0.1146[/C][C]0.454567[/C][/ROW]
[ROW][C]5[/C][C]-0.082225[/C][C]-0.6316[/C][C]0.265049[/C][/ROW]
[ROW][C]6[/C][C]-0.036303[/C][C]-0.2788[/C][C]0.390668[/C][/ROW]
[ROW][C]7[/C][C]0.071266[/C][C]0.5474[/C][C]0.293082[/C][/ROW]
[ROW][C]8[/C][C]-0.089746[/C][C]-0.6893[/C][C]0.246653[/C][/ROW]
[ROW][C]9[/C][C]-0.030715[/C][C]-0.2359[/C][C]0.407152[/C][/ROW]
[ROW][C]10[/C][C]0.212132[/C][C]1.6294[/C][C]0.054277[/C][/ROW]
[ROW][C]11[/C][C]-0.266228[/C][C]-2.0449[/C][C]0.022665[/C][/ROW]
[ROW][C]12[/C][C]0.161271[/C][C]1.2387[/C][C]0.110173[/C][/ROW]
[ROW][C]13[/C][C]-0.007693[/C][C]-0.0591[/C][C]0.476539[/C][/ROW]
[ROW][C]14[/C][C]0.024684[/C][C]0.1896[/C][C]0.425135[/C][/ROW]
[ROW][C]15[/C][C]-0.082678[/C][C]-0.6351[/C][C]0.263922[/C][/ROW]
[ROW][C]16[/C][C]-0.01065[/C][C]-0.0818[/C][C]0.46754[/C][/ROW]
[ROW][C]17[/C][C]0.015805[/C][C]0.1214[/C][C]0.451893[/C][/ROW]
[ROW][C]18[/C][C]0.021876[/C][C]0.168[/C][C]0.433566[/C][/ROW]
[ROW][C]19[/C][C]-0.04629[/C][C]-0.3556[/C][C]0.361718[/C][/ROW]
[ROW][C]20[/C][C]-0.020895[/C][C]-0.1605[/C][C]0.436518[/C][/ROW]
[ROW][C]21[/C][C]0.032229[/C][C]0.2476[/C][C]0.402669[/C][/ROW]
[ROW][C]22[/C][C]0.047969[/C][C]0.3685[/C][C]0.356925[/C][/ROW]
[ROW][C]23[/C][C]-0.051726[/C][C]-0.3973[/C][C]0.346283[/C][/ROW]
[ROW][C]24[/C][C]0.001485[/C][C]0.0114[/C][C]0.49547[/C][/ROW]
[ROW][C]25[/C][C]0.008292[/C][C]0.0637[/C][C]0.474715[/C][/ROW]
[ROW][C]26[/C][C]0.039311[/C][C]0.302[/C][C]0.381875[/C][/ROW]
[ROW][C]27[/C][C]0.001162[/C][C]0.0089[/C][C]0.496454[/C][/ROW]
[ROW][C]28[/C][C]-0.052053[/C][C]-0.3998[/C][C]0.345365[/C][/ROW]
[ROW][C]29[/C][C]0.043901[/C][C]0.3372[/C][C]0.368578[/C][/ROW]
[ROW][C]30[/C][C]0.044192[/C][C]0.3394[/C][C]0.367741[/C][/ROW]
[ROW][C]31[/C][C]-0.089505[/C][C]-0.6875[/C][C]0.247231[/C][/ROW]
[ROW][C]32[/C][C]-0.008763[/C][C]-0.0673[/C][C]0.473282[/C][/ROW]
[ROW][C]33[/C][C]0.131421[/C][C]1.0095[/C][C]0.158436[/C][/ROW]
[ROW][C]34[/C][C]-0.165424[/C][C]-1.2706[/C][C]0.104421[/C][/ROW]
[ROW][C]35[/C][C]0.0768[/C][C]0.5899[/C][C]0.278752[/C][/ROW]
[ROW][C]36[/C][C]0.041429[/C][C]0.3182[/C][C]0.37572[/C][/ROW]
[/TABLE]
Source: https://freestatistics.org/blog/index.php?pk=58581&T=1

Globally Unique Identifier (entire table): ba.freestatistics.org/blog/index.php?pk=58581&T=1

As an alternative you can also use a QR Code:  

The GUIDs for individual cells are displayed in the table below:

Autocorrelation Function
Time lag kACF(k)T-STATP-value
1-0.449196-3.45030.00052
2-0.119822-0.92040.180564
30.1653761.27030.104486
40.0149230.11460.454567
5-0.082225-0.63160.265049
6-0.036303-0.27880.390668
70.0712660.54740.293082
8-0.089746-0.68930.246653
9-0.030715-0.23590.407152
100.2121321.62940.054277
11-0.266228-2.04490.022665
120.1612711.23870.110173
13-0.007693-0.05910.476539
140.0246840.18960.425135
15-0.082678-0.63510.263922
16-0.01065-0.08180.46754
170.0158050.12140.451893
180.0218760.1680.433566
19-0.04629-0.35560.361718
20-0.020895-0.16050.436518
210.0322290.24760.402669
220.0479690.36850.356925
23-0.051726-0.39730.346283
240.0014850.01140.49547
250.0082920.06370.474715
260.0393110.3020.381875
270.0011620.00890.496454
28-0.052053-0.39980.345365
290.0439010.33720.368578
300.0441920.33940.367741
31-0.089505-0.68750.247231
32-0.008763-0.06730.473282
330.1314211.00950.158436
34-0.165424-1.27060.104421
350.07680.58990.278752
360.0414290.31820.37572


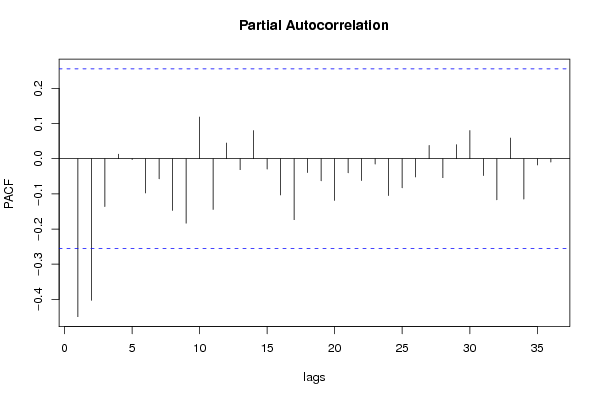
Partial Autocorrelation Function
Time lag kPACF(k)T-STATP-value
1-0.449196-3.45030.00052
2-0.402894-3.09470.001505
3-0.136261-1.04660.149767
40.0128690.09880.460797
5-0.002636-0.02020.491958
6-0.097318-0.74750.228861
7-0.0571-0.43860.33128
8-0.147267-1.13120.131278
9-0.183288-1.40790.08221
100.1184690.910.183268
11-0.144385-1.1090.135956
120.0444680.34160.366947
13-0.031277-0.24020.405487
140.0800430.61480.270518
15-0.029404-0.22590.411048
16-0.103046-0.79150.215909
17-0.173593-1.33340.093764
18-0.039432-0.30290.381523
19-0.063075-0.48450.314916
20-0.118868-0.9130.182469
21-0.040243-0.30910.379163
22-0.062261-0.47820.317124
23-0.015325-0.11770.453348
24-0.104779-0.80480.212077
25-0.082826-0.63620.263553
26-0.052028-0.39960.345434
270.0376820.28940.386628
28-0.053969-0.41450.33999
290.0399350.30670.380059
300.080150.61560.270249
31-0.047944-0.36830.356996
32-0.117018-0.89880.186198
330.0586740.45070.326936
34-0.114685-0.88090.190971
35-0.017779-0.13660.44592
36-0.009698-0.07450.470436

\begin{tabular}{lllllllll}
\hline
Partial Autocorrelation Function \tabularnewline
Time lag k & PACF(k) & T-STAT & P-value \tabularnewline
1 & -0.449196 & -3.4503 & 0.00052 \tabularnewline
2 & -0.402894 & -3.0947 & 0.001505 \tabularnewline
3 & -0.136261 & -1.0466 & 0.149767 \tabularnewline
4 & 0.012869 & 0.0988 & 0.460797 \tabularnewline
5 & -0.002636 & -0.0202 & 0.491958 \tabularnewline
6 & -0.097318 & -0.7475 & 0.228861 \tabularnewline
7 & -0.0571 & -0.4386 & 0.33128 \tabularnewline
8 & -0.147267 & -1.1312 & 0.131278 \tabularnewline
9 & -0.183288 & -1.4079 & 0.08221 \tabularnewline
10 & 0.118469 & 0.91 & 0.183268 \tabularnewline
11 & -0.144385 & -1.109 & 0.135956 \tabularnewline
12 & 0.044468 & 0.3416 & 0.366947 \tabularnewline
13 & -0.031277 & -0.2402 & 0.405487 \tabularnewline
14 & 0.080043 & 0.6148 & 0.270518 \tabularnewline
15 & -0.029404 & -0.2259 & 0.411048 \tabularnewline
16 & -0.103046 & -0.7915 & 0.215909 \tabularnewline
17 & -0.173593 & -1.3334 & 0.093764 \tabularnewline
18 & -0.039432 & -0.3029 & 0.381523 \tabularnewline
19 & -0.063075 & -0.4845 & 0.314916 \tabularnewline
20 & -0.118868 & -0.913 & 0.182469 \tabularnewline
21 & -0.040243 & -0.3091 & 0.379163 \tabularnewline
22 & -0.062261 & -0.4782 & 0.317124 \tabularnewline
23 & -0.015325 & -0.1177 & 0.453348 \tabularnewline
24 & -0.104779 & -0.8048 & 0.212077 \tabularnewline
25 & -0.082826 & -0.6362 & 0.263553 \tabularnewline
26 & -0.052028 & -0.3996 & 0.345434 \tabularnewline
27 & 0.037682 & 0.2894 & 0.386628 \tabularnewline
28 & -0.053969 & -0.4145 & 0.33999 \tabularnewline
29 & 0.039935 & 0.3067 & 0.380059 \tabularnewline
30 & 0.08015 & 0.6156 & 0.270249 \tabularnewline
31 & -0.047944 & -0.3683 & 0.356996 \tabularnewline
32 & -0.117018 & -0.8988 & 0.186198 \tabularnewline
33 & 0.058674 & 0.4507 & 0.326936 \tabularnewline
34 & -0.114685 & -0.8809 & 0.190971 \tabularnewline
35 & -0.017779 & -0.1366 & 0.44592 \tabularnewline
36 & -0.009698 & -0.0745 & 0.470436 \tabularnewline
\hline
\end{tabular}
%Source: https://freestatistics.org/blog/index.php?pk=58581&T=2

[TABLE]
[ROW][C]Partial Autocorrelation Function[/C][/ROW]
[ROW][C]Time lag k[/C][C]PACF(k)[/C][C]T-STAT[/C][C]P-value[/C][/ROW]
[ROW][C]1[/C][C]-0.449196[/C][C]-3.4503[/C][C]0.00052[/C][/ROW]
[ROW][C]2[/C][C]-0.402894[/C][C]-3.0947[/C][C]0.001505[/C][/ROW]
[ROW][C]3[/C][C]-0.136261[/C][C]-1.0466[/C][C]0.149767[/C][/ROW]
[ROW][C]4[/C][C]0.012869[/C][C]0.0988[/C][C]0.460797[/C][/ROW]
[ROW][C]5[/C][C]-0.002636[/C][C]-0.0202[/C][C]0.491958[/C][/ROW]
[ROW][C]6[/C][C]-0.097318[/C][C]-0.7475[/C][C]0.228861[/C][/ROW]
[ROW][C]7[/C][C]-0.0571[/C][C]-0.4386[/C][C]0.33128[/C][/ROW]
[ROW][C]8[/C][C]-0.147267[/C][C]-1.1312[/C][C]0.131278[/C][/ROW]
[ROW][C]9[/C][C]-0.183288[/C][C]-1.4079[/C][C]0.08221[/C][/ROW]
[ROW][C]10[/C][C]0.118469[/C][C]0.91[/C][C]0.183268[/C][/ROW]
[ROW][C]11[/C][C]-0.144385[/C][C]-1.109[/C][C]0.135956[/C][/ROW]
[ROW][C]12[/C][C]0.044468[/C][C]0.3416[/C][C]0.366947[/C][/ROW]
[ROW][C]13[/C][C]-0.031277[/C][C]-0.2402[/C][C]0.405487[/C][/ROW]
[ROW][C]14[/C][C]0.080043[/C][C]0.6148[/C][C]0.270518[/C][/ROW]
[ROW][C]15[/C][C]-0.029404[/C][C]-0.2259[/C][C]0.411048[/C][/ROW]
[ROW][C]16[/C][C]-0.103046[/C][C]-0.7915[/C][C]0.215909[/C][/ROW]
[ROW][C]17[/C][C]-0.173593[/C][C]-1.3334[/C][C]0.093764[/C][/ROW]
[ROW][C]18[/C][C]-0.039432[/C][C]-0.3029[/C][C]0.381523[/C][/ROW]
[ROW][C]19[/C][C]-0.063075[/C][C]-0.4845[/C][C]0.314916[/C][/ROW]
[ROW][C]20[/C][C]-0.118868[/C][C]-0.913[/C][C]0.182469[/C][/ROW]
[ROW][C]21[/C][C]-0.040243[/C][C]-0.3091[/C][C]0.379163[/C][/ROW]
[ROW][C]22[/C][C]-0.062261[/C][C]-0.4782[/C][C]0.317124[/C][/ROW]
[ROW][C]23[/C][C]-0.015325[/C][C]-0.1177[/C][C]0.453348[/C][/ROW]
[ROW][C]24[/C][C]-0.104779[/C][C]-0.8048[/C][C]0.212077[/C][/ROW]
[ROW][C]25[/C][C]-0.082826[/C][C]-0.6362[/C][C]0.263553[/C][/ROW]
[ROW][C]26[/C][C]-0.052028[/C][C]-0.3996[/C][C]0.345434[/C][/ROW]
[ROW][C]27[/C][C]0.037682[/C][C]0.2894[/C][C]0.386628[/C][/ROW]
[ROW][C]28[/C][C]-0.053969[/C][C]-0.4145[/C][C]0.33999[/C][/ROW]
[ROW][C]29[/C][C]0.039935[/C][C]0.3067[/C][C]0.380059[/C][/ROW]
[ROW][C]30[/C][C]0.08015[/C][C]0.6156[/C][C]0.270249[/C][/ROW]
[ROW][C]31[/C][C]-0.047944[/C][C]-0.3683[/C][C]0.356996[/C][/ROW]
[ROW][C]32[/C][C]-0.117018[/C][C]-0.8988[/C][C]0.186198[/C][/ROW]
[ROW][C]33[/C][C]0.058674[/C][C]0.4507[/C][C]0.326936[/C][/ROW]
[ROW][C]34[/C][C]-0.114685[/C][C]-0.8809[/C][C]0.190971[/C][/ROW]
[ROW][C]35[/C][C]-0.017779[/C][C]-0.1366[/C][C]0.44592[/C][/ROW]
[ROW][C]36[/C][C]-0.009698[/C][C]-0.0745[/C][C]0.470436[/C][/ROW]
[/TABLE]
Source: https://freestatistics.org/blog/index.php?pk=58581&T=2

Globally Unique Identifier (entire table): ba.freestatistics.org/blog/index.php?pk=58581&T=2

As an alternative you can also use a QR Code:  

The GUIDs for individual cells are displayed in the table below:

Partial Autocorrelation Function
Time lag kPACF(k)T-STATP-value
1-0.449196-3.45030.00052
2-0.402894-3.09470.001505
3-0.136261-1.04660.149767
40.0128690.09880.460797
5-0.002636-0.02020.491958
6-0.097318-0.74750.228861
7-0.0571-0.43860.33128
8-0.147267-1.13120.131278
9-0.183288-1.40790.08221
100.1184690.910.183268
11-0.144385-1.1090.135956
120.0444680.34160.366947
13-0.031277-0.24020.405487
140.0800430.61480.270518
15-0.029404-0.22590.411048
16-0.103046-0.79150.215909
17-0.173593-1.33340.093764
18-0.039432-0.30290.381523
19-0.063075-0.48450.314916
20-0.118868-0.9130.182469
21-0.040243-0.30910.379163
22-0.062261-0.47820.317124
23-0.015325-0.11770.453348
24-0.104779-0.80480.212077
25-0.082826-0.63620.263553
26-0.052028-0.39960.345434
270.0376820.28940.386628
28-0.053969-0.41450.33999
290.0399350.30670.380059
300.080150.61560.270249
31-0.047944-0.36830.356996
32-0.117018-0.89880.186198
330.0586740.45070.326936
34-0.114685-0.88090.190971
35-0.017779-0.13660.44592
36-0.009698-0.07450.470436


Parameters (Session):
par1 = 36 ; par2 = 1 ; par3 = 1 ; par4 = 0 ; par5 = 12 ; par6 = MA ; par7 = 0.95 ;
Parameters (R input):
par1 = 36 ; par2 = 1 ; par3 = 1 ; par4 = 0 ; par5 = 12 ; par6 = MA ; par7 = 0.95 ;
R code (references can be found in the software module):
if (par1 == 'Default') {
par1 = 10*log10(length(x))
} else {
par1 <- as.numeric(par1)
}
par2 <- as.numeric(par2)
par3 <- as.numeric(par3)
par4 <- as.numeric(par4)
par5 <- as.numeric(par5)
if (par6 == 'White Noise') par6 <- 'white' else par6 <- 'ma'
par7 <- as.numeric(par7)
if (par2 == 0) {
x <- log(x)
} else {
x <- (x ^ par2 - 1) / par2
}
if (par3 > 0) x <- diff(x,lag=1,difference=par3)
if (par4 > 0) x <- diff(x,lag=par5,difference=par4)
bitmap(file='pic1.png')
racf <- acf(x, par1, main='Autocorrelation', xlab='time lag', ylab='ACF', ci.type=par6, ci=par7, sub=paste('(lambda=',par2,', d=',par3,', D=',par4,', CI=', par7, ', CI type=',par6,')',sep=''))
dev.off()
bitmap(file='pic2.png')
rpacf <- pacf(x,par1,main='Partial Autocorrelation',xlab='lags',ylab='PACF')
dev.off()
(myacf <- c(racf$acf))
(mypacf <- c(rpacf$acf))
lengthx <- length(x)
sqrtn <- sqrt(lengthx)
load(file='createtable')
a<-table.start()
a<-table.row.start(a)
a<-table.element(a,'Autocorrelation Function',4,TRUE)
a<-table.row.end(a)
a<-table.row.start(a)
a<-table.element(a,'Time lag k',header=TRUE)
a<-table.element(a,hyperlink('basics.htm','ACF(k)','click here for more information about the Autocorrelation Function'),header=TRUE)
a<-table.element(a,'T-STAT',header=TRUE)
a<-table.element(a,'P-value',header=TRUE)
a<-table.row.end(a)
for (i in 2:(par1+1)) {
a<-table.row.start(a)
a<-table.element(a,i-1,header=TRUE)
a<-table.element(a,round(myacf[i],6))
mytstat <- myacf[i]*sqrtn
a<-table.element(a,round(mytstat,4))
a<-table.element(a,round(1-pt(abs(mytstat),lengthx),6))
a<-table.row.end(a)
}
a<-table.end(a)
table.save(a,file='mytable.tab')
a<-table.start()
a<-table.row.start(a)
a<-table.element(a,'Partial Autocorrelation Function',4,TRUE)
a<-table.row.end(a)
a<-table.row.start(a)
a<-table.element(a,'Time lag k',header=TRUE)
a<-table.element(a,hyperlink('basics.htm','PACF(k)','click here for more information about the Partial Autocorrelation Function'),header=TRUE)
a<-table.element(a,'T-STAT',header=TRUE)
a<-table.element(a,'P-value',header=TRUE)
a<-table.row.end(a)
for (i in 1:par1) {
a<-table.row.start(a)
a<-table.element(a,i,header=TRUE)
a<-table.element(a,round(mypacf[i],6))
mytstat <- mypacf[i]*sqrtn
a<-table.element(a,round(mytstat,4))
a<-table.element(a,round(1-pt(abs(mytstat),lengthx),6))
a<-table.row.end(a)
}
a<-table.end(a)
table.save(a,file='mytable1.tab')