Free Statistics

of Irreproducible Research!

Author's title

Author*Unverified author*
R Software Modulerwasp_autocorrelation.wasp
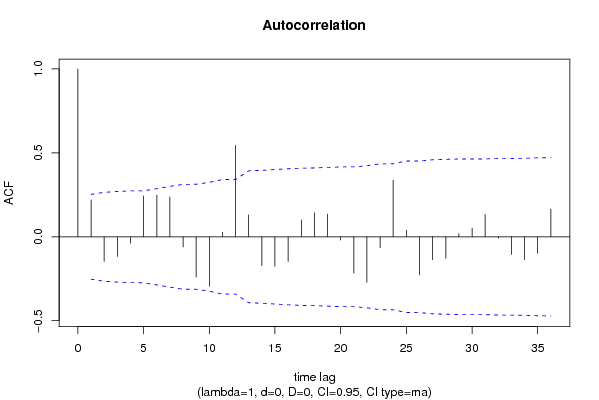
Title produced by software(Partial) Autocorrelation Function
Date of computationWed, 25 Nov 2009 03:24:38 -0700
Cite this page as followsStatistical Computations at FreeStatistics.org, Office for Research Development and Education, URL https://freestatistics.org/blog/index.php?v=date/2009/Nov/25/t1259144699at2iz6ayp7yqzza.htm/, Retrieved Tue, 07 May 2024 22:15:38 +0000
Statistical Computations at FreeStatistics.org, Office for Research Development and Education, URL https://freestatistics.org/blog/index.php?pk=59307, Retrieved Tue, 07 May 2024 22:15:38 +0000
QR Codes:

Original text written by user:
IsPrivate?No (this computation is public)
User-defined keywords
Estimated Impact180
Family? (F = Feedback message, R = changed R code, M = changed R Module, P = changed Parameters, D = changed Data)
-       [(Partial) Autocorrelation Function] [] [2009-11-25 10:24:38] [bcd1d1f32b8895c4dcae2fb4eb5db30a] [Current]
- R  D    [(Partial) Autocorrelation Function] [] [2009-12-16 14:56:55] [1eac2882020791f6c49a90a91c34285a]
Feedback Forum

Post a new message
Dataseries X:
99.9
98.6
107.2
95.7
93.7
106.7
86.7
95.3
99.3
101.8
96
91.7
95.3
96.6
107.2
108
98.4
103.1
81.1
96.6
103.7
106.6
97.6
87.6
99.4
98.5
105.2
104.6
97.5
108.9
86.8
88.9
110.3
114.8
94.6
92
93.8
93.8
107.6
101
95.4
96.5
89.2
87.1
110.5
110.8
104.2
88.9
89.8
90
93.9
91.3
87.8
99.7
73.5
79.2
96.9
95.2
95.6
89.7


Summary of computational transaction
Raw Inputview raw input (R code)
Raw Outputview raw output of R engine
Computing time1 seconds
R Server'Gwilym Jenkins' @ 72.249.127.135

\begin{tabular}{lllllllll}
\hline
Summary of computational transaction \tabularnewline
Raw Input & view raw input (R code)  \tabularnewline
Raw Output & view raw output of R engine  \tabularnewline
Computing time & 1 seconds \tabularnewline
R Server & 'Gwilym Jenkins' @ 72.249.127.135 \tabularnewline
\hline
\end{tabular}
%Source: https://freestatistics.org/blog/index.php?pk=59307&T=0

[TABLE]
[ROW][C]Summary of computational transaction[/C][/ROW]
[ROW][C]Raw Input[/C][C]view raw input (R code) [/C][/ROW]
[ROW][C]Raw Output[/C][C]view raw output of R engine [/C][/ROW]
[ROW][C]Computing time[/C][C]1 seconds[/C][/ROW]
[ROW][C]R Server[/C][C]'Gwilym Jenkins' @ 72.249.127.135[/C][/ROW]
[/TABLE]
Source: https://freestatistics.org/blog/index.php?pk=59307&T=0

Globally Unique Identifier (entire table): ba.freestatistics.org/blog/index.php?pk=59307&T=0

As an alternative you can also use a QR Code:  

The GUIDs for individual cells are displayed in the table below:

Summary of computational transaction
Raw Inputview raw input (R code)
Raw Outputview raw output of R engine
Computing time1 seconds
R Server'Gwilym Jenkins' @ 72.249.127.135


Autocorrelation Function
Time lag kACF(k)T-STATP-value
10.2194441.69980.047173
2-0.145833-1.12960.131567
3-0.116741-0.90430.184734
4-0.038262-0.29640.383983
50.2431961.88380.032221
60.2475861.91780.02995
70.2371971.83730.035558
8-0.060466-0.46840.320608
9-0.239838-1.85780.034054
10-0.29482-2.28370.012973
110.0265640.20580.418837
120.5449024.22084.2e-05
130.1299191.00630.159145
14-0.171942-1.33190.093972
15-0.175698-1.3610.089309
16-0.146782-1.1370.130036
170.1003780.77750.219951
180.1427721.10590.136591
190.1355081.04960.149046
20-0.019613-0.15190.43988
21-0.215801-1.67160.049907
22-0.270812-2.09770.020076
23-0.0647-0.50120.309044
240.336592.60720.00575
250.038670.29950.382784
26-0.226892-1.75750.041967
27-0.136741-1.05920.146878
28-0.127239-0.98560.164146
290.0185510.14370.443113
300.0513220.39750.34619
310.1325241.02650.154383
32-0.00756-0.05860.476749
33-0.106056-0.82150.207305
34-0.136602-1.05810.147122
35-0.098448-0.76260.224353
360.1653411.28070.102609

\begin{tabular}{lllllllll}
\hline
Autocorrelation Function \tabularnewline
Time lag k & ACF(k) & T-STAT & P-value \tabularnewline
1 & 0.219444 & 1.6998 & 0.047173 \tabularnewline
2 & -0.145833 & -1.1296 & 0.131567 \tabularnewline
3 & -0.116741 & -0.9043 & 0.184734 \tabularnewline
4 & -0.038262 & -0.2964 & 0.383983 \tabularnewline
5 & 0.243196 & 1.8838 & 0.032221 \tabularnewline
6 & 0.247586 & 1.9178 & 0.02995 \tabularnewline
7 & 0.237197 & 1.8373 & 0.035558 \tabularnewline
8 & -0.060466 & -0.4684 & 0.320608 \tabularnewline
9 & -0.239838 & -1.8578 & 0.034054 \tabularnewline
10 & -0.29482 & -2.2837 & 0.012973 \tabularnewline
11 & 0.026564 & 0.2058 & 0.418837 \tabularnewline
12 & 0.544902 & 4.2208 & 4.2e-05 \tabularnewline
13 & 0.129919 & 1.0063 & 0.159145 \tabularnewline
14 & -0.171942 & -1.3319 & 0.093972 \tabularnewline
15 & -0.175698 & -1.361 & 0.089309 \tabularnewline
16 & -0.146782 & -1.137 & 0.130036 \tabularnewline
17 & 0.100378 & 0.7775 & 0.219951 \tabularnewline
18 & 0.142772 & 1.1059 & 0.136591 \tabularnewline
19 & 0.135508 & 1.0496 & 0.149046 \tabularnewline
20 & -0.019613 & -0.1519 & 0.43988 \tabularnewline
21 & -0.215801 & -1.6716 & 0.049907 \tabularnewline
22 & -0.270812 & -2.0977 & 0.020076 \tabularnewline
23 & -0.0647 & -0.5012 & 0.309044 \tabularnewline
24 & 0.33659 & 2.6072 & 0.00575 \tabularnewline
25 & 0.03867 & 0.2995 & 0.382784 \tabularnewline
26 & -0.226892 & -1.7575 & 0.041967 \tabularnewline
27 & -0.136741 & -1.0592 & 0.146878 \tabularnewline
28 & -0.127239 & -0.9856 & 0.164146 \tabularnewline
29 & 0.018551 & 0.1437 & 0.443113 \tabularnewline
30 & 0.051322 & 0.3975 & 0.34619 \tabularnewline
31 & 0.132524 & 1.0265 & 0.154383 \tabularnewline
32 & -0.00756 & -0.0586 & 0.476749 \tabularnewline
33 & -0.106056 & -0.8215 & 0.207305 \tabularnewline
34 & -0.136602 & -1.0581 & 0.147122 \tabularnewline
35 & -0.098448 & -0.7626 & 0.224353 \tabularnewline
36 & 0.165341 & 1.2807 & 0.102609 \tabularnewline
\hline
\end{tabular}
%Source: https://freestatistics.org/blog/index.php?pk=59307&T=1

[TABLE]
[ROW][C]Autocorrelation Function[/C][/ROW]
[ROW][C]Time lag k[/C][C]ACF(k)[/C][C]T-STAT[/C][C]P-value[/C][/ROW]
[ROW][C]1[/C][C]0.219444[/C][C]1.6998[/C][C]0.047173[/C][/ROW]
[ROW][C]2[/C][C]-0.145833[/C][C]-1.1296[/C][C]0.131567[/C][/ROW]
[ROW][C]3[/C][C]-0.116741[/C][C]-0.9043[/C][C]0.184734[/C][/ROW]
[ROW][C]4[/C][C]-0.038262[/C][C]-0.2964[/C][C]0.383983[/C][/ROW]
[ROW][C]5[/C][C]0.243196[/C][C]1.8838[/C][C]0.032221[/C][/ROW]
[ROW][C]6[/C][C]0.247586[/C][C]1.9178[/C][C]0.02995[/C][/ROW]
[ROW][C]7[/C][C]0.237197[/C][C]1.8373[/C][C]0.035558[/C][/ROW]
[ROW][C]8[/C][C]-0.060466[/C][C]-0.4684[/C][C]0.320608[/C][/ROW]
[ROW][C]9[/C][C]-0.239838[/C][C]-1.8578[/C][C]0.034054[/C][/ROW]
[ROW][C]10[/C][C]-0.29482[/C][C]-2.2837[/C][C]0.012973[/C][/ROW]
[ROW][C]11[/C][C]0.026564[/C][C]0.2058[/C][C]0.418837[/C][/ROW]
[ROW][C]12[/C][C]0.544902[/C][C]4.2208[/C][C]4.2e-05[/C][/ROW]
[ROW][C]13[/C][C]0.129919[/C][C]1.0063[/C][C]0.159145[/C][/ROW]
[ROW][C]14[/C][C]-0.171942[/C][C]-1.3319[/C][C]0.093972[/C][/ROW]
[ROW][C]15[/C][C]-0.175698[/C][C]-1.361[/C][C]0.089309[/C][/ROW]
[ROW][C]16[/C][C]-0.146782[/C][C]-1.137[/C][C]0.130036[/C][/ROW]
[ROW][C]17[/C][C]0.100378[/C][C]0.7775[/C][C]0.219951[/C][/ROW]
[ROW][C]18[/C][C]0.142772[/C][C]1.1059[/C][C]0.136591[/C][/ROW]
[ROW][C]19[/C][C]0.135508[/C][C]1.0496[/C][C]0.149046[/C][/ROW]
[ROW][C]20[/C][C]-0.019613[/C][C]-0.1519[/C][C]0.43988[/C][/ROW]
[ROW][C]21[/C][C]-0.215801[/C][C]-1.6716[/C][C]0.049907[/C][/ROW]
[ROW][C]22[/C][C]-0.270812[/C][C]-2.0977[/C][C]0.020076[/C][/ROW]
[ROW][C]23[/C][C]-0.0647[/C][C]-0.5012[/C][C]0.309044[/C][/ROW]
[ROW][C]24[/C][C]0.33659[/C][C]2.6072[/C][C]0.00575[/C][/ROW]
[ROW][C]25[/C][C]0.03867[/C][C]0.2995[/C][C]0.382784[/C][/ROW]
[ROW][C]26[/C][C]-0.226892[/C][C]-1.7575[/C][C]0.041967[/C][/ROW]
[ROW][C]27[/C][C]-0.136741[/C][C]-1.0592[/C][C]0.146878[/C][/ROW]
[ROW][C]28[/C][C]-0.127239[/C][C]-0.9856[/C][C]0.164146[/C][/ROW]
[ROW][C]29[/C][C]0.018551[/C][C]0.1437[/C][C]0.443113[/C][/ROW]
[ROW][C]30[/C][C]0.051322[/C][C]0.3975[/C][C]0.34619[/C][/ROW]
[ROW][C]31[/C][C]0.132524[/C][C]1.0265[/C][C]0.154383[/C][/ROW]
[ROW][C]32[/C][C]-0.00756[/C][C]-0.0586[/C][C]0.476749[/C][/ROW]
[ROW][C]33[/C][C]-0.106056[/C][C]-0.8215[/C][C]0.207305[/C][/ROW]
[ROW][C]34[/C][C]-0.136602[/C][C]-1.0581[/C][C]0.147122[/C][/ROW]
[ROW][C]35[/C][C]-0.098448[/C][C]-0.7626[/C][C]0.224353[/C][/ROW]
[ROW][C]36[/C][C]0.165341[/C][C]1.2807[/C][C]0.102609[/C][/ROW]
[/TABLE]
Source: https://freestatistics.org/blog/index.php?pk=59307&T=1

Globally Unique Identifier (entire table): ba.freestatistics.org/blog/index.php?pk=59307&T=1

As an alternative you can also use a QR Code:  

The GUIDs for individual cells are displayed in the table below:

Autocorrelation Function
Time lag kACF(k)T-STATP-value
10.2194441.69980.047173
2-0.145833-1.12960.131567
3-0.116741-0.90430.184734
4-0.038262-0.29640.383983
50.2431961.88380.032221
60.2475861.91780.02995
70.2371971.83730.035558
8-0.060466-0.46840.320608
9-0.239838-1.85780.034054
10-0.29482-2.28370.012973
110.0265640.20580.418837
120.5449024.22084.2e-05
130.1299191.00630.159145
14-0.171942-1.33190.093972
15-0.175698-1.3610.089309
16-0.146782-1.1370.130036
170.1003780.77750.219951
180.1427721.10590.136591
190.1355081.04960.149046
20-0.019613-0.15190.43988
21-0.215801-1.67160.049907
22-0.270812-2.09770.020076
23-0.0647-0.50120.309044
240.336592.60720.00575
250.038670.29950.382784
26-0.226892-1.75750.041967
27-0.136741-1.05920.146878
28-0.127239-0.98560.164146
290.0185510.14370.443113
300.0513220.39750.34619
310.1325241.02650.154383
32-0.00756-0.05860.476749
33-0.106056-0.82150.207305
34-0.136602-1.05810.147122
35-0.098448-0.76260.224353
360.1653411.28070.102609


Partial Autocorrelation Function
Time lag kPACF(k)T-STATP-value
10.2194441.69980.047173
2-0.203803-1.57870.059837
3-0.036713-0.28440.388551
4-0.031333-0.24270.404532
50.2552211.97690.026325
60.1276850.9890.163307
70.2635172.04120.022818
8-0.098967-0.76660.223164
9-0.114457-0.88660.189423
10-0.364145-2.82070.003244
110.0186760.14470.442732
120.4302073.33240.000739
13-0.053039-0.41080.341326
14-0.0339-0.26260.396884
150.0336220.26040.397709
16-0.041833-0.3240.373518
17-0.009763-0.07560.469985
18-0.105791-0.81940.207887
19-0.110699-0.85750.197298
200.0064360.04990.480203
210.0124880.09670.461632
220.0224420.17380.43129
23-0.042733-0.3310.370896
240.062870.4870.314021
25-0.144571-1.11980.133622
26-0.142333-1.10250.137323
270.0489490.37920.352955
280.0377510.29240.385489
29-0.023565-0.18250.427889
30-0.010556-0.08180.467553
310.1358661.05240.148416
32-0.055472-0.42970.334483
330.1090220.84450.200878
34-0.004559-0.03530.485973
35-0.191295-1.48180.071818
36-0.212401-1.64520.052574

\begin{tabular}{lllllllll}
\hline
Partial Autocorrelation Function \tabularnewline
Time lag k & PACF(k) & T-STAT & P-value \tabularnewline
1 & 0.219444 & 1.6998 & 0.047173 \tabularnewline
2 & -0.203803 & -1.5787 & 0.059837 \tabularnewline
3 & -0.036713 & -0.2844 & 0.388551 \tabularnewline
4 & -0.031333 & -0.2427 & 0.404532 \tabularnewline
5 & 0.255221 & 1.9769 & 0.026325 \tabularnewline
6 & 0.127685 & 0.989 & 0.163307 \tabularnewline
7 & 0.263517 & 2.0412 & 0.022818 \tabularnewline
8 & -0.098967 & -0.7666 & 0.223164 \tabularnewline
9 & -0.114457 & -0.8866 & 0.189423 \tabularnewline
10 & -0.364145 & -2.8207 & 0.003244 \tabularnewline
11 & 0.018676 & 0.1447 & 0.442732 \tabularnewline
12 & 0.430207 & 3.3324 & 0.000739 \tabularnewline
13 & -0.053039 & -0.4108 & 0.341326 \tabularnewline
14 & -0.0339 & -0.2626 & 0.396884 \tabularnewline
15 & 0.033622 & 0.2604 & 0.397709 \tabularnewline
16 & -0.041833 & -0.324 & 0.373518 \tabularnewline
17 & -0.009763 & -0.0756 & 0.469985 \tabularnewline
18 & -0.105791 & -0.8194 & 0.207887 \tabularnewline
19 & -0.110699 & -0.8575 & 0.197298 \tabularnewline
20 & 0.006436 & 0.0499 & 0.480203 \tabularnewline
21 & 0.012488 & 0.0967 & 0.461632 \tabularnewline
22 & 0.022442 & 0.1738 & 0.43129 \tabularnewline
23 & -0.042733 & -0.331 & 0.370896 \tabularnewline
24 & 0.06287 & 0.487 & 0.314021 \tabularnewline
25 & -0.144571 & -1.1198 & 0.133622 \tabularnewline
26 & -0.142333 & -1.1025 & 0.137323 \tabularnewline
27 & 0.048949 & 0.3792 & 0.352955 \tabularnewline
28 & 0.037751 & 0.2924 & 0.385489 \tabularnewline
29 & -0.023565 & -0.1825 & 0.427889 \tabularnewline
30 & -0.010556 & -0.0818 & 0.467553 \tabularnewline
31 & 0.135866 & 1.0524 & 0.148416 \tabularnewline
32 & -0.055472 & -0.4297 & 0.334483 \tabularnewline
33 & 0.109022 & 0.8445 & 0.200878 \tabularnewline
34 & -0.004559 & -0.0353 & 0.485973 \tabularnewline
35 & -0.191295 & -1.4818 & 0.071818 \tabularnewline
36 & -0.212401 & -1.6452 & 0.052574 \tabularnewline
\hline
\end{tabular}
%Source: https://freestatistics.org/blog/index.php?pk=59307&T=2

[TABLE]
[ROW][C]Partial Autocorrelation Function[/C][/ROW]
[ROW][C]Time lag k[/C][C]PACF(k)[/C][C]T-STAT[/C][C]P-value[/C][/ROW]
[ROW][C]1[/C][C]0.219444[/C][C]1.6998[/C][C]0.047173[/C][/ROW]
[ROW][C]2[/C][C]-0.203803[/C][C]-1.5787[/C][C]0.059837[/C][/ROW]
[ROW][C]3[/C][C]-0.036713[/C][C]-0.2844[/C][C]0.388551[/C][/ROW]
[ROW][C]4[/C][C]-0.031333[/C][C]-0.2427[/C][C]0.404532[/C][/ROW]
[ROW][C]5[/C][C]0.255221[/C][C]1.9769[/C][C]0.026325[/C][/ROW]
[ROW][C]6[/C][C]0.127685[/C][C]0.989[/C][C]0.163307[/C][/ROW]
[ROW][C]7[/C][C]0.263517[/C][C]2.0412[/C][C]0.022818[/C][/ROW]
[ROW][C]8[/C][C]-0.098967[/C][C]-0.7666[/C][C]0.223164[/C][/ROW]
[ROW][C]9[/C][C]-0.114457[/C][C]-0.8866[/C][C]0.189423[/C][/ROW]
[ROW][C]10[/C][C]-0.364145[/C][C]-2.8207[/C][C]0.003244[/C][/ROW]
[ROW][C]11[/C][C]0.018676[/C][C]0.1447[/C][C]0.442732[/C][/ROW]
[ROW][C]12[/C][C]0.430207[/C][C]3.3324[/C][C]0.000739[/C][/ROW]
[ROW][C]13[/C][C]-0.053039[/C][C]-0.4108[/C][C]0.341326[/C][/ROW]
[ROW][C]14[/C][C]-0.0339[/C][C]-0.2626[/C][C]0.396884[/C][/ROW]
[ROW][C]15[/C][C]0.033622[/C][C]0.2604[/C][C]0.397709[/C][/ROW]
[ROW][C]16[/C][C]-0.041833[/C][C]-0.324[/C][C]0.373518[/C][/ROW]
[ROW][C]17[/C][C]-0.009763[/C][C]-0.0756[/C][C]0.469985[/C][/ROW]
[ROW][C]18[/C][C]-0.105791[/C][C]-0.8194[/C][C]0.207887[/C][/ROW]
[ROW][C]19[/C][C]-0.110699[/C][C]-0.8575[/C][C]0.197298[/C][/ROW]
[ROW][C]20[/C][C]0.006436[/C][C]0.0499[/C][C]0.480203[/C][/ROW]
[ROW][C]21[/C][C]0.012488[/C][C]0.0967[/C][C]0.461632[/C][/ROW]
[ROW][C]22[/C][C]0.022442[/C][C]0.1738[/C][C]0.43129[/C][/ROW]
[ROW][C]23[/C][C]-0.042733[/C][C]-0.331[/C][C]0.370896[/C][/ROW]
[ROW][C]24[/C][C]0.06287[/C][C]0.487[/C][C]0.314021[/C][/ROW]
[ROW][C]25[/C][C]-0.144571[/C][C]-1.1198[/C][C]0.133622[/C][/ROW]
[ROW][C]26[/C][C]-0.142333[/C][C]-1.1025[/C][C]0.137323[/C][/ROW]
[ROW][C]27[/C][C]0.048949[/C][C]0.3792[/C][C]0.352955[/C][/ROW]
[ROW][C]28[/C][C]0.037751[/C][C]0.2924[/C][C]0.385489[/C][/ROW]
[ROW][C]29[/C][C]-0.023565[/C][C]-0.1825[/C][C]0.427889[/C][/ROW]
[ROW][C]30[/C][C]-0.010556[/C][C]-0.0818[/C][C]0.467553[/C][/ROW]
[ROW][C]31[/C][C]0.135866[/C][C]1.0524[/C][C]0.148416[/C][/ROW]
[ROW][C]32[/C][C]-0.055472[/C][C]-0.4297[/C][C]0.334483[/C][/ROW]
[ROW][C]33[/C][C]0.109022[/C][C]0.8445[/C][C]0.200878[/C][/ROW]
[ROW][C]34[/C][C]-0.004559[/C][C]-0.0353[/C][C]0.485973[/C][/ROW]
[ROW][C]35[/C][C]-0.191295[/C][C]-1.4818[/C][C]0.071818[/C][/ROW]
[ROW][C]36[/C][C]-0.212401[/C][C]-1.6452[/C][C]0.052574[/C][/ROW]
[/TABLE]
Source: https://freestatistics.org/blog/index.php?pk=59307&T=2

Globally Unique Identifier (entire table): ba.freestatistics.org/blog/index.php?pk=59307&T=2

As an alternative you can also use a QR Code:  

The GUIDs for individual cells are displayed in the table below:

Partial Autocorrelation Function
Time lag kPACF(k)T-STATP-value
10.2194441.69980.047173
2-0.203803-1.57870.059837
3-0.036713-0.28440.388551
4-0.031333-0.24270.404532
50.2552211.97690.026325
60.1276850.9890.163307
70.2635172.04120.022818
8-0.098967-0.76660.223164
9-0.114457-0.88660.189423
10-0.364145-2.82070.003244
110.0186760.14470.442732
120.4302073.33240.000739
13-0.053039-0.41080.341326
14-0.0339-0.26260.396884
150.0336220.26040.397709
16-0.041833-0.3240.373518
17-0.009763-0.07560.469985
18-0.105791-0.81940.207887
19-0.110699-0.85750.197298
200.0064360.04990.480203
210.0124880.09670.461632
220.0224420.17380.43129
23-0.042733-0.3310.370896
240.062870.4870.314021
25-0.144571-1.11980.133622
26-0.142333-1.10250.137323
270.0489490.37920.352955
280.0377510.29240.385489
29-0.023565-0.18250.427889
30-0.010556-0.08180.467553
310.1358661.05240.148416
32-0.055472-0.42970.334483
330.1090220.84450.200878
34-0.004559-0.03530.485973
35-0.191295-1.48180.071818
36-0.212401-1.64520.052574


Parameters (Session):
par1 = 36 ; par2 = 1 ; par3 = 0 ; par4 = 0 ; par5 = 12 ; par6 = MA ; par7 = 0.95 ;
Parameters (R input):
par1 = 36 ; par2 = 1 ; par3 = 0 ; par4 = 0 ; par5 = 12 ; par6 = MA ; par7 = 0.95 ;
R code (references can be found in the software module):
if (par1 == 'Default') {
par1 = 10*log10(length(x))
} else {
par1 <- as.numeric(par1)
}
par2 <- as.numeric(par2)
par3 <- as.numeric(par3)
par4 <- as.numeric(par4)
par5 <- as.numeric(par5)
if (par6 == 'White Noise') par6 <- 'white' else par6 <- 'ma'
par7 <- as.numeric(par7)
if (par2 == 0) {
x <- log(x)
} else {
x <- (x ^ par2 - 1) / par2
}
if (par3 > 0) x <- diff(x,lag=1,difference=par3)
if (par4 > 0) x <- diff(x,lag=par5,difference=par4)
bitmap(file='pic1.png')
racf <- acf(x, par1, main='Autocorrelation', xlab='time lag', ylab='ACF', ci.type=par6, ci=par7, sub=paste('(lambda=',par2,', d=',par3,', D=',par4,', CI=', par7, ', CI type=',par6,')',sep=''))
dev.off()
bitmap(file='pic2.png')
rpacf <- pacf(x,par1,main='Partial Autocorrelation',xlab='lags',ylab='PACF')
dev.off()
(myacf <- c(racf$acf))
(mypacf <- c(rpacf$acf))
lengthx <- length(x)
sqrtn <- sqrt(lengthx)
load(file='createtable')
a<-table.start()
a<-table.row.start(a)
a<-table.element(a,'Autocorrelation Function',4,TRUE)
a<-table.row.end(a)
a<-table.row.start(a)
a<-table.element(a,'Time lag k',header=TRUE)
a<-table.element(a,hyperlink('basics.htm','ACF(k)','click here for more information about the Autocorrelation Function'),header=TRUE)
a<-table.element(a,'T-STAT',header=TRUE)
a<-table.element(a,'P-value',header=TRUE)
a<-table.row.end(a)
for (i in 2:(par1+1)) {
a<-table.row.start(a)
a<-table.element(a,i-1,header=TRUE)
a<-table.element(a,round(myacf[i],6))
mytstat <- myacf[i]*sqrtn
a<-table.element(a,round(mytstat,4))
a<-table.element(a,round(1-pt(abs(mytstat),lengthx),6))
a<-table.row.end(a)
}
a<-table.end(a)
table.save(a,file='mytable.tab')
a<-table.start()
a<-table.row.start(a)
a<-table.element(a,'Partial Autocorrelation Function',4,TRUE)
a<-table.row.end(a)
a<-table.row.start(a)
a<-table.element(a,'Time lag k',header=TRUE)
a<-table.element(a,hyperlink('basics.htm','PACF(k)','click here for more information about the Partial Autocorrelation Function'),header=TRUE)
a<-table.element(a,'T-STAT',header=TRUE)
a<-table.element(a,'P-value',header=TRUE)
a<-table.row.end(a)
for (i in 1:par1) {
a<-table.row.start(a)
a<-table.element(a,i,header=TRUE)
a<-table.element(a,round(mypacf[i],6))
mytstat <- mypacf[i]*sqrtn
a<-table.element(a,round(mytstat,4))
a<-table.element(a,round(1-pt(abs(mytstat),lengthx),6))
a<-table.row.end(a)
}
a<-table.end(a)
table.save(a,file='mytable1.tab')