Free Statistics

of Irreproducible Research!

Author's title

Author*Unverified author*
R Software Modulerwasp_smp.wasp
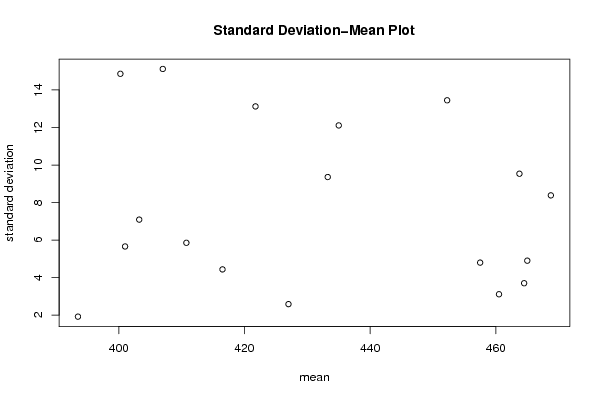
Title produced by softwareStandard Deviation-Mean Plot
Date of computationWed, 25 Nov 2009 06:02:58 -0700
Cite this page as followsStatistical Computations at FreeStatistics.org, Office for Research Development and Education, URL https://freestatistics.org/blog/index.php?v=date/2009/Nov/25/t1259154323c00ywc4f82eiwuz.htm/, Retrieved Tue, 07 May 2024 13:34:52 +0000
Statistical Computations at FreeStatistics.org, Office for Research Development and Education, URL https://freestatistics.org/blog/index.php?pk=59364, Retrieved Tue, 07 May 2024 13:34:52 +0000
QR Codes:

Original text written by user:
IsPrivate?No (this computation is public)
User-defined keywords
Estimated Impact153
Family? (F = Feedback message, R = changed R code, M = changed R Module, P = changed Parameters, D = changed Data)
-     [Univariate Data Series] [Werkloosheid bij ...] [2009-11-03 09:27:56] [1ff3eeaee490dfcff07aa4917fec66b8]
- RMPD    [Standard Deviation-Mean Plot] [Standard deviatio...] [2009-11-25 13:02:58] [cfc54cb9f3f8d85fe8957f0f7c48844d] [Current]
Feedback Forum

Post a new message
Dataseries X:
392
394
392
396
392
396
419
421
420
418
410
418
426
428
430
424
423
427
441
449
452
462
455
461
461
463
462
456
455
456
472
472
471
465
459
465
468
467
463
460
462
461
476
476
471
453
443
442
444
438
427
424
416
406
431
434
418
412
404
409
412
406
398
397
385
390
413
413
401
397
397
409


Summary of computational transaction
Raw Inputview raw input (R code)
Raw Outputview raw output of R engine
Computing time1 seconds
R Server'Gwilym Jenkins' @ 72.249.127.135

\begin{tabular}{lllllllll}
\hline
Summary of computational transaction \tabularnewline
Raw Input & view raw input (R code)  \tabularnewline
Raw Output & view raw output of R engine  \tabularnewline
Computing time & 1 seconds \tabularnewline
R Server & 'Gwilym Jenkins' @ 72.249.127.135 \tabularnewline
\hline
\end{tabular}
%Source: https://freestatistics.org/blog/index.php?pk=59364&T=0

[TABLE]
[ROW][C]Summary of computational transaction[/C][/ROW]
[ROW][C]Raw Input[/C][C]view raw input (R code) [/C][/ROW]
[ROW][C]Raw Output[/C][C]view raw output of R engine [/C][/ROW]
[ROW][C]Computing time[/C][C]1 seconds[/C][/ROW]
[ROW][C]R Server[/C][C]'Gwilym Jenkins' @ 72.249.127.135[/C][/ROW]
[/TABLE]
Source: https://freestatistics.org/blog/index.php?pk=59364&T=0

Globally Unique Identifier (entire table): ba.freestatistics.org/blog/index.php?pk=59364&T=0

As an alternative you can also use a QR Code:  

The GUIDs for individual cells are displayed in the table below:

Summary of computational transaction
Raw Inputview raw input (R code)
Raw Outputview raw output of R engine
Computing time1 seconds
R Server'Gwilym Jenkins' @ 72.249.127.135


Standard Deviation-Mean Plot
SectionMeanStandard DeviationRange
1393.51.914854215512684
240715.12172829628529
3416.54.4347115652166910
44272.581988897471616
543512.110601416390026
6457.54.7958315233127210
7460.53.109126351029607
8463.759.5350231602585417
94654.8989794855663612
10464.53.696845502136478
11468.758.381527307120115
12452.2513.450526631573529
13433.259.3585967609109720
14421.7513.124404748406728
15410.755.8523499553598114
16403.257.0887234393789115
17400.2514.863265679744428
184015.6568542494923812

\begin{tabular}{lllllllll}
\hline
Standard Deviation-Mean Plot \tabularnewline
Section & Mean & Standard Deviation & Range \tabularnewline
1 & 393.5 & 1.91485421551268 & 4 \tabularnewline
2 & 407 & 15.121728296285 & 29 \tabularnewline
3 & 416.5 & 4.43471156521669 & 10 \tabularnewline
4 & 427 & 2.58198889747161 & 6 \tabularnewline
5 & 435 & 12.1106014163900 & 26 \tabularnewline
6 & 457.5 & 4.79583152331272 & 10 \tabularnewline
7 & 460.5 & 3.10912635102960 & 7 \tabularnewline
8 & 463.75 & 9.53502316025854 & 17 \tabularnewline
9 & 465 & 4.89897948556636 & 12 \tabularnewline
10 & 464.5 & 3.69684550213647 & 8 \tabularnewline
11 & 468.75 & 8.3815273071201 & 15 \tabularnewline
12 & 452.25 & 13.4505266315735 & 29 \tabularnewline
13 & 433.25 & 9.35859676091097 & 20 \tabularnewline
14 & 421.75 & 13.1244047484067 & 28 \tabularnewline
15 & 410.75 & 5.85234995535981 & 14 \tabularnewline
16 & 403.25 & 7.08872343937891 & 15 \tabularnewline
17 & 400.25 & 14.8632656797444 & 28 \tabularnewline
18 & 401 & 5.65685424949238 & 12 \tabularnewline
\hline
\end{tabular}
%Source: https://freestatistics.org/blog/index.php?pk=59364&T=1

[TABLE]
[ROW][C]Standard Deviation-Mean Plot[/C][/ROW]
[ROW][C]Section[/C][C]Mean[/C][C]Standard Deviation[/C][C]Range[/C][/ROW]
[ROW][C]1[/C][C]393.5[/C][C]1.91485421551268[/C][C]4[/C][/ROW]
[ROW][C]2[/C][C]407[/C][C]15.121728296285[/C][C]29[/C][/ROW]
[ROW][C]3[/C][C]416.5[/C][C]4.43471156521669[/C][C]10[/C][/ROW]
[ROW][C]4[/C][C]427[/C][C]2.58198889747161[/C][C]6[/C][/ROW]
[ROW][C]5[/C][C]435[/C][C]12.1106014163900[/C][C]26[/C][/ROW]
[ROW][C]6[/C][C]457.5[/C][C]4.79583152331272[/C][C]10[/C][/ROW]
[ROW][C]7[/C][C]460.5[/C][C]3.10912635102960[/C][C]7[/C][/ROW]
[ROW][C]8[/C][C]463.75[/C][C]9.53502316025854[/C][C]17[/C][/ROW]
[ROW][C]9[/C][C]465[/C][C]4.89897948556636[/C][C]12[/C][/ROW]
[ROW][C]10[/C][C]464.5[/C][C]3.69684550213647[/C][C]8[/C][/ROW]
[ROW][C]11[/C][C]468.75[/C][C]8.3815273071201[/C][C]15[/C][/ROW]
[ROW][C]12[/C][C]452.25[/C][C]13.4505266315735[/C][C]29[/C][/ROW]
[ROW][C]13[/C][C]433.25[/C][C]9.35859676091097[/C][C]20[/C][/ROW]
[ROW][C]14[/C][C]421.75[/C][C]13.1244047484067[/C][C]28[/C][/ROW]
[ROW][C]15[/C][C]410.75[/C][C]5.85234995535981[/C][C]14[/C][/ROW]
[ROW][C]16[/C][C]403.25[/C][C]7.08872343937891[/C][C]15[/C][/ROW]
[ROW][C]17[/C][C]400.25[/C][C]14.8632656797444[/C][C]28[/C][/ROW]
[ROW][C]18[/C][C]401[/C][C]5.65685424949238[/C][C]12[/C][/ROW]
[/TABLE]
Source: https://freestatistics.org/blog/index.php?pk=59364&T=1

Globally Unique Identifier (entire table): ba.freestatistics.org/blog/index.php?pk=59364&T=1

As an alternative you can also use a QR Code:  

The GUIDs for individual cells are displayed in the table below:

Standard Deviation-Mean Plot
SectionMeanStandard DeviationRange
1393.51.914854215512684
240715.12172829628529
3416.54.4347115652166910
44272.581988897471616
543512.110601416390026
6457.54.7958315233127210
7460.53.109126351029607
8463.759.5350231602585417
94654.8989794855663612
10464.53.696845502136478
11468.758.381527307120115
12452.2513.450526631573529
13433.259.3585967609109720
14421.7513.124404748406728
15410.755.8523499553598114
16403.257.0887234393789115
17400.2514.863265679744428
184015.6568542494923812


Regression: S.E.(k) = alpha + beta * Mean(k)
alpha17.1387517017524
beta-0.0216566974807399
S.D.0.04068999638609
T-STAT-0.532236407082683
p-value0.601875649909184

\begin{tabular}{lllllllll}
\hline
Regression: S.E.(k) = alpha + beta * Mean(k) \tabularnewline
alpha & 17.1387517017524 \tabularnewline
beta & -0.0216566974807399 \tabularnewline
S.D. & 0.04068999638609 \tabularnewline
T-STAT & -0.532236407082683 \tabularnewline
p-value & 0.601875649909184 \tabularnewline
\hline
\end{tabular}
%Source: https://freestatistics.org/blog/index.php?pk=59364&T=2

[TABLE]
[ROW][C]Regression: S.E.(k) = alpha + beta * Mean(k)[/C][/ROW]
[ROW][C]alpha[/C][C]17.1387517017524[/C][/ROW]
[ROW][C]beta[/C][C]-0.0216566974807399[/C][/ROW]
[ROW][C]S.D.[/C][C]0.04068999638609[/C][/ROW]
[ROW][C]T-STAT[/C][C]-0.532236407082683[/C][/ROW]
[ROW][C]p-value[/C][C]0.601875649909184[/C][/ROW]
[/TABLE]
Source: https://freestatistics.org/blog/index.php?pk=59364&T=2

Globally Unique Identifier (entire table): ba.freestatistics.org/blog/index.php?pk=59364&T=2

As an alternative you can also use a QR Code:  

The GUIDs for individual cells are displayed in the table below:

Regression: S.E.(k) = alpha + beta * Mean(k)
alpha17.1387517017524
beta-0.0216566974807399
S.D.0.04068999638609
T-STAT-0.532236407082683
p-value0.601875649909184


Regression: ln S.E.(k) = alpha + beta * ln Mean(k)
alpha3.88283048736659
beta-0.330060679802735
S.D.2.54247641878027
T-STAT-0.129818580563701
p-value0.898328009413242
Lambda1.33006067980273

\begin{tabular}{lllllllll}
\hline
Regression: ln S.E.(k) = alpha + beta * ln Mean(k) \tabularnewline
alpha & 3.88283048736659 \tabularnewline
beta & -0.330060679802735 \tabularnewline
S.D. & 2.54247641878027 \tabularnewline
T-STAT & -0.129818580563701 \tabularnewline
p-value & 0.898328009413242 \tabularnewline
Lambda & 1.33006067980273 \tabularnewline
\hline
\end{tabular}
%Source: https://freestatistics.org/blog/index.php?pk=59364&T=3

[TABLE]
[ROW][C]Regression: ln S.E.(k) = alpha + beta * ln Mean(k)[/C][/ROW]
[ROW][C]alpha[/C][C]3.88283048736659[/C][/ROW]
[ROW][C]beta[/C][C]-0.330060679802735[/C][/ROW]
[ROW][C]S.D.[/C][C]2.54247641878027[/C][/ROW]
[ROW][C]T-STAT[/C][C]-0.129818580563701[/C][/ROW]
[ROW][C]p-value[/C][C]0.898328009413242[/C][/ROW]
[ROW][C]Lambda[/C][C]1.33006067980273[/C][/ROW]
[/TABLE]
Source: https://freestatistics.org/blog/index.php?pk=59364&T=3

Globally Unique Identifier (entire table): ba.freestatistics.org/blog/index.php?pk=59364&T=3

As an alternative you can also use a QR Code:  

The GUIDs for individual cells are displayed in the table below:

Regression: ln S.E.(k) = alpha + beta * ln Mean(k)
alpha3.88283048736659
beta-0.330060679802735
S.D.2.54247641878027
T-STAT-0.129818580563701
p-value0.898328009413242
Lambda1.33006067980273


Parameters (Session):
par1 = 4 ;
Parameters (R input):
par1 = 4 ;
R code (references can be found in the software module):
par1 <- as.numeric(par1)
(n <- length(x))
(np <- floor(n / par1))
arr <- array(NA,dim=c(par1,np))
j <- 0
k <- 1
for (i in 1:(np*par1))
{
j = j + 1
arr[j,k] <- x[i]
if (j == par1) {
j = 0
k=k+1
}
}
arr
arr.mean <- array(NA,dim=np)
arr.sd <- array(NA,dim=np)
arr.range <- array(NA,dim=np)
for (j in 1:np)
{
arr.mean[j] <- mean(arr[,j],na.rm=TRUE)
arr.sd[j] <- sd(arr[,j],na.rm=TRUE)
arr.range[j] <- max(arr[,j],na.rm=TRUE) - min(arr[,j],na.rm=TRUE)
}
arr.mean
arr.sd
arr.range
(lm1 <- lm(arr.sd~arr.mean))
(lnlm1 <- lm(log(arr.sd)~log(arr.mean)))
(lm2 <- lm(arr.range~arr.mean))
bitmap(file='test1.png')
plot(arr.mean,arr.sd,main='Standard Deviation-Mean Plot',xlab='mean',ylab='standard deviation')
dev.off()
bitmap(file='test2.png')
plot(arr.mean,arr.range,main='Range-Mean Plot',xlab='mean',ylab='range')
dev.off()
load(file='createtable')
a<-table.start()
a<-table.row.start(a)
a<-table.element(a,'Standard Deviation-Mean Plot',4,TRUE)
a<-table.row.end(a)
a<-table.row.start(a)
a<-table.element(a,'Section',header=TRUE)
a<-table.element(a,'Mean',header=TRUE)
a<-table.element(a,'Standard Deviation',header=TRUE)
a<-table.element(a,'Range',header=TRUE)
a<-table.row.end(a)
for (j in 1:np) {
a<-table.row.start(a)
a<-table.element(a,j,header=TRUE)
a<-table.element(a,arr.mean[j])
a<-table.element(a,arr.sd[j] )
a<-table.element(a,arr.range[j] )
a<-table.row.end(a)
}
a<-table.end(a)
table.save(a,file='mytable.tab')
a<-table.start()
a<-table.row.start(a)
a<-table.element(a,'Regression: S.E.(k) = alpha + beta * Mean(k)',2,TRUE)
a<-table.row.end(a)
a<-table.row.start(a)
a<-table.element(a,'alpha',header=TRUE)
a<-table.element(a,lm1$coefficients[[1]])
a<-table.row.end(a)
a<-table.row.start(a)
a<-table.element(a,'beta',header=TRUE)
a<-table.element(a,lm1$coefficients[[2]])
a<-table.row.end(a)
a<-table.row.start(a)
a<-table.element(a,'S.D.',header=TRUE)
a<-table.element(a,summary(lm1)$coefficients[2,2])
a<-table.row.end(a)
a<-table.row.start(a)
a<-table.element(a,'T-STAT',header=TRUE)
a<-table.element(a,summary(lm1)$coefficients[2,3])
a<-table.row.end(a)
a<-table.row.start(a)
a<-table.element(a,'p-value',header=TRUE)
a<-table.element(a,summary(lm1)$coefficients[2,4])
a<-table.row.end(a)
a<-table.end(a)
table.save(a,file='mytable1.tab')
a<-table.start()
a<-table.row.start(a)
a<-table.element(a,'Regression: ln S.E.(k) = alpha + beta * ln Mean(k)',2,TRUE)
a<-table.row.end(a)
a<-table.row.start(a)
a<-table.element(a,'alpha',header=TRUE)
a<-table.element(a,lnlm1$coefficients[[1]])
a<-table.row.end(a)
a<-table.row.start(a)
a<-table.element(a,'beta',header=TRUE)
a<-table.element(a,lnlm1$coefficients[[2]])
a<-table.row.end(a)
a<-table.row.start(a)
a<-table.element(a,'S.D.',header=TRUE)
a<-table.element(a,summary(lnlm1)$coefficients[2,2])
a<-table.row.end(a)
a<-table.row.start(a)
a<-table.element(a,'T-STAT',header=TRUE)
a<-table.element(a,summary(lnlm1)$coefficients[2,3])
a<-table.row.end(a)
a<-table.row.start(a)
a<-table.element(a,'p-value',header=TRUE)
a<-table.element(a,summary(lnlm1)$coefficients[2,4])
a<-table.row.end(a)
a<-table.row.start(a)
a<-table.element(a,'Lambda',header=TRUE)
a<-table.element(a,1-lnlm1$coefficients[[2]])
a<-table.row.end(a)
a<-table.end(a)
table.save(a,file='mytable2.tab')