Free Statistics

of Irreproducible Research!

Author's title

Author*Unverified author*
R Software Modulerwasp_smp.wasp
Title produced by softwareStandard Deviation-Mean Plot
Date of computationWed, 25 Nov 2009 06:21:52 -0700
Cite this page as followsStatistical Computations at FreeStatistics.org, Office for Research Development and Education, URL https://freestatistics.org/blog/index.php?v=date/2009/Nov/25/t1259155341ih8ao0bhqcextbt.htm/, Retrieved Tue, 07 May 2024 13:43:52 +0000
Statistical Computations at FreeStatistics.org, Office for Research Development and Education, URL https://freestatistics.org/blog/index.php?pk=59373, Retrieved Tue, 07 May 2024 13:43:52 +0000
QR Codes:

Original text written by user:
IsPrivate?No (this computation is public)
User-defined keywords
Estimated Impact156
Family? (F = Feedback message, R = changed R code, M = changed R Module, P = changed Parameters, D = changed Data)
-     [Univariate Data Series] [Werkloosheid bij ...] [2009-11-03 09:24:35] [1ff3eeaee490dfcff07aa4917fec66b8]
- RMPD    [Standard Deviation-Mean Plot] [Standard deviatio...] [2009-11-25 13:21:52] [cfc54cb9f3f8d85fe8957f0f7c48844d] [Current]
Feedback Forum

Post a new message
Dataseries X:
127
123
118
114
108
111
151
159
158
148
138
137
136
133
126
120
114
116
153
162
161
149
139
135
130
127
122
117
112
113
149
157
157
147
137
132
125
123
117
114
111
112
144
150
149
134
123
116
117
111
105
102
95
93
124
130
124
115
106
105
105
101
95
93
84
87
116
120
117
109
105
107


Summary of computational transaction
Raw Inputview raw input (R code)
Raw Outputview raw output of R engine
Computing time2 seconds
R Server'Gwilym Jenkins' @ 72.249.127.135

\begin{tabular}{lllllllll}
\hline
Summary of computational transaction \tabularnewline
Raw Input & view raw input (R code)  \tabularnewline
Raw Output & view raw output of R engine  \tabularnewline
Computing time & 2 seconds \tabularnewline
R Server & 'Gwilym Jenkins' @ 72.249.127.135 \tabularnewline
\hline
\end{tabular}
%Source: https://freestatistics.org/blog/index.php?pk=59373&T=0

[TABLE]
[ROW][C]Summary of computational transaction[/C][/ROW]
[ROW][C]Raw Input[/C][C]view raw input (R code) [/C][/ROW]
[ROW][C]Raw Output[/C][C]view raw output of R engine [/C][/ROW]
[ROW][C]Computing time[/C][C]2 seconds[/C][/ROW]
[ROW][C]R Server[/C][C]'Gwilym Jenkins' @ 72.249.127.135[/C][/ROW]
[/TABLE]
Source: https://freestatistics.org/blog/index.php?pk=59373&T=0

Globally Unique Identifier (entire table): ba.freestatistics.org/blog/index.php?pk=59373&T=0

As an alternative you can also use a QR Code:  

The GUIDs for individual cells are displayed in the table below:

Summary of computational transaction
Raw Inputview raw input (R code)
Raw Outputview raw output of R engine
Computing time2 seconds
R Server'Gwilym Jenkins' @ 72.249.127.135


Standard Deviation-Mean Plot
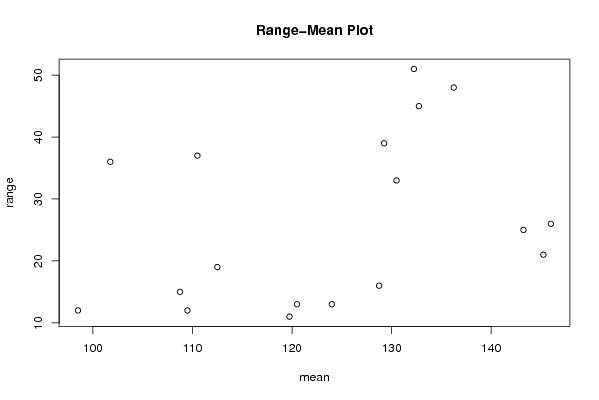
SectionMeanStandard DeviationRange
1120.55.6862407030773313
2132.2526.551
3145.259.8446262837482421
4128.757.1821538088050816
5136.2524.824383174612848
614611.604596790352826
71245.7154760664940813
8132.7523.613202521753245
9143.2511.086778913041725
10119.755.123475382979811
11129.2520.645822822062639
12130.514.387494569938233
13108.756.6520673478250415
14110.519.226717521893037
15112.58.8881944173155919
1698.55.507570547286112
17101.7518.874586088176936
18109.55.2599112793531712

\begin{tabular}{lllllllll}
\hline
Standard Deviation-Mean Plot \tabularnewline
Section & Mean & Standard Deviation & Range \tabularnewline
1 & 120.5 & 5.68624070307733 & 13 \tabularnewline
2 & 132.25 & 26.5 & 51 \tabularnewline
3 & 145.25 & 9.84462628374824 & 21 \tabularnewline
4 & 128.75 & 7.18215380880508 & 16 \tabularnewline
5 & 136.25 & 24.8243831746128 & 48 \tabularnewline
6 & 146 & 11.6045967903528 & 26 \tabularnewline
7 & 124 & 5.71547606649408 & 13 \tabularnewline
8 & 132.75 & 23.6132025217532 & 45 \tabularnewline
9 & 143.25 & 11.0867789130417 & 25 \tabularnewline
10 & 119.75 & 5.1234753829798 & 11 \tabularnewline
11 & 129.25 & 20.6458228220626 & 39 \tabularnewline
12 & 130.5 & 14.3874945699382 & 33 \tabularnewline
13 & 108.75 & 6.65206734782504 & 15 \tabularnewline
14 & 110.5 & 19.2267175218930 & 37 \tabularnewline
15 & 112.5 & 8.88819441731559 & 19 \tabularnewline
16 & 98.5 & 5.5075705472861 & 12 \tabularnewline
17 & 101.75 & 18.8745860881769 & 36 \tabularnewline
18 & 109.5 & 5.25991127935317 & 12 \tabularnewline
\hline
\end{tabular}
%Source: https://freestatistics.org/blog/index.php?pk=59373&T=1

[TABLE]
[ROW][C]Standard Deviation-Mean Plot[/C][/ROW]
[ROW][C]Section[/C][C]Mean[/C][C]Standard Deviation[/C][C]Range[/C][/ROW]
[ROW][C]1[/C][C]120.5[/C][C]5.68624070307733[/C][C]13[/C][/ROW]
[ROW][C]2[/C][C]132.25[/C][C]26.5[/C][C]51[/C][/ROW]
[ROW][C]3[/C][C]145.25[/C][C]9.84462628374824[/C][C]21[/C][/ROW]
[ROW][C]4[/C][C]128.75[/C][C]7.18215380880508[/C][C]16[/C][/ROW]
[ROW][C]5[/C][C]136.25[/C][C]24.8243831746128[/C][C]48[/C][/ROW]
[ROW][C]6[/C][C]146[/C][C]11.6045967903528[/C][C]26[/C][/ROW]
[ROW][C]7[/C][C]124[/C][C]5.71547606649408[/C][C]13[/C][/ROW]
[ROW][C]8[/C][C]132.75[/C][C]23.6132025217532[/C][C]45[/C][/ROW]
[ROW][C]9[/C][C]143.25[/C][C]11.0867789130417[/C][C]25[/C][/ROW]
[ROW][C]10[/C][C]119.75[/C][C]5.1234753829798[/C][C]11[/C][/ROW]
[ROW][C]11[/C][C]129.25[/C][C]20.6458228220626[/C][C]39[/C][/ROW]
[ROW][C]12[/C][C]130.5[/C][C]14.3874945699382[/C][C]33[/C][/ROW]
[ROW][C]13[/C][C]108.75[/C][C]6.65206734782504[/C][C]15[/C][/ROW]
[ROW][C]14[/C][C]110.5[/C][C]19.2267175218930[/C][C]37[/C][/ROW]
[ROW][C]15[/C][C]112.5[/C][C]8.88819441731559[/C][C]19[/C][/ROW]
[ROW][C]16[/C][C]98.5[/C][C]5.5075705472861[/C][C]12[/C][/ROW]
[ROW][C]17[/C][C]101.75[/C][C]18.8745860881769[/C][C]36[/C][/ROW]
[ROW][C]18[/C][C]109.5[/C][C]5.25991127935317[/C][C]12[/C][/ROW]
[/TABLE]
Source: https://freestatistics.org/blog/index.php?pk=59373&T=1

Globally Unique Identifier (entire table): ba.freestatistics.org/blog/index.php?pk=59373&T=1

As an alternative you can also use a QR Code:  

The GUIDs for individual cells are displayed in the table below:

Standard Deviation-Mean Plot
SectionMeanStandard DeviationRange
1120.55.6862407030773313
2132.2526.551
3145.259.8446262837482421
4128.757.1821538088050816
5136.2524.824383174612848
614611.604596790352826
71245.7154760664940813
8132.7523.613202521753245
9143.2511.086778913041725
10119.755.123475382979811
11129.2520.645822822062639
12130.514.387494569938233
13108.756.6520673478250415
14110.519.226717521893037
15112.58.8881944173155919
1698.55.507570547286112
17101.7518.874586088176936
18109.55.2599112793531712


Regression: S.E.(k) = alpha + beta * Mean(k)
alpha-5.20566341489421
beta0.145437327222785
S.D.0.123321789561046
T-STAT1.17933195537024
p-value0.255505709888587

\begin{tabular}{lllllllll}
\hline
Regression: S.E.(k) = alpha + beta * Mean(k) \tabularnewline
alpha & -5.20566341489421 \tabularnewline
beta & 0.145437327222785 \tabularnewline
S.D. & 0.123321789561046 \tabularnewline
T-STAT & 1.17933195537024 \tabularnewline
p-value & 0.255505709888587 \tabularnewline
\hline
\end{tabular}
%Source: https://freestatistics.org/blog/index.php?pk=59373&T=2

[TABLE]
[ROW][C]Regression: S.E.(k) = alpha + beta * Mean(k)[/C][/ROW]
[ROW][C]alpha[/C][C]-5.20566341489421[/C][/ROW]
[ROW][C]beta[/C][C]0.145437327222785[/C][/ROW]
[ROW][C]S.D.[/C][C]0.123321789561046[/C][/ROW]
[ROW][C]T-STAT[/C][C]1.17933195537024[/C][/ROW]
[ROW][C]p-value[/C][C]0.255505709888587[/C][/ROW]
[/TABLE]
Source: https://freestatistics.org/blog/index.php?pk=59373&T=2

Globally Unique Identifier (entire table): ba.freestatistics.org/blog/index.php?pk=59373&T=2

As an alternative you can also use a QR Code:  

The GUIDs for individual cells are displayed in the table below:

Regression: S.E.(k) = alpha + beta * Mean(k)
alpha-5.20566341489421
beta0.145437327222785
S.D.0.123321789561046
T-STAT1.17933195537024
p-value0.255505709888587


Regression: ln S.E.(k) = alpha + beta * ln Mean(k)
alpha-5.7220708349054
beta1.68435611712269
S.D.1.17055879521537
T-STAT1.43893337439132
p-value0.169445002239552
Lambda-0.684356117122686

\begin{tabular}{lllllllll}
\hline
Regression: ln S.E.(k) = alpha + beta * ln Mean(k) \tabularnewline
alpha & -5.7220708349054 \tabularnewline
beta & 1.68435611712269 \tabularnewline
S.D. & 1.17055879521537 \tabularnewline
T-STAT & 1.43893337439132 \tabularnewline
p-value & 0.169445002239552 \tabularnewline
Lambda & -0.684356117122686 \tabularnewline
\hline
\end{tabular}
%Source: https://freestatistics.org/blog/index.php?pk=59373&T=3

[TABLE]
[ROW][C]Regression: ln S.E.(k) = alpha + beta * ln Mean(k)[/C][/ROW]
[ROW][C]alpha[/C][C]-5.7220708349054[/C][/ROW]
[ROW][C]beta[/C][C]1.68435611712269[/C][/ROW]
[ROW][C]S.D.[/C][C]1.17055879521537[/C][/ROW]
[ROW][C]T-STAT[/C][C]1.43893337439132[/C][/ROW]
[ROW][C]p-value[/C][C]0.169445002239552[/C][/ROW]
[ROW][C]Lambda[/C][C]-0.684356117122686[/C][/ROW]
[/TABLE]
Source: https://freestatistics.org/blog/index.php?pk=59373&T=3

Globally Unique Identifier (entire table): ba.freestatistics.org/blog/index.php?pk=59373&T=3

As an alternative you can also use a QR Code:  

The GUIDs for individual cells are displayed in the table below:

Regression: ln S.E.(k) = alpha + beta * ln Mean(k)
alpha-5.7220708349054
beta1.68435611712269
S.D.1.17055879521537
T-STAT1.43893337439132
p-value0.169445002239552
Lambda-0.684356117122686


Parameters (Session):
par1 = Default ; par2 = 1 ; par3 = 1 ; par4 = 1 ; par5 = 12 ; par6 = White Noise ; par7 = 0.95 ;
Parameters (R input):
par1 = 4 ;
R code (references can be found in the software module):
par1 <- as.numeric(par1)
(n <- length(x))
(np <- floor(n / par1))
arr <- array(NA,dim=c(par1,np))
j <- 0
k <- 1
for (i in 1:(np*par1))
{
j = j + 1
arr[j,k] <- x[i]
if (j == par1) {
j = 0
k=k+1
}
}
arr
arr.mean <- array(NA,dim=np)
arr.sd <- array(NA,dim=np)
arr.range <- array(NA,dim=np)
for (j in 1:np)
{
arr.mean[j] <- mean(arr[,j],na.rm=TRUE)
arr.sd[j] <- sd(arr[,j],na.rm=TRUE)
arr.range[j] <- max(arr[,j],na.rm=TRUE) - min(arr[,j],na.rm=TRUE)
}
arr.mean
arr.sd
arr.range
(lm1 <- lm(arr.sd~arr.mean))
(lnlm1 <- lm(log(arr.sd)~log(arr.mean)))
(lm2 <- lm(arr.range~arr.mean))
bitmap(file='test1.png')
plot(arr.mean,arr.sd,main='Standard Deviation-Mean Plot',xlab='mean',ylab='standard deviation')
dev.off()
bitmap(file='test2.png')
plot(arr.mean,arr.range,main='Range-Mean Plot',xlab='mean',ylab='range')
dev.off()
load(file='createtable')
a<-table.start()
a<-table.row.start(a)
a<-table.element(a,'Standard Deviation-Mean Plot',4,TRUE)
a<-table.row.end(a)
a<-table.row.start(a)
a<-table.element(a,'Section',header=TRUE)
a<-table.element(a,'Mean',header=TRUE)
a<-table.element(a,'Standard Deviation',header=TRUE)
a<-table.element(a,'Range',header=TRUE)
a<-table.row.end(a)
for (j in 1:np) {
a<-table.row.start(a)
a<-table.element(a,j,header=TRUE)
a<-table.element(a,arr.mean[j])
a<-table.element(a,arr.sd[j] )
a<-table.element(a,arr.range[j] )
a<-table.row.end(a)
}
a<-table.end(a)
table.save(a,file='mytable.tab')
a<-table.start()
a<-table.row.start(a)
a<-table.element(a,'Regression: S.E.(k) = alpha + beta * Mean(k)',2,TRUE)
a<-table.row.end(a)
a<-table.row.start(a)
a<-table.element(a,'alpha',header=TRUE)
a<-table.element(a,lm1$coefficients[[1]])
a<-table.row.end(a)
a<-table.row.start(a)
a<-table.element(a,'beta',header=TRUE)
a<-table.element(a,lm1$coefficients[[2]])
a<-table.row.end(a)
a<-table.row.start(a)
a<-table.element(a,'S.D.',header=TRUE)
a<-table.element(a,summary(lm1)$coefficients[2,2])
a<-table.row.end(a)
a<-table.row.start(a)
a<-table.element(a,'T-STAT',header=TRUE)
a<-table.element(a,summary(lm1)$coefficients[2,3])
a<-table.row.end(a)
a<-table.row.start(a)
a<-table.element(a,'p-value',header=TRUE)
a<-table.element(a,summary(lm1)$coefficients[2,4])
a<-table.row.end(a)
a<-table.end(a)
table.save(a,file='mytable1.tab')
a<-table.start()
a<-table.row.start(a)
a<-table.element(a,'Regression: ln S.E.(k) = alpha + beta * ln Mean(k)',2,TRUE)
a<-table.row.end(a)
a<-table.row.start(a)
a<-table.element(a,'alpha',header=TRUE)
a<-table.element(a,lnlm1$coefficients[[1]])
a<-table.row.end(a)
a<-table.row.start(a)
a<-table.element(a,'beta',header=TRUE)
a<-table.element(a,lnlm1$coefficients[[2]])
a<-table.row.end(a)
a<-table.row.start(a)
a<-table.element(a,'S.D.',header=TRUE)
a<-table.element(a,summary(lnlm1)$coefficients[2,2])
a<-table.row.end(a)
a<-table.row.start(a)
a<-table.element(a,'T-STAT',header=TRUE)
a<-table.element(a,summary(lnlm1)$coefficients[2,3])
a<-table.row.end(a)
a<-table.row.start(a)
a<-table.element(a,'p-value',header=TRUE)
a<-table.element(a,summary(lnlm1)$coefficients[2,4])
a<-table.row.end(a)
a<-table.row.start(a)
a<-table.element(a,'Lambda',header=TRUE)
a<-table.element(a,1-lnlm1$coefficients[[2]])
a<-table.row.end(a)
a<-table.end(a)
table.save(a,file='mytable2.tab')