Free Statistics

of Irreproducible Research!

Author's title

Author*The author of this computation has been verified*
R Software Modulerwasp_autocorrelation.wasp
Title produced by software(Partial) Autocorrelation Function
Date of computationThu, 26 Nov 2009 03:11:10 -0700
Cite this page as followsStatistical Computations at FreeStatistics.org, Office for Research Development and Education, URL https://freestatistics.org/blog/index.php?v=date/2009/Nov/26/t1259230318gpfrdf9n1keuwgm.htm/, Retrieved Sun, 28 Apr 2024 21:46:26 +0000
Statistical Computations at FreeStatistics.org, Office for Research Development and Education, URL https://freestatistics.org/blog/index.php?pk=59770, Retrieved Sun, 28 Apr 2024 21:46:26 +0000
QR Codes:

Original text written by user:
IsPrivate?No (this computation is public)
User-defined keywords
Estimated Impact165
Family? (F = Feedback message, R = changed R code, M = changed R Module, P = changed Parameters, D = changed Data)
-       [(Partial) Autocorrelation Function] [autocorrelatie na...] [2009-11-26 10:11:10] [a5b01ef1969ffd97a40c5fefe56a50d0] [Current]
Feedback Forum

Post a new message
Dataseries X:
1.8
1.6
1.9
1.7
1.6
1.3
1.1
1.9
2.6
2.3
2.4
2.2
2
2.9
2.6
2.3
2.3
2.6
3.1
2.8
2.5
2.9
3.1
3.1
3.2
2.5
2.6
2.9
2.6
2.4
1.7
2
2.2
1.9
1.6
1.6
1.2
1.2
1.5
1.6
1.7
1.8
1.8
1.8
1.3
1.3
1.4
1.1
1.5
2.2
2.9
3.1
3.5
3.6
4.4
4.2
5.2
5.8
5.9
5.4
5.5


Summary of computational transaction
Raw Inputview raw input (R code)
Raw Outputview raw output of R engine
Computing time1 seconds
R Server'Gwilym Jenkins' @ 72.249.127.135

\begin{tabular}{lllllllll}
\hline
Summary of computational transaction \tabularnewline
Raw Input & view raw input (R code)  \tabularnewline
Raw Output & view raw output of R engine  \tabularnewline
Computing time & 1 seconds \tabularnewline
R Server & 'Gwilym Jenkins' @ 72.249.127.135 \tabularnewline
\hline
\end{tabular}
%Source: https://freestatistics.org/blog/index.php?pk=59770&T=0

[TABLE]
[ROW][C]Summary of computational transaction[/C][/ROW]
[ROW][C]Raw Input[/C][C]view raw input (R code) [/C][/ROW]
[ROW][C]Raw Output[/C][C]view raw output of R engine [/C][/ROW]
[ROW][C]Computing time[/C][C]1 seconds[/C][/ROW]
[ROW][C]R Server[/C][C]'Gwilym Jenkins' @ 72.249.127.135[/C][/ROW]
[/TABLE]
Source: https://freestatistics.org/blog/index.php?pk=59770&T=0

Globally Unique Identifier (entire table): ba.freestatistics.org/blog/index.php?pk=59770&T=0

As an alternative you can also use a QR Code:  

The GUIDs for individual cells are displayed in the table below:

Summary of computational transaction
Raw Inputview raw input (R code)
Raw Outputview raw output of R engine
Computing time1 seconds
R Server'Gwilym Jenkins' @ 72.249.127.135


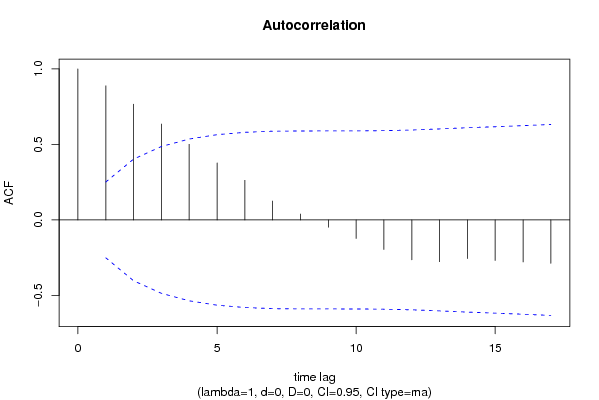
Autocorrelation Function
Time lag kACF(k)T-STATP-value
10.8882326.93730
20.766975.99020
30.6350584.963e-06
40.5007333.91090.000117
50.3773032.94680.002271
60.2627042.05180.022245
70.12470.97390.166967
80.0390250.30480.380779
9-0.048066-0.37540.354329
10-0.122943-0.96020.170368
11-0.195184-1.52440.066284
12-0.264339-2.06460.021612
13-0.2764-2.15880.017406
14-0.256036-1.99970.024995
15-0.268318-2.09560.020136
16-0.278335-2.17390.016803
17-0.287751-2.24740.014121

\begin{tabular}{lllllllll}
\hline
Autocorrelation Function \tabularnewline
Time lag k & ACF(k) & T-STAT & P-value \tabularnewline
1 & 0.888232 & 6.9373 & 0 \tabularnewline
2 & 0.76697 & 5.9902 & 0 \tabularnewline
3 & 0.635058 & 4.96 & 3e-06 \tabularnewline
4 & 0.500733 & 3.9109 & 0.000117 \tabularnewline
5 & 0.377303 & 2.9468 & 0.002271 \tabularnewline
6 & 0.262704 & 2.0518 & 0.022245 \tabularnewline
7 & 0.1247 & 0.9739 & 0.166967 \tabularnewline
8 & 0.039025 & 0.3048 & 0.380779 \tabularnewline
9 & -0.048066 & -0.3754 & 0.354329 \tabularnewline
10 & -0.122943 & -0.9602 & 0.170368 \tabularnewline
11 & -0.195184 & -1.5244 & 0.066284 \tabularnewline
12 & -0.264339 & -2.0646 & 0.021612 \tabularnewline
13 & -0.2764 & -2.1588 & 0.017406 \tabularnewline
14 & -0.256036 & -1.9997 & 0.024995 \tabularnewline
15 & -0.268318 & -2.0956 & 0.020136 \tabularnewline
16 & -0.278335 & -2.1739 & 0.016803 \tabularnewline
17 & -0.287751 & -2.2474 & 0.014121 \tabularnewline
\hline
\end{tabular}
%Source: https://freestatistics.org/blog/index.php?pk=59770&T=1

[TABLE]
[ROW][C]Autocorrelation Function[/C][/ROW]
[ROW][C]Time lag k[/C][C]ACF(k)[/C][C]T-STAT[/C][C]P-value[/C][/ROW]
[ROW][C]1[/C][C]0.888232[/C][C]6.9373[/C][C]0[/C][/ROW]
[ROW][C]2[/C][C]0.76697[/C][C]5.9902[/C][C]0[/C][/ROW]
[ROW][C]3[/C][C]0.635058[/C][C]4.96[/C][C]3e-06[/C][/ROW]
[ROW][C]4[/C][C]0.500733[/C][C]3.9109[/C][C]0.000117[/C][/ROW]
[ROW][C]5[/C][C]0.377303[/C][C]2.9468[/C][C]0.002271[/C][/ROW]
[ROW][C]6[/C][C]0.262704[/C][C]2.0518[/C][C]0.022245[/C][/ROW]
[ROW][C]7[/C][C]0.1247[/C][C]0.9739[/C][C]0.166967[/C][/ROW]
[ROW][C]8[/C][C]0.039025[/C][C]0.3048[/C][C]0.380779[/C][/ROW]
[ROW][C]9[/C][C]-0.048066[/C][C]-0.3754[/C][C]0.354329[/C][/ROW]
[ROW][C]10[/C][C]-0.122943[/C][C]-0.9602[/C][C]0.170368[/C][/ROW]
[ROW][C]11[/C][C]-0.195184[/C][C]-1.5244[/C][C]0.066284[/C][/ROW]
[ROW][C]12[/C][C]-0.264339[/C][C]-2.0646[/C][C]0.021612[/C][/ROW]
[ROW][C]13[/C][C]-0.2764[/C][C]-2.1588[/C][C]0.017406[/C][/ROW]
[ROW][C]14[/C][C]-0.256036[/C][C]-1.9997[/C][C]0.024995[/C][/ROW]
[ROW][C]15[/C][C]-0.268318[/C][C]-2.0956[/C][C]0.020136[/C][/ROW]
[ROW][C]16[/C][C]-0.278335[/C][C]-2.1739[/C][C]0.016803[/C][/ROW]
[ROW][C]17[/C][C]-0.287751[/C][C]-2.2474[/C][C]0.014121[/C][/ROW]
[/TABLE]
Source: https://freestatistics.org/blog/index.php?pk=59770&T=1

Globally Unique Identifier (entire table): ba.freestatistics.org/blog/index.php?pk=59770&T=1

As an alternative you can also use a QR Code:  

The GUIDs for individual cells are displayed in the table below:

Autocorrelation Function
Time lag kACF(k)T-STATP-value
10.8882326.93730
20.766975.99020
30.6350584.963e-06
40.5007333.91090.000117
50.3773032.94680.002271
60.2627042.05180.022245
70.12470.97390.166967
80.0390250.30480.380779
9-0.048066-0.37540.354329
10-0.122943-0.96020.170368
11-0.195184-1.52440.066284
12-0.264339-2.06460.021612
13-0.2764-2.15880.017406
14-0.256036-1.99970.024995
15-0.268318-2.09560.020136
16-0.278335-2.17390.016803
17-0.287751-2.24740.014121


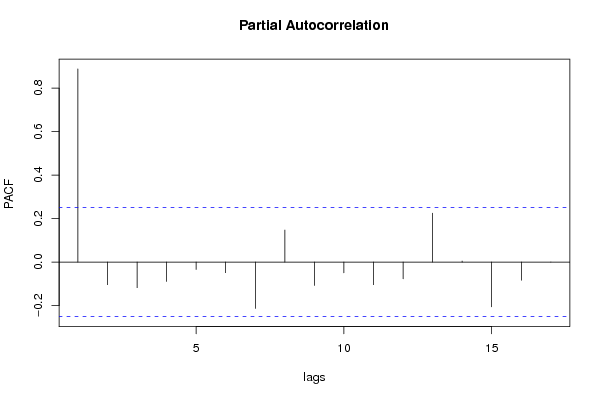
Partial Autocorrelation Function
Time lag kPACF(k)T-STATP-value
10.8882326.93730
2-0.104175-0.81360.20951
3-0.117969-0.92140.180245
4-0.089185-0.69660.244363
5-0.033775-0.26380.396415
6-0.048862-0.38160.352033
7-0.213252-1.66550.050466
80.1471511.14930.127462
9-0.107508-0.83970.202187
10-0.049431-0.38610.350396
11-0.104092-0.8130.209695
12-0.076832-0.60010.27534
130.2248161.75590.042065
140.004820.03760.485047
15-0.205569-1.60550.056769
16-0.083519-0.65230.258328
179.5e-057e-040.499704

\begin{tabular}{lllllllll}
\hline
Partial Autocorrelation Function \tabularnewline
Time lag k & PACF(k) & T-STAT & P-value \tabularnewline
1 & 0.888232 & 6.9373 & 0 \tabularnewline
2 & -0.104175 & -0.8136 & 0.20951 \tabularnewline
3 & -0.117969 & -0.9214 & 0.180245 \tabularnewline
4 & -0.089185 & -0.6966 & 0.244363 \tabularnewline
5 & -0.033775 & -0.2638 & 0.396415 \tabularnewline
6 & -0.048862 & -0.3816 & 0.352033 \tabularnewline
7 & -0.213252 & -1.6655 & 0.050466 \tabularnewline
8 & 0.147151 & 1.1493 & 0.127462 \tabularnewline
9 & -0.107508 & -0.8397 & 0.202187 \tabularnewline
10 & -0.049431 & -0.3861 & 0.350396 \tabularnewline
11 & -0.104092 & -0.813 & 0.209695 \tabularnewline
12 & -0.076832 & -0.6001 & 0.27534 \tabularnewline
13 & 0.224816 & 1.7559 & 0.042065 \tabularnewline
14 & 0.00482 & 0.0376 & 0.485047 \tabularnewline
15 & -0.205569 & -1.6055 & 0.056769 \tabularnewline
16 & -0.083519 & -0.6523 & 0.258328 \tabularnewline
17 & 9.5e-05 & 7e-04 & 0.499704 \tabularnewline
\hline
\end{tabular}
%Source: https://freestatistics.org/blog/index.php?pk=59770&T=2

[TABLE]
[ROW][C]Partial Autocorrelation Function[/C][/ROW]
[ROW][C]Time lag k[/C][C]PACF(k)[/C][C]T-STAT[/C][C]P-value[/C][/ROW]
[ROW][C]1[/C][C]0.888232[/C][C]6.9373[/C][C]0[/C][/ROW]
[ROW][C]2[/C][C]-0.104175[/C][C]-0.8136[/C][C]0.20951[/C][/ROW]
[ROW][C]3[/C][C]-0.117969[/C][C]-0.9214[/C][C]0.180245[/C][/ROW]
[ROW][C]4[/C][C]-0.089185[/C][C]-0.6966[/C][C]0.244363[/C][/ROW]
[ROW][C]5[/C][C]-0.033775[/C][C]-0.2638[/C][C]0.396415[/C][/ROW]
[ROW][C]6[/C][C]-0.048862[/C][C]-0.3816[/C][C]0.352033[/C][/ROW]
[ROW][C]7[/C][C]-0.213252[/C][C]-1.6655[/C][C]0.050466[/C][/ROW]
[ROW][C]8[/C][C]0.147151[/C][C]1.1493[/C][C]0.127462[/C][/ROW]
[ROW][C]9[/C][C]-0.107508[/C][C]-0.8397[/C][C]0.202187[/C][/ROW]
[ROW][C]10[/C][C]-0.049431[/C][C]-0.3861[/C][C]0.350396[/C][/ROW]
[ROW][C]11[/C][C]-0.104092[/C][C]-0.813[/C][C]0.209695[/C][/ROW]
[ROW][C]12[/C][C]-0.076832[/C][C]-0.6001[/C][C]0.27534[/C][/ROW]
[ROW][C]13[/C][C]0.224816[/C][C]1.7559[/C][C]0.042065[/C][/ROW]
[ROW][C]14[/C][C]0.00482[/C][C]0.0376[/C][C]0.485047[/C][/ROW]
[ROW][C]15[/C][C]-0.205569[/C][C]-1.6055[/C][C]0.056769[/C][/ROW]
[ROW][C]16[/C][C]-0.083519[/C][C]-0.6523[/C][C]0.258328[/C][/ROW]
[ROW][C]17[/C][C]9.5e-05[/C][C]7e-04[/C][C]0.499704[/C][/ROW]
[/TABLE]
Source: https://freestatistics.org/blog/index.php?pk=59770&T=2

Globally Unique Identifier (entire table): ba.freestatistics.org/blog/index.php?pk=59770&T=2

As an alternative you can also use a QR Code:  

The GUIDs for individual cells are displayed in the table below:

Partial Autocorrelation Function
Time lag kPACF(k)T-STATP-value
10.8882326.93730
2-0.104175-0.81360.20951
3-0.117969-0.92140.180245
4-0.089185-0.69660.244363
5-0.033775-0.26380.396415
6-0.048862-0.38160.352033
7-0.213252-1.66550.050466
80.1471511.14930.127462
9-0.107508-0.83970.202187
10-0.049431-0.38610.350396
11-0.104092-0.8130.209695
12-0.076832-0.60010.27534
130.2248161.75590.042065
140.004820.03760.485047
15-0.205569-1.60550.056769
16-0.083519-0.65230.258328
179.5e-057e-040.499704


Parameters (Session):
par1 = Default ; par2 = 1 ; par3 = 0 ; par4 = 0 ; par5 = 12 ; par6 = MA ; par7 = 0.95 ;
Parameters (R input):
par1 = Default ; par2 = 1 ; par3 = 0 ; par4 = 0 ; par5 = 12 ; par6 = MA ; par7 = 0.95 ;
R code (references can be found in the software module):
if (par1 == 'Default') {
par1 = 10*log10(length(x))
} else {
par1 <- as.numeric(par1)
}
par2 <- as.numeric(par2)
par3 <- as.numeric(par3)
par4 <- as.numeric(par4)
par5 <- as.numeric(par5)
if (par6 == 'White Noise') par6 <- 'white' else par6 <- 'ma'
par7 <- as.numeric(par7)
if (par2 == 0) {
x <- log(x)
} else {
x <- (x ^ par2 - 1) / par2
}
if (par3 > 0) x <- diff(x,lag=1,difference=par3)
if (par4 > 0) x <- diff(x,lag=par5,difference=par4)
bitmap(file='pic1.png')
racf <- acf(x, par1, main='Autocorrelation', xlab='time lag', ylab='ACF', ci.type=par6, ci=par7, sub=paste('(lambda=',par2,', d=',par3,', D=',par4,', CI=', par7, ', CI type=',par6,')',sep=''))
dev.off()
bitmap(file='pic2.png')
rpacf <- pacf(x,par1,main='Partial Autocorrelation',xlab='lags',ylab='PACF')
dev.off()
(myacf <- c(racf$acf))
(mypacf <- c(rpacf$acf))
lengthx <- length(x)
sqrtn <- sqrt(lengthx)
load(file='createtable')
a<-table.start()
a<-table.row.start(a)
a<-table.element(a,'Autocorrelation Function',4,TRUE)
a<-table.row.end(a)
a<-table.row.start(a)
a<-table.element(a,'Time lag k',header=TRUE)
a<-table.element(a,hyperlink('basics.htm','ACF(k)','click here for more information about the Autocorrelation Function'),header=TRUE)
a<-table.element(a,'T-STAT',header=TRUE)
a<-table.element(a,'P-value',header=TRUE)
a<-table.row.end(a)
for (i in 2:(par1+1)) {
a<-table.row.start(a)
a<-table.element(a,i-1,header=TRUE)
a<-table.element(a,round(myacf[i],6))
mytstat <- myacf[i]*sqrtn
a<-table.element(a,round(mytstat,4))
a<-table.element(a,round(1-pt(abs(mytstat),lengthx),6))
a<-table.row.end(a)
}
a<-table.end(a)
table.save(a,file='mytable.tab')
a<-table.start()
a<-table.row.start(a)
a<-table.element(a,'Partial Autocorrelation Function',4,TRUE)
a<-table.row.end(a)
a<-table.row.start(a)
a<-table.element(a,'Time lag k',header=TRUE)
a<-table.element(a,hyperlink('basics.htm','PACF(k)','click here for more information about the Partial Autocorrelation Function'),header=TRUE)
a<-table.element(a,'T-STAT',header=TRUE)
a<-table.element(a,'P-value',header=TRUE)
a<-table.row.end(a)
for (i in 1:par1) {
a<-table.row.start(a)
a<-table.element(a,i,header=TRUE)
a<-table.element(a,round(mypacf[i],6))
mytstat <- mypacf[i]*sqrtn
a<-table.element(a,round(mytstat,4))
a<-table.element(a,round(1-pt(abs(mytstat),lengthx),6))
a<-table.row.end(a)
}
a<-table.end(a)
table.save(a,file='mytable1.tab')