Free Statistics

of Irreproducible Research!

Author's title

Author*The author of this computation has been verified*
R Software Modulerwasp_autocorrelation.wasp
Title produced by software(Partial) Autocorrelation Function
Date of computationThu, 26 Nov 2009 08:03:09 -0700
Cite this page as followsStatistical Computations at FreeStatistics.org, Office for Research Development and Education, URL https://freestatistics.org/blog/index.php?v=date/2009/Nov/26/t12592479267xs8r8noh3w8zfl.htm/, Retrieved Sun, 28 Apr 2024 21:47:50 +0000
Statistical Computations at FreeStatistics.org, Office for Research Development and Education, URL https://freestatistics.org/blog/index.php?pk=60064, Retrieved Sun, 28 Apr 2024 21:47:50 +0000
QR Codes:

Original text written by user:
IsPrivate?No (this computation is public)
User-defined keywords
Estimated Impact135
Family? (F = Feedback message, R = changed R code, M = changed R Module, P = changed Parameters, D = changed Data)
F       [(Partial) Autocorrelation Function] [] [2009-11-26 15:03:09] [30f5b608e5a1bbbae86b1702c0071566] [Current]
-   P     [(Partial) Autocorrelation Function] [ws8 instellingen ...] [2009-11-27 22:40:14] [cd6314e7e707a6546bd4604c9d1f2b69]
Feedback Forum
2009-11-27 22:46:07 [Joris Van Mol] [reply
Ik merkte op dat je enkele instellingen verkeerd had ingesteld. Ik heb dit even aangepast en hier voor jouw geblogd:

http://www.freestatistics.org/blog/index.php?v=date/2009/Nov/27/t1259361707b0w2wko59x0oyk9.htm/

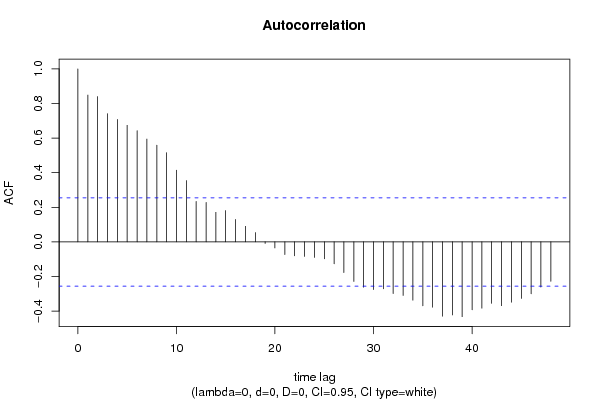
Als 'CI-type' moest je MA selecteren in plaats van white noise.
Het volgende stond daarover te lezen boven de calculator:

* assuming that the series is a MA(k-1) process when the CI of ACF(k) is computed (CI type = MA)


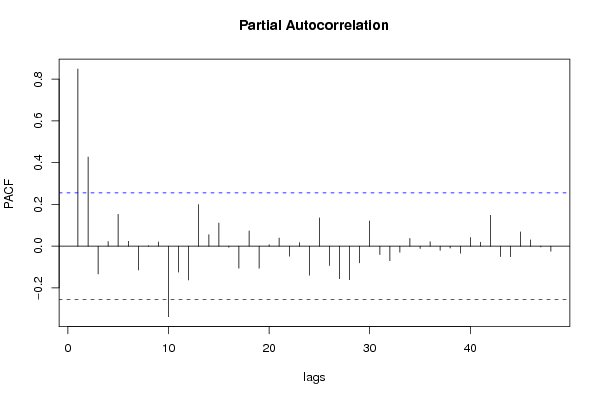
When you use this software to check the residuals of a time series model, CI type = White Noise is appropriate. In all other cases, setting the CI type = MA may be less misleading. Note that the CI of the PACF always assumes white noise.

Het grote verschil is dat bij MA het betrouwbaarheidsinterval nu geen rechte lijntjes zijn maar kromme die breder worden naar rechts toe, dus hoe verder we gaan, hoe meer we mogen afwijken om nog binnen het betrouwbaarheidsinterval terecht te komen.
2009-11-27 22:47:51 [Joris Van Mol] [reply
Ook de lambdawaarde had je blijkbaar op 0 gezet in plaats van op 1 te laten (=neutrale element dus geen transformatie, verheffen tot de macht 1 is het getal zelf)

Post a new message
Dataseries X:
1.3
1.2
1.1
1.4
1.2
1.5
1.1
1.3
1.5
1.1
1.4
1.3
1.5
1.6
1.7
1.1
1.6
1.3
1.7
1.6
1.7
1.9
1.8
1.9
1.6
1.5
1.6
1.6
1.7
2
2
1.9
1.7
1.8
1.9
1.7
2
2.1
2.4
2.5
2.5
2.6
2.2
2.5
2.8
2.8
2.9
3
3.1
2.9
2.7
2.2
2.5
2.3
2.6
2.3
2.2
1.8
1.8


Summary of computational transaction
Raw Inputview raw input (R code)
Raw Outputview raw output of R engine
Computing time1 seconds
R Server'Gwilym Jenkins' @ 72.249.127.135

\begin{tabular}{lllllllll}
\hline
Summary of computational transaction \tabularnewline
Raw Input & view raw input (R code)  \tabularnewline
Raw Output & view raw output of R engine  \tabularnewline
Computing time & 1 seconds \tabularnewline
R Server & 'Gwilym Jenkins' @ 72.249.127.135 \tabularnewline
\hline
\end{tabular}
%Source: https://freestatistics.org/blog/index.php?pk=60064&T=0

[TABLE]
[ROW][C]Summary of computational transaction[/C][/ROW]
[ROW][C]Raw Input[/C][C]view raw input (R code) [/C][/ROW]
[ROW][C]Raw Output[/C][C]view raw output of R engine [/C][/ROW]
[ROW][C]Computing time[/C][C]1 seconds[/C][/ROW]
[ROW][C]R Server[/C][C]'Gwilym Jenkins' @ 72.249.127.135[/C][/ROW]
[/TABLE]
Source: https://freestatistics.org/blog/index.php?pk=60064&T=0

Globally Unique Identifier (entire table): ba.freestatistics.org/blog/index.php?pk=60064&T=0

As an alternative you can also use a QR Code:  

The GUIDs for individual cells are displayed in the table below:

Summary of computational transaction
Raw Inputview raw input (R code)
Raw Outputview raw output of R engine
Computing time1 seconds
R Server'Gwilym Jenkins' @ 72.249.127.135


Autocorrelation Function
Time lag kACF(k)T-STATP-value
10.849156.52240
20.840216.45380
30.7410895.69240
40.7077735.43651e-06
50.6740115.17721e-06
60.6431474.94013e-06
70.5941994.56411.3e-05
80.5594644.29733.3e-05
90.5155553.96010.000102
100.4145433.18420.001159
110.354512.7230.004247
120.233761.79550.038844
130.2280411.75160.042518
140.1708131.3120.097294
150.1811421.39140.084668
160.1299550.99820.161128
170.0898670.69030.246361
180.0536830.41230.340791
19-0.008872-0.06810.472948
20-0.035223-0.27050.393841
21-0.073314-0.56310.287739
22-0.080597-0.61910.269123
23-0.084471-0.64880.259483
24-0.089824-0.68990.246466
25-0.098009-0.75280.227275
26-0.127019-0.97560.166611
27-0.177438-1.36290.089042
28-0.228809-1.75750.042009
29-0.262136-2.01350.024315
30-0.27591-2.11930.019142
31-0.271531-2.08570.020671
32-0.298994-2.29660.012604
33-0.309566-2.37780.010337
34-0.337071-2.58910.00605
35-0.369728-2.83990.003091
36-0.377775-2.90170.002605
37-0.430106-3.30370.000813
38-0.422691-3.24670.000963
39-0.432426-3.32150.00077
40-0.393224-3.02040.001864
41-0.383747-2.94760.002291
42-0.355261-2.72880.004181
43-0.368872-2.83340.003147
44-0.349119-2.68160.004743
45-0.327249-2.51360.007349
46-0.300617-2.30910.01223
47-0.261062-2.00530.024765
48-0.228094-1.7520.042483

\begin{tabular}{lllllllll}
\hline
Autocorrelation Function \tabularnewline
Time lag k & ACF(k) & T-STAT & P-value \tabularnewline
1 & 0.84915 & 6.5224 & 0 \tabularnewline
2 & 0.84021 & 6.4538 & 0 \tabularnewline
3 & 0.741089 & 5.6924 & 0 \tabularnewline
4 & 0.707773 & 5.4365 & 1e-06 \tabularnewline
5 & 0.674011 & 5.1772 & 1e-06 \tabularnewline
6 & 0.643147 & 4.9401 & 3e-06 \tabularnewline
7 & 0.594199 & 4.5641 & 1.3e-05 \tabularnewline
8 & 0.559464 & 4.2973 & 3.3e-05 \tabularnewline
9 & 0.515555 & 3.9601 & 0.000102 \tabularnewline
10 & 0.414543 & 3.1842 & 0.001159 \tabularnewline
11 & 0.35451 & 2.723 & 0.004247 \tabularnewline
12 & 0.23376 & 1.7955 & 0.038844 \tabularnewline
13 & 0.228041 & 1.7516 & 0.042518 \tabularnewline
14 & 0.170813 & 1.312 & 0.097294 \tabularnewline
15 & 0.181142 & 1.3914 & 0.084668 \tabularnewline
16 & 0.129955 & 0.9982 & 0.161128 \tabularnewline
17 & 0.089867 & 0.6903 & 0.246361 \tabularnewline
18 & 0.053683 & 0.4123 & 0.340791 \tabularnewline
19 & -0.008872 & -0.0681 & 0.472948 \tabularnewline
20 & -0.035223 & -0.2705 & 0.393841 \tabularnewline
21 & -0.073314 & -0.5631 & 0.287739 \tabularnewline
22 & -0.080597 & -0.6191 & 0.269123 \tabularnewline
23 & -0.084471 & -0.6488 & 0.259483 \tabularnewline
24 & -0.089824 & -0.6899 & 0.246466 \tabularnewline
25 & -0.098009 & -0.7528 & 0.227275 \tabularnewline
26 & -0.127019 & -0.9756 & 0.166611 \tabularnewline
27 & -0.177438 & -1.3629 & 0.089042 \tabularnewline
28 & -0.228809 & -1.7575 & 0.042009 \tabularnewline
29 & -0.262136 & -2.0135 & 0.024315 \tabularnewline
30 & -0.27591 & -2.1193 & 0.019142 \tabularnewline
31 & -0.271531 & -2.0857 & 0.020671 \tabularnewline
32 & -0.298994 & -2.2966 & 0.012604 \tabularnewline
33 & -0.309566 & -2.3778 & 0.010337 \tabularnewline
34 & -0.337071 & -2.5891 & 0.00605 \tabularnewline
35 & -0.369728 & -2.8399 & 0.003091 \tabularnewline
36 & -0.377775 & -2.9017 & 0.002605 \tabularnewline
37 & -0.430106 & -3.3037 & 0.000813 \tabularnewline
38 & -0.422691 & -3.2467 & 0.000963 \tabularnewline
39 & -0.432426 & -3.3215 & 0.00077 \tabularnewline
40 & -0.393224 & -3.0204 & 0.001864 \tabularnewline
41 & -0.383747 & -2.9476 & 0.002291 \tabularnewline
42 & -0.355261 & -2.7288 & 0.004181 \tabularnewline
43 & -0.368872 & -2.8334 & 0.003147 \tabularnewline
44 & -0.349119 & -2.6816 & 0.004743 \tabularnewline
45 & -0.327249 & -2.5136 & 0.007349 \tabularnewline
46 & -0.300617 & -2.3091 & 0.01223 \tabularnewline
47 & -0.261062 & -2.0053 & 0.024765 \tabularnewline
48 & -0.228094 & -1.752 & 0.042483 \tabularnewline
\hline
\end{tabular}
%Source: https://freestatistics.org/blog/index.php?pk=60064&T=1

[TABLE]
[ROW][C]Autocorrelation Function[/C][/ROW]
[ROW][C]Time lag k[/C][C]ACF(k)[/C][C]T-STAT[/C][C]P-value[/C][/ROW]
[ROW][C]1[/C][C]0.84915[/C][C]6.5224[/C][C]0[/C][/ROW]
[ROW][C]2[/C][C]0.84021[/C][C]6.4538[/C][C]0[/C][/ROW]
[ROW][C]3[/C][C]0.741089[/C][C]5.6924[/C][C]0[/C][/ROW]
[ROW][C]4[/C][C]0.707773[/C][C]5.4365[/C][C]1e-06[/C][/ROW]
[ROW][C]5[/C][C]0.674011[/C][C]5.1772[/C][C]1e-06[/C][/ROW]
[ROW][C]6[/C][C]0.643147[/C][C]4.9401[/C][C]3e-06[/C][/ROW]
[ROW][C]7[/C][C]0.594199[/C][C]4.5641[/C][C]1.3e-05[/C][/ROW]
[ROW][C]8[/C][C]0.559464[/C][C]4.2973[/C][C]3.3e-05[/C][/ROW]
[ROW][C]9[/C][C]0.515555[/C][C]3.9601[/C][C]0.000102[/C][/ROW]
[ROW][C]10[/C][C]0.414543[/C][C]3.1842[/C][C]0.001159[/C][/ROW]
[ROW][C]11[/C][C]0.35451[/C][C]2.723[/C][C]0.004247[/C][/ROW]
[ROW][C]12[/C][C]0.23376[/C][C]1.7955[/C][C]0.038844[/C][/ROW]
[ROW][C]13[/C][C]0.228041[/C][C]1.7516[/C][C]0.042518[/C][/ROW]
[ROW][C]14[/C][C]0.170813[/C][C]1.312[/C][C]0.097294[/C][/ROW]
[ROW][C]15[/C][C]0.181142[/C][C]1.3914[/C][C]0.084668[/C][/ROW]
[ROW][C]16[/C][C]0.129955[/C][C]0.9982[/C][C]0.161128[/C][/ROW]
[ROW][C]17[/C][C]0.089867[/C][C]0.6903[/C][C]0.246361[/C][/ROW]
[ROW][C]18[/C][C]0.053683[/C][C]0.4123[/C][C]0.340791[/C][/ROW]
[ROW][C]19[/C][C]-0.008872[/C][C]-0.0681[/C][C]0.472948[/C][/ROW]
[ROW][C]20[/C][C]-0.035223[/C][C]-0.2705[/C][C]0.393841[/C][/ROW]
[ROW][C]21[/C][C]-0.073314[/C][C]-0.5631[/C][C]0.287739[/C][/ROW]
[ROW][C]22[/C][C]-0.080597[/C][C]-0.6191[/C][C]0.269123[/C][/ROW]
[ROW][C]23[/C][C]-0.084471[/C][C]-0.6488[/C][C]0.259483[/C][/ROW]
[ROW][C]24[/C][C]-0.089824[/C][C]-0.6899[/C][C]0.246466[/C][/ROW]
[ROW][C]25[/C][C]-0.098009[/C][C]-0.7528[/C][C]0.227275[/C][/ROW]
[ROW][C]26[/C][C]-0.127019[/C][C]-0.9756[/C][C]0.166611[/C][/ROW]
[ROW][C]27[/C][C]-0.177438[/C][C]-1.3629[/C][C]0.089042[/C][/ROW]
[ROW][C]28[/C][C]-0.228809[/C][C]-1.7575[/C][C]0.042009[/C][/ROW]
[ROW][C]29[/C][C]-0.262136[/C][C]-2.0135[/C][C]0.024315[/C][/ROW]
[ROW][C]30[/C][C]-0.27591[/C][C]-2.1193[/C][C]0.019142[/C][/ROW]
[ROW][C]31[/C][C]-0.271531[/C][C]-2.0857[/C][C]0.020671[/C][/ROW]
[ROW][C]32[/C][C]-0.298994[/C][C]-2.2966[/C][C]0.012604[/C][/ROW]
[ROW][C]33[/C][C]-0.309566[/C][C]-2.3778[/C][C]0.010337[/C][/ROW]
[ROW][C]34[/C][C]-0.337071[/C][C]-2.5891[/C][C]0.00605[/C][/ROW]
[ROW][C]35[/C][C]-0.369728[/C][C]-2.8399[/C][C]0.003091[/C][/ROW]
[ROW][C]36[/C][C]-0.377775[/C][C]-2.9017[/C][C]0.002605[/C][/ROW]
[ROW][C]37[/C][C]-0.430106[/C][C]-3.3037[/C][C]0.000813[/C][/ROW]
[ROW][C]38[/C][C]-0.422691[/C][C]-3.2467[/C][C]0.000963[/C][/ROW]
[ROW][C]39[/C][C]-0.432426[/C][C]-3.3215[/C][C]0.00077[/C][/ROW]
[ROW][C]40[/C][C]-0.393224[/C][C]-3.0204[/C][C]0.001864[/C][/ROW]
[ROW][C]41[/C][C]-0.383747[/C][C]-2.9476[/C][C]0.002291[/C][/ROW]
[ROW][C]42[/C][C]-0.355261[/C][C]-2.7288[/C][C]0.004181[/C][/ROW]
[ROW][C]43[/C][C]-0.368872[/C][C]-2.8334[/C][C]0.003147[/C][/ROW]
[ROW][C]44[/C][C]-0.349119[/C][C]-2.6816[/C][C]0.004743[/C][/ROW]
[ROW][C]45[/C][C]-0.327249[/C][C]-2.5136[/C][C]0.007349[/C][/ROW]
[ROW][C]46[/C][C]-0.300617[/C][C]-2.3091[/C][C]0.01223[/C][/ROW]
[ROW][C]47[/C][C]-0.261062[/C][C]-2.0053[/C][C]0.024765[/C][/ROW]
[ROW][C]48[/C][C]-0.228094[/C][C]-1.752[/C][C]0.042483[/C][/ROW]
[/TABLE]
Source: https://freestatistics.org/blog/index.php?pk=60064&T=1

Globally Unique Identifier (entire table): ba.freestatistics.org/blog/index.php?pk=60064&T=1

As an alternative you can also use a QR Code:  

The GUIDs for individual cells are displayed in the table below:

Autocorrelation Function
Time lag kACF(k)T-STATP-value
10.849156.52240
20.840216.45380
30.7410895.69240
40.7077735.43651e-06
50.6740115.17721e-06
60.6431474.94013e-06
70.5941994.56411.3e-05
80.5594644.29733.3e-05
90.5155553.96010.000102
100.4145433.18420.001159
110.354512.7230.004247
120.233761.79550.038844
130.2280411.75160.042518
140.1708131.3120.097294
150.1811421.39140.084668
160.1299550.99820.161128
170.0898670.69030.246361
180.0536830.41230.340791
19-0.008872-0.06810.472948
20-0.035223-0.27050.393841
21-0.073314-0.56310.287739
22-0.080597-0.61910.269123
23-0.084471-0.64880.259483
24-0.089824-0.68990.246466
25-0.098009-0.75280.227275
26-0.127019-0.97560.166611
27-0.177438-1.36290.089042
28-0.228809-1.75750.042009
29-0.262136-2.01350.024315
30-0.27591-2.11930.019142
31-0.271531-2.08570.020671
32-0.298994-2.29660.012604
33-0.309566-2.37780.010337
34-0.337071-2.58910.00605
35-0.369728-2.83990.003091
36-0.377775-2.90170.002605
37-0.430106-3.30370.000813
38-0.422691-3.24670.000963
39-0.432426-3.32150.00077
40-0.393224-3.02040.001864
41-0.383747-2.94760.002291
42-0.355261-2.72880.004181
43-0.368872-2.83340.003147
44-0.349119-2.68160.004743
45-0.327249-2.51360.007349
46-0.300617-2.30910.01223
47-0.261062-2.00530.024765
48-0.228094-1.7520.042483


Partial Autocorrelation Function
Time lag kPACF(k)T-STATP-value
10.849156.52240
20.4271633.28110.00087
3-0.133022-1.02180.155532
40.0217030.16670.434086
50.1523361.17010.12333
60.0230440.1770.430054
7-0.113825-0.87430.192748
80.001290.00990.496065
90.0200590.15410.439038
10-0.337911-2.59550.005949
11-0.124122-0.95340.172139
12-0.162143-1.24540.108946
130.1992091.53020.065662
140.0549010.42170.337387
150.1105680.84930.199576
16-0.005176-0.03980.484211
17-0.105924-0.81360.209569
180.072920.56010.288763
19-0.105767-0.81240.209911
200.0066260.05090.479791
210.0387910.2980.383391
22-0.048108-0.36950.356531
230.0166470.12790.449344
24-0.139217-1.06930.144635
250.1349641.03670.152058
26-0.092413-0.70980.240301
27-0.156256-1.20020.117424
28-0.160836-1.23540.110788
29-0.080107-0.61530.270356
300.1207590.92760.178706
31-0.040561-0.31160.37824
32-0.069531-0.53410.297647
33-0.028875-0.22180.412621
340.0368640.28320.389025
35-0.010865-0.08350.466885
360.0214880.16510.434732
37-0.020205-0.15520.438598
38-0.009303-0.07150.471637
39-0.033614-0.25820.398578
400.0415980.31950.375231
410.0191320.1470.441835
420.1477451.13480.130514
43-0.049702-0.38180.352002
44-0.050812-0.39030.348864
450.0678810.52140.302017
460.0297490.22850.410021
47-0.003944-0.03030.487967
48-0.02451-0.18830.425659

\begin{tabular}{lllllllll}
\hline
Partial Autocorrelation Function \tabularnewline
Time lag k & PACF(k) & T-STAT & P-value \tabularnewline
1 & 0.84915 & 6.5224 & 0 \tabularnewline
2 & 0.427163 & 3.2811 & 0.00087 \tabularnewline
3 & -0.133022 & -1.0218 & 0.155532 \tabularnewline
4 & 0.021703 & 0.1667 & 0.434086 \tabularnewline
5 & 0.152336 & 1.1701 & 0.12333 \tabularnewline
6 & 0.023044 & 0.177 & 0.430054 \tabularnewline
7 & -0.113825 & -0.8743 & 0.192748 \tabularnewline
8 & 0.00129 & 0.0099 & 0.496065 \tabularnewline
9 & 0.020059 & 0.1541 & 0.439038 \tabularnewline
10 & -0.337911 & -2.5955 & 0.005949 \tabularnewline
11 & -0.124122 & -0.9534 & 0.172139 \tabularnewline
12 & -0.162143 & -1.2454 & 0.108946 \tabularnewline
13 & 0.199209 & 1.5302 & 0.065662 \tabularnewline
14 & 0.054901 & 0.4217 & 0.337387 \tabularnewline
15 & 0.110568 & 0.8493 & 0.199576 \tabularnewline
16 & -0.005176 & -0.0398 & 0.484211 \tabularnewline
17 & -0.105924 & -0.8136 & 0.209569 \tabularnewline
18 & 0.07292 & 0.5601 & 0.288763 \tabularnewline
19 & -0.105767 & -0.8124 & 0.209911 \tabularnewline
20 & 0.006626 & 0.0509 & 0.479791 \tabularnewline
21 & 0.038791 & 0.298 & 0.383391 \tabularnewline
22 & -0.048108 & -0.3695 & 0.356531 \tabularnewline
23 & 0.016647 & 0.1279 & 0.449344 \tabularnewline
24 & -0.139217 & -1.0693 & 0.144635 \tabularnewline
25 & 0.134964 & 1.0367 & 0.152058 \tabularnewline
26 & -0.092413 & -0.7098 & 0.240301 \tabularnewline
27 & -0.156256 & -1.2002 & 0.117424 \tabularnewline
28 & -0.160836 & -1.2354 & 0.110788 \tabularnewline
29 & -0.080107 & -0.6153 & 0.270356 \tabularnewline
30 & 0.120759 & 0.9276 & 0.178706 \tabularnewline
31 & -0.040561 & -0.3116 & 0.37824 \tabularnewline
32 & -0.069531 & -0.5341 & 0.297647 \tabularnewline
33 & -0.028875 & -0.2218 & 0.412621 \tabularnewline
34 & 0.036864 & 0.2832 & 0.389025 \tabularnewline
35 & -0.010865 & -0.0835 & 0.466885 \tabularnewline
36 & 0.021488 & 0.1651 & 0.434732 \tabularnewline
37 & -0.020205 & -0.1552 & 0.438598 \tabularnewline
38 & -0.009303 & -0.0715 & 0.471637 \tabularnewline
39 & -0.033614 & -0.2582 & 0.398578 \tabularnewline
40 & 0.041598 & 0.3195 & 0.375231 \tabularnewline
41 & 0.019132 & 0.147 & 0.441835 \tabularnewline
42 & 0.147745 & 1.1348 & 0.130514 \tabularnewline
43 & -0.049702 & -0.3818 & 0.352002 \tabularnewline
44 & -0.050812 & -0.3903 & 0.348864 \tabularnewline
45 & 0.067881 & 0.5214 & 0.302017 \tabularnewline
46 & 0.029749 & 0.2285 & 0.410021 \tabularnewline
47 & -0.003944 & -0.0303 & 0.487967 \tabularnewline
48 & -0.02451 & -0.1883 & 0.425659 \tabularnewline
\hline
\end{tabular}
%Source: https://freestatistics.org/blog/index.php?pk=60064&T=2

[TABLE]
[ROW][C]Partial Autocorrelation Function[/C][/ROW]
[ROW][C]Time lag k[/C][C]PACF(k)[/C][C]T-STAT[/C][C]P-value[/C][/ROW]
[ROW][C]1[/C][C]0.84915[/C][C]6.5224[/C][C]0[/C][/ROW]
[ROW][C]2[/C][C]0.427163[/C][C]3.2811[/C][C]0.00087[/C][/ROW]
[ROW][C]3[/C][C]-0.133022[/C][C]-1.0218[/C][C]0.155532[/C][/ROW]
[ROW][C]4[/C][C]0.021703[/C][C]0.1667[/C][C]0.434086[/C][/ROW]
[ROW][C]5[/C][C]0.152336[/C][C]1.1701[/C][C]0.12333[/C][/ROW]
[ROW][C]6[/C][C]0.023044[/C][C]0.177[/C][C]0.430054[/C][/ROW]
[ROW][C]7[/C][C]-0.113825[/C][C]-0.8743[/C][C]0.192748[/C][/ROW]
[ROW][C]8[/C][C]0.00129[/C][C]0.0099[/C][C]0.496065[/C][/ROW]
[ROW][C]9[/C][C]0.020059[/C][C]0.1541[/C][C]0.439038[/C][/ROW]
[ROW][C]10[/C][C]-0.337911[/C][C]-2.5955[/C][C]0.005949[/C][/ROW]
[ROW][C]11[/C][C]-0.124122[/C][C]-0.9534[/C][C]0.172139[/C][/ROW]
[ROW][C]12[/C][C]-0.162143[/C][C]-1.2454[/C][C]0.108946[/C][/ROW]
[ROW][C]13[/C][C]0.199209[/C][C]1.5302[/C][C]0.065662[/C][/ROW]
[ROW][C]14[/C][C]0.054901[/C][C]0.4217[/C][C]0.337387[/C][/ROW]
[ROW][C]15[/C][C]0.110568[/C][C]0.8493[/C][C]0.199576[/C][/ROW]
[ROW][C]16[/C][C]-0.005176[/C][C]-0.0398[/C][C]0.484211[/C][/ROW]
[ROW][C]17[/C][C]-0.105924[/C][C]-0.8136[/C][C]0.209569[/C][/ROW]
[ROW][C]18[/C][C]0.07292[/C][C]0.5601[/C][C]0.288763[/C][/ROW]
[ROW][C]19[/C][C]-0.105767[/C][C]-0.8124[/C][C]0.209911[/C][/ROW]
[ROW][C]20[/C][C]0.006626[/C][C]0.0509[/C][C]0.479791[/C][/ROW]
[ROW][C]21[/C][C]0.038791[/C][C]0.298[/C][C]0.383391[/C][/ROW]
[ROW][C]22[/C][C]-0.048108[/C][C]-0.3695[/C][C]0.356531[/C][/ROW]
[ROW][C]23[/C][C]0.016647[/C][C]0.1279[/C][C]0.449344[/C][/ROW]
[ROW][C]24[/C][C]-0.139217[/C][C]-1.0693[/C][C]0.144635[/C][/ROW]
[ROW][C]25[/C][C]0.134964[/C][C]1.0367[/C][C]0.152058[/C][/ROW]
[ROW][C]26[/C][C]-0.092413[/C][C]-0.7098[/C][C]0.240301[/C][/ROW]
[ROW][C]27[/C][C]-0.156256[/C][C]-1.2002[/C][C]0.117424[/C][/ROW]
[ROW][C]28[/C][C]-0.160836[/C][C]-1.2354[/C][C]0.110788[/C][/ROW]
[ROW][C]29[/C][C]-0.080107[/C][C]-0.6153[/C][C]0.270356[/C][/ROW]
[ROW][C]30[/C][C]0.120759[/C][C]0.9276[/C][C]0.178706[/C][/ROW]
[ROW][C]31[/C][C]-0.040561[/C][C]-0.3116[/C][C]0.37824[/C][/ROW]
[ROW][C]32[/C][C]-0.069531[/C][C]-0.5341[/C][C]0.297647[/C][/ROW]
[ROW][C]33[/C][C]-0.028875[/C][C]-0.2218[/C][C]0.412621[/C][/ROW]
[ROW][C]34[/C][C]0.036864[/C][C]0.2832[/C][C]0.389025[/C][/ROW]
[ROW][C]35[/C][C]-0.010865[/C][C]-0.0835[/C][C]0.466885[/C][/ROW]
[ROW][C]36[/C][C]0.021488[/C][C]0.1651[/C][C]0.434732[/C][/ROW]
[ROW][C]37[/C][C]-0.020205[/C][C]-0.1552[/C][C]0.438598[/C][/ROW]
[ROW][C]38[/C][C]-0.009303[/C][C]-0.0715[/C][C]0.471637[/C][/ROW]
[ROW][C]39[/C][C]-0.033614[/C][C]-0.2582[/C][C]0.398578[/C][/ROW]
[ROW][C]40[/C][C]0.041598[/C][C]0.3195[/C][C]0.375231[/C][/ROW]
[ROW][C]41[/C][C]0.019132[/C][C]0.147[/C][C]0.441835[/C][/ROW]
[ROW][C]42[/C][C]0.147745[/C][C]1.1348[/C][C]0.130514[/C][/ROW]
[ROW][C]43[/C][C]-0.049702[/C][C]-0.3818[/C][C]0.352002[/C][/ROW]
[ROW][C]44[/C][C]-0.050812[/C][C]-0.3903[/C][C]0.348864[/C][/ROW]
[ROW][C]45[/C][C]0.067881[/C][C]0.5214[/C][C]0.302017[/C][/ROW]
[ROW][C]46[/C][C]0.029749[/C][C]0.2285[/C][C]0.410021[/C][/ROW]
[ROW][C]47[/C][C]-0.003944[/C][C]-0.0303[/C][C]0.487967[/C][/ROW]
[ROW][C]48[/C][C]-0.02451[/C][C]-0.1883[/C][C]0.425659[/C][/ROW]
[/TABLE]
Source: https://freestatistics.org/blog/index.php?pk=60064&T=2

Globally Unique Identifier (entire table): ba.freestatistics.org/blog/index.php?pk=60064&T=2

As an alternative you can also use a QR Code:  

The GUIDs for individual cells are displayed in the table below:

Partial Autocorrelation Function
Time lag kPACF(k)T-STATP-value
10.849156.52240
20.4271633.28110.00087
3-0.133022-1.02180.155532
40.0217030.16670.434086
50.1523361.17010.12333
60.0230440.1770.430054
7-0.113825-0.87430.192748
80.001290.00990.496065
90.0200590.15410.439038
10-0.337911-2.59550.005949
11-0.124122-0.95340.172139
12-0.162143-1.24540.108946
130.1992091.53020.065662
140.0549010.42170.337387
150.1105680.84930.199576
16-0.005176-0.03980.484211
17-0.105924-0.81360.209569
180.072920.56010.288763
19-0.105767-0.81240.209911
200.0066260.05090.479791
210.0387910.2980.383391
22-0.048108-0.36950.356531
230.0166470.12790.449344
24-0.139217-1.06930.144635
250.1349641.03670.152058
26-0.092413-0.70980.240301
27-0.156256-1.20020.117424
28-0.160836-1.23540.110788
29-0.080107-0.61530.270356
300.1207590.92760.178706
31-0.040561-0.31160.37824
32-0.069531-0.53410.297647
33-0.028875-0.22180.412621
340.0368640.28320.389025
35-0.010865-0.08350.466885
360.0214880.16510.434732
37-0.020205-0.15520.438598
38-0.009303-0.07150.471637
39-0.033614-0.25820.398578
400.0415980.31950.375231
410.0191320.1470.441835
420.1477451.13480.130514
43-0.049702-0.38180.352002
44-0.050812-0.39030.348864
450.0678810.52140.302017
460.0297490.22850.410021
47-0.003944-0.03030.487967
48-0.02451-0.18830.425659


Parameters (Session):
par1 = 48 ; par2 = 0.0 ; par3 = 0 ; par4 = 0 ; par5 = 12 ; par6 = White Noise ; par7 = 0.95 ;
Parameters (R input):
par1 = 48 ; par2 = 0.0 ; par3 = 0 ; par4 = 0 ; par5 = 12 ; par6 = White Noise ; par7 = 0.95 ;
R code (references can be found in the software module):
if (par1 == 'Default') {
par1 = 10*log10(length(x))
} else {
par1 <- as.numeric(par1)
}
par2 <- as.numeric(par2)
par3 <- as.numeric(par3)
par4 <- as.numeric(par4)
par5 <- as.numeric(par5)
if (par6 == 'White Noise') par6 <- 'white' else par6 <- 'ma'
par7 <- as.numeric(par7)
if (par2 == 0) {
x <- log(x)
} else {
x <- (x ^ par2 - 1) / par2
}
if (par3 > 0) x <- diff(x,lag=1,difference=par3)
if (par4 > 0) x <- diff(x,lag=par5,difference=par4)
bitmap(file='pic1.png')
racf <- acf(x, par1, main='Autocorrelation', xlab='time lag', ylab='ACF', ci.type=par6, ci=par7, sub=paste('(lambda=',par2,', d=',par3,', D=',par4,', CI=', par7, ', CI type=',par6,')',sep=''))
dev.off()
bitmap(file='pic2.png')
rpacf <- pacf(x,par1,main='Partial Autocorrelation',xlab='lags',ylab='PACF')
dev.off()
(myacf <- c(racf$acf))
(mypacf <- c(rpacf$acf))
lengthx <- length(x)
sqrtn <- sqrt(lengthx)
load(file='createtable')
a<-table.start()
a<-table.row.start(a)
a<-table.element(a,'Autocorrelation Function',4,TRUE)
a<-table.row.end(a)
a<-table.row.start(a)
a<-table.element(a,'Time lag k',header=TRUE)
a<-table.element(a,hyperlink('basics.htm','ACF(k)','click here for more information about the Autocorrelation Function'),header=TRUE)
a<-table.element(a,'T-STAT',header=TRUE)
a<-table.element(a,'P-value',header=TRUE)
a<-table.row.end(a)
for (i in 2:(par1+1)) {
a<-table.row.start(a)
a<-table.element(a,i-1,header=TRUE)
a<-table.element(a,round(myacf[i],6))
mytstat <- myacf[i]*sqrtn
a<-table.element(a,round(mytstat,4))
a<-table.element(a,round(1-pt(abs(mytstat),lengthx),6))
a<-table.row.end(a)
}
a<-table.end(a)
table.save(a,file='mytable.tab')
a<-table.start()
a<-table.row.start(a)
a<-table.element(a,'Partial Autocorrelation Function',4,TRUE)
a<-table.row.end(a)
a<-table.row.start(a)
a<-table.element(a,'Time lag k',header=TRUE)
a<-table.element(a,hyperlink('basics.htm','PACF(k)','click here for more information about the Partial Autocorrelation Function'),header=TRUE)
a<-table.element(a,'T-STAT',header=TRUE)
a<-table.element(a,'P-value',header=TRUE)
a<-table.row.end(a)
for (i in 1:par1) {
a<-table.row.start(a)
a<-table.element(a,i,header=TRUE)
a<-table.element(a,round(mypacf[i],6))
mytstat <- mypacf[i]*sqrtn
a<-table.element(a,round(mytstat,4))
a<-table.element(a,round(1-pt(abs(mytstat),lengthx),6))
a<-table.row.end(a)
}
a<-table.end(a)
table.save(a,file='mytable1.tab')