Free Statistics

of Irreproducible Research!

Author's title

Author*The author of this computation has been verified*
R Software Modulerwasp_autocorrelation.wasp
Title produced by software(Partial) Autocorrelation Function
Date of computationThu, 26 Nov 2009 08:21:42 -0700
Cite this page as followsStatistical Computations at FreeStatistics.org, Office for Research Development and Education, URL https://freestatistics.org/blog/index.php?v=date/2009/Nov/26/t1259249161qwp1dimo3r0qykc.htm/, Retrieved Mon, 29 Apr 2024 01:47:40 +0000
Statistical Computations at FreeStatistics.org, Office for Research Development and Education, URL https://freestatistics.org/blog/index.php?pk=60086, Retrieved Mon, 29 Apr 2024 01:47:40 +0000
QR Codes:

Original text written by user:
IsPrivate?No (this computation is public)
User-defined keywords
Estimated Impact146
Family? (F = Feedback message, R = changed R code, M = changed R Module, P = changed Parameters, D = changed Data)
-       [(Partial) Autocorrelation Function] [ACF (d=0 en D=0)] [2009-11-26 15:21:42] [208e60166df5802f3c494097313a670f] [Current]
Feedback Forum

Post a new message
Dataseries X:
1169
2154
2249
2687
4359
5382
4459
6398
4596
3024
1887
2070
1351
2218
2461
3028
4784
4975
4607
6249
4809
3157
1910
2228
1594
2467
2222
3607
4685
4962
5770
5480
5000
3228
1993
2288
1580
2111
2192
3601
4665
4876
5813
5589
5331
3075
2002
2306
1507
1992
2487
3490
4647
5594
5611
5788
6204
3013
1931
2549


Summary of computational transaction
Raw Inputview raw input (R code)
Raw Outputview raw output of R engine
Computing time1 seconds
R Server'Gwilym Jenkins' @ 72.249.127.135

\begin{tabular}{lllllllll}
\hline
Summary of computational transaction \tabularnewline
Raw Input & view raw input (R code)  \tabularnewline
Raw Output & view raw output of R engine  \tabularnewline
Computing time & 1 seconds \tabularnewline
R Server & 'Gwilym Jenkins' @ 72.249.127.135 \tabularnewline
\hline
\end{tabular}
%Source: https://freestatistics.org/blog/index.php?pk=60086&T=0

[TABLE]
[ROW][C]Summary of computational transaction[/C][/ROW]
[ROW][C]Raw Input[/C][C]view raw input (R code) [/C][/ROW]
[ROW][C]Raw Output[/C][C]view raw output of R engine [/C][/ROW]
[ROW][C]Computing time[/C][C]1 seconds[/C][/ROW]
[ROW][C]R Server[/C][C]'Gwilym Jenkins' @ 72.249.127.135[/C][/ROW]
[/TABLE]
Source: https://freestatistics.org/blog/index.php?pk=60086&T=0

Globally Unique Identifier (entire table): ba.freestatistics.org/blog/index.php?pk=60086&T=0

As an alternative you can also use a QR Code:  

The GUIDs for individual cells are displayed in the table below:

Summary of computational transaction
Raw Inputview raw input (R code)
Raw Outputview raw output of R engine
Computing time1 seconds
R Server'Gwilym Jenkins' @ 72.249.127.135


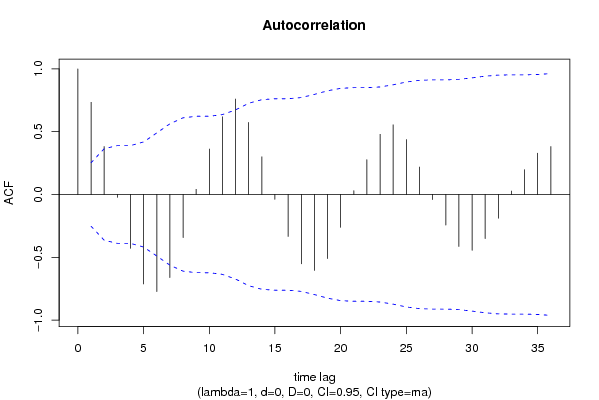
Autocorrelation Function
Time lag kACF(k)T-STATP-value
10.7339475.68510
20.3816542.95630.002223
3-0.023005-0.17820.429585
4-0.428708-3.32080.000766
5-0.713094-5.52360
6-0.773547-5.99190
7-0.661514-5.12412e-06
8-0.343491-2.66070.004995
90.0416610.32270.374022
100.3620292.80430.003393
110.6191114.79566e-06
120.7603265.88950
130.5739544.44581.9e-05
140.2998262.32240.01181
15-0.038743-0.30010.382567
16-0.334578-2.59160.005989
17-0.552546-4.283.4e-05
18-0.604752-4.68448e-06
19-0.510183-3.95190.000103
20-0.261619-2.02650.023583
210.0304940.23620.40704
220.2774072.14880.017848
230.4794713.7140.000225
240.555254.30093.2e-05
250.4377523.39080.000619
260.2188631.69530.047601
27-0.040566-0.31420.377222
28-0.243809-1.88850.031895
29-0.413709-3.20460.001084
30-0.44493-3.44640.000522
31-0.351048-2.71920.004273
32-0.189257-1.4660.073937
330.026830.20780.418035
340.19721.52750.065945
350.3294122.55160.006644
360.3818872.95810.002212

\begin{tabular}{lllllllll}
\hline
Autocorrelation Function \tabularnewline
Time lag k & ACF(k) & T-STAT & P-value \tabularnewline
1 & 0.733947 & 5.6851 & 0 \tabularnewline
2 & 0.381654 & 2.9563 & 0.002223 \tabularnewline
3 & -0.023005 & -0.1782 & 0.429585 \tabularnewline
4 & -0.428708 & -3.3208 & 0.000766 \tabularnewline
5 & -0.713094 & -5.5236 & 0 \tabularnewline
6 & -0.773547 & -5.9919 & 0 \tabularnewline
7 & -0.661514 & -5.1241 & 2e-06 \tabularnewline
8 & -0.343491 & -2.6607 & 0.004995 \tabularnewline
9 & 0.041661 & 0.3227 & 0.374022 \tabularnewline
10 & 0.362029 & 2.8043 & 0.003393 \tabularnewline
11 & 0.619111 & 4.7956 & 6e-06 \tabularnewline
12 & 0.760326 & 5.8895 & 0 \tabularnewline
13 & 0.573954 & 4.4458 & 1.9e-05 \tabularnewline
14 & 0.299826 & 2.3224 & 0.01181 \tabularnewline
15 & -0.038743 & -0.3001 & 0.382567 \tabularnewline
16 & -0.334578 & -2.5916 & 0.005989 \tabularnewline
17 & -0.552546 & -4.28 & 3.4e-05 \tabularnewline
18 & -0.604752 & -4.6844 & 8e-06 \tabularnewline
19 & -0.510183 & -3.9519 & 0.000103 \tabularnewline
20 & -0.261619 & -2.0265 & 0.023583 \tabularnewline
21 & 0.030494 & 0.2362 & 0.40704 \tabularnewline
22 & 0.277407 & 2.1488 & 0.017848 \tabularnewline
23 & 0.479471 & 3.714 & 0.000225 \tabularnewline
24 & 0.55525 & 4.3009 & 3.2e-05 \tabularnewline
25 & 0.437752 & 3.3908 & 0.000619 \tabularnewline
26 & 0.218863 & 1.6953 & 0.047601 \tabularnewline
27 & -0.040566 & -0.3142 & 0.377222 \tabularnewline
28 & -0.243809 & -1.8885 & 0.031895 \tabularnewline
29 & -0.413709 & -3.2046 & 0.001084 \tabularnewline
30 & -0.44493 & -3.4464 & 0.000522 \tabularnewline
31 & -0.351048 & -2.7192 & 0.004273 \tabularnewline
32 & -0.189257 & -1.466 & 0.073937 \tabularnewline
33 & 0.02683 & 0.2078 & 0.418035 \tabularnewline
34 & 0.1972 & 1.5275 & 0.065945 \tabularnewline
35 & 0.329412 & 2.5516 & 0.006644 \tabularnewline
36 & 0.381887 & 2.9581 & 0.002212 \tabularnewline
\hline
\end{tabular}
%Source: https://freestatistics.org/blog/index.php?pk=60086&T=1

[TABLE]
[ROW][C]Autocorrelation Function[/C][/ROW]
[ROW][C]Time lag k[/C][C]ACF(k)[/C][C]T-STAT[/C][C]P-value[/C][/ROW]
[ROW][C]1[/C][C]0.733947[/C][C]5.6851[/C][C]0[/C][/ROW]
[ROW][C]2[/C][C]0.381654[/C][C]2.9563[/C][C]0.002223[/C][/ROW]
[ROW][C]3[/C][C]-0.023005[/C][C]-0.1782[/C][C]0.429585[/C][/ROW]
[ROW][C]4[/C][C]-0.428708[/C][C]-3.3208[/C][C]0.000766[/C][/ROW]
[ROW][C]5[/C][C]-0.713094[/C][C]-5.5236[/C][C]0[/C][/ROW]
[ROW][C]6[/C][C]-0.773547[/C][C]-5.9919[/C][C]0[/C][/ROW]
[ROW][C]7[/C][C]-0.661514[/C][C]-5.1241[/C][C]2e-06[/C][/ROW]
[ROW][C]8[/C][C]-0.343491[/C][C]-2.6607[/C][C]0.004995[/C][/ROW]
[ROW][C]9[/C][C]0.041661[/C][C]0.3227[/C][C]0.374022[/C][/ROW]
[ROW][C]10[/C][C]0.362029[/C][C]2.8043[/C][C]0.003393[/C][/ROW]
[ROW][C]11[/C][C]0.619111[/C][C]4.7956[/C][C]6e-06[/C][/ROW]
[ROW][C]12[/C][C]0.760326[/C][C]5.8895[/C][C]0[/C][/ROW]
[ROW][C]13[/C][C]0.573954[/C][C]4.4458[/C][C]1.9e-05[/C][/ROW]
[ROW][C]14[/C][C]0.299826[/C][C]2.3224[/C][C]0.01181[/C][/ROW]
[ROW][C]15[/C][C]-0.038743[/C][C]-0.3001[/C][C]0.382567[/C][/ROW]
[ROW][C]16[/C][C]-0.334578[/C][C]-2.5916[/C][C]0.005989[/C][/ROW]
[ROW][C]17[/C][C]-0.552546[/C][C]-4.28[/C][C]3.4e-05[/C][/ROW]
[ROW][C]18[/C][C]-0.604752[/C][C]-4.6844[/C][C]8e-06[/C][/ROW]
[ROW][C]19[/C][C]-0.510183[/C][C]-3.9519[/C][C]0.000103[/C][/ROW]
[ROW][C]20[/C][C]-0.261619[/C][C]-2.0265[/C][C]0.023583[/C][/ROW]
[ROW][C]21[/C][C]0.030494[/C][C]0.2362[/C][C]0.40704[/C][/ROW]
[ROW][C]22[/C][C]0.277407[/C][C]2.1488[/C][C]0.017848[/C][/ROW]
[ROW][C]23[/C][C]0.479471[/C][C]3.714[/C][C]0.000225[/C][/ROW]
[ROW][C]24[/C][C]0.55525[/C][C]4.3009[/C][C]3.2e-05[/C][/ROW]
[ROW][C]25[/C][C]0.437752[/C][C]3.3908[/C][C]0.000619[/C][/ROW]
[ROW][C]26[/C][C]0.218863[/C][C]1.6953[/C][C]0.047601[/C][/ROW]
[ROW][C]27[/C][C]-0.040566[/C][C]-0.3142[/C][C]0.377222[/C][/ROW]
[ROW][C]28[/C][C]-0.243809[/C][C]-1.8885[/C][C]0.031895[/C][/ROW]
[ROW][C]29[/C][C]-0.413709[/C][C]-3.2046[/C][C]0.001084[/C][/ROW]
[ROW][C]30[/C][C]-0.44493[/C][C]-3.4464[/C][C]0.000522[/C][/ROW]
[ROW][C]31[/C][C]-0.351048[/C][C]-2.7192[/C][C]0.004273[/C][/ROW]
[ROW][C]32[/C][C]-0.189257[/C][C]-1.466[/C][C]0.073937[/C][/ROW]
[ROW][C]33[/C][C]0.02683[/C][C]0.2078[/C][C]0.418035[/C][/ROW]
[ROW][C]34[/C][C]0.1972[/C][C]1.5275[/C][C]0.065945[/C][/ROW]
[ROW][C]35[/C][C]0.329412[/C][C]2.5516[/C][C]0.006644[/C][/ROW]
[ROW][C]36[/C][C]0.381887[/C][C]2.9581[/C][C]0.002212[/C][/ROW]
[/TABLE]
Source: https://freestatistics.org/blog/index.php?pk=60086&T=1

Globally Unique Identifier (entire table): ba.freestatistics.org/blog/index.php?pk=60086&T=1

As an alternative you can also use a QR Code:  

The GUIDs for individual cells are displayed in the table below:

Autocorrelation Function
Time lag kACF(k)T-STATP-value
10.7339475.68510
20.3816542.95630.002223
3-0.023005-0.17820.429585
4-0.428708-3.32080.000766
5-0.713094-5.52360
6-0.773547-5.99190
7-0.661514-5.12412e-06
8-0.343491-2.66070.004995
90.0416610.32270.374022
100.3620292.80430.003393
110.6191114.79566e-06
120.7603265.88950
130.5739544.44581.9e-05
140.2998262.32240.01181
15-0.038743-0.30010.382567
16-0.334578-2.59160.005989
17-0.552546-4.283.4e-05
18-0.604752-4.68448e-06
19-0.510183-3.95190.000103
20-0.261619-2.02650.023583
210.0304940.23620.40704
220.2774072.14880.017848
230.4794713.7140.000225
240.555254.30093.2e-05
250.4377523.39080.000619
260.2188631.69530.047601
27-0.040566-0.31420.377222
28-0.243809-1.88850.031895
29-0.413709-3.20460.001084
30-0.44493-3.44640.000522
31-0.351048-2.71920.004273
32-0.189257-1.4660.073937
330.026830.20780.418035
340.19721.52750.065945
350.3294122.55160.006644
360.3818872.95810.002212


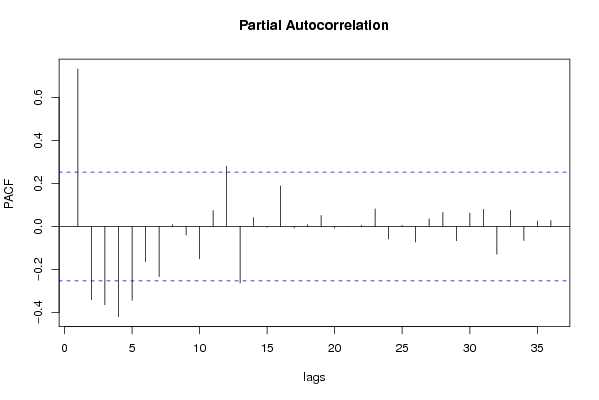
Partial Autocorrelation Function
Time lag kPACF(k)T-STATP-value
10.7339475.68510
2-0.340377-2.63650.005324
3-0.364437-2.82290.003224
4-0.419498-3.24940.000949
5-0.34358-2.66140.004986
6-0.163771-1.26860.104748
7-0.232811-1.80330.038178
80.0095020.07360.470786
9-0.039379-0.3050.3807
10-0.149433-1.15750.125827
110.0744850.5770.283064
120.2815662.1810.016557
13-0.262307-2.03180.023303
140.0418340.3240.373517
15-0.00319-0.02470.490183
160.1889371.46350.074275
17-0.006199-0.0480.480931
180.0084850.06570.473909
190.0518420.40160.344716
20-0.007036-0.05450.47836
21-6.8e-05-5e-040.499791
220.005830.04520.482067
230.0823090.63760.263092
24-0.05741-0.44470.329069
250.0053640.04150.483498
26-0.072212-0.55940.289002
270.0353240.27360.392658
280.0653970.50660.307159
29-0.065869-0.51020.305884
300.0628370.48670.314111
310.0797880.6180.269446
32-0.128936-0.99870.160968
330.0750450.58130.28161
34-0.064591-0.50030.309341
350.0258880.20050.420874
360.0282520.21880.413759

\begin{tabular}{lllllllll}
\hline
Partial Autocorrelation Function \tabularnewline
Time lag k & PACF(k) & T-STAT & P-value \tabularnewline
1 & 0.733947 & 5.6851 & 0 \tabularnewline
2 & -0.340377 & -2.6365 & 0.005324 \tabularnewline
3 & -0.364437 & -2.8229 & 0.003224 \tabularnewline
4 & -0.419498 & -3.2494 & 0.000949 \tabularnewline
5 & -0.34358 & -2.6614 & 0.004986 \tabularnewline
6 & -0.163771 & -1.2686 & 0.104748 \tabularnewline
7 & -0.232811 & -1.8033 & 0.038178 \tabularnewline
8 & 0.009502 & 0.0736 & 0.470786 \tabularnewline
9 & -0.039379 & -0.305 & 0.3807 \tabularnewline
10 & -0.149433 & -1.1575 & 0.125827 \tabularnewline
11 & 0.074485 & 0.577 & 0.283064 \tabularnewline
12 & 0.281566 & 2.181 & 0.016557 \tabularnewline
13 & -0.262307 & -2.0318 & 0.023303 \tabularnewline
14 & 0.041834 & 0.324 & 0.373517 \tabularnewline
15 & -0.00319 & -0.0247 & 0.490183 \tabularnewline
16 & 0.188937 & 1.4635 & 0.074275 \tabularnewline
17 & -0.006199 & -0.048 & 0.480931 \tabularnewline
18 & 0.008485 & 0.0657 & 0.473909 \tabularnewline
19 & 0.051842 & 0.4016 & 0.344716 \tabularnewline
20 & -0.007036 & -0.0545 & 0.47836 \tabularnewline
21 & -6.8e-05 & -5e-04 & 0.499791 \tabularnewline
22 & 0.00583 & 0.0452 & 0.482067 \tabularnewline
23 & 0.082309 & 0.6376 & 0.263092 \tabularnewline
24 & -0.05741 & -0.4447 & 0.329069 \tabularnewline
25 & 0.005364 & 0.0415 & 0.483498 \tabularnewline
26 & -0.072212 & -0.5594 & 0.289002 \tabularnewline
27 & 0.035324 & 0.2736 & 0.392658 \tabularnewline
28 & 0.065397 & 0.5066 & 0.307159 \tabularnewline
29 & -0.065869 & -0.5102 & 0.305884 \tabularnewline
30 & 0.062837 & 0.4867 & 0.314111 \tabularnewline
31 & 0.079788 & 0.618 & 0.269446 \tabularnewline
32 & -0.128936 & -0.9987 & 0.160968 \tabularnewline
33 & 0.075045 & 0.5813 & 0.28161 \tabularnewline
34 & -0.064591 & -0.5003 & 0.309341 \tabularnewline
35 & 0.025888 & 0.2005 & 0.420874 \tabularnewline
36 & 0.028252 & 0.2188 & 0.413759 \tabularnewline
\hline
\end{tabular}
%Source: https://freestatistics.org/blog/index.php?pk=60086&T=2

[TABLE]
[ROW][C]Partial Autocorrelation Function[/C][/ROW]
[ROW][C]Time lag k[/C][C]PACF(k)[/C][C]T-STAT[/C][C]P-value[/C][/ROW]
[ROW][C]1[/C][C]0.733947[/C][C]5.6851[/C][C]0[/C][/ROW]
[ROW][C]2[/C][C]-0.340377[/C][C]-2.6365[/C][C]0.005324[/C][/ROW]
[ROW][C]3[/C][C]-0.364437[/C][C]-2.8229[/C][C]0.003224[/C][/ROW]
[ROW][C]4[/C][C]-0.419498[/C][C]-3.2494[/C][C]0.000949[/C][/ROW]
[ROW][C]5[/C][C]-0.34358[/C][C]-2.6614[/C][C]0.004986[/C][/ROW]
[ROW][C]6[/C][C]-0.163771[/C][C]-1.2686[/C][C]0.104748[/C][/ROW]
[ROW][C]7[/C][C]-0.232811[/C][C]-1.8033[/C][C]0.038178[/C][/ROW]
[ROW][C]8[/C][C]0.009502[/C][C]0.0736[/C][C]0.470786[/C][/ROW]
[ROW][C]9[/C][C]-0.039379[/C][C]-0.305[/C][C]0.3807[/C][/ROW]
[ROW][C]10[/C][C]-0.149433[/C][C]-1.1575[/C][C]0.125827[/C][/ROW]
[ROW][C]11[/C][C]0.074485[/C][C]0.577[/C][C]0.283064[/C][/ROW]
[ROW][C]12[/C][C]0.281566[/C][C]2.181[/C][C]0.016557[/C][/ROW]
[ROW][C]13[/C][C]-0.262307[/C][C]-2.0318[/C][C]0.023303[/C][/ROW]
[ROW][C]14[/C][C]0.041834[/C][C]0.324[/C][C]0.373517[/C][/ROW]
[ROW][C]15[/C][C]-0.00319[/C][C]-0.0247[/C][C]0.490183[/C][/ROW]
[ROW][C]16[/C][C]0.188937[/C][C]1.4635[/C][C]0.074275[/C][/ROW]
[ROW][C]17[/C][C]-0.006199[/C][C]-0.048[/C][C]0.480931[/C][/ROW]
[ROW][C]18[/C][C]0.008485[/C][C]0.0657[/C][C]0.473909[/C][/ROW]
[ROW][C]19[/C][C]0.051842[/C][C]0.4016[/C][C]0.344716[/C][/ROW]
[ROW][C]20[/C][C]-0.007036[/C][C]-0.0545[/C][C]0.47836[/C][/ROW]
[ROW][C]21[/C][C]-6.8e-05[/C][C]-5e-04[/C][C]0.499791[/C][/ROW]
[ROW][C]22[/C][C]0.00583[/C][C]0.0452[/C][C]0.482067[/C][/ROW]
[ROW][C]23[/C][C]0.082309[/C][C]0.6376[/C][C]0.263092[/C][/ROW]
[ROW][C]24[/C][C]-0.05741[/C][C]-0.4447[/C][C]0.329069[/C][/ROW]
[ROW][C]25[/C][C]0.005364[/C][C]0.0415[/C][C]0.483498[/C][/ROW]
[ROW][C]26[/C][C]-0.072212[/C][C]-0.5594[/C][C]0.289002[/C][/ROW]
[ROW][C]27[/C][C]0.035324[/C][C]0.2736[/C][C]0.392658[/C][/ROW]
[ROW][C]28[/C][C]0.065397[/C][C]0.5066[/C][C]0.307159[/C][/ROW]
[ROW][C]29[/C][C]-0.065869[/C][C]-0.5102[/C][C]0.305884[/C][/ROW]
[ROW][C]30[/C][C]0.062837[/C][C]0.4867[/C][C]0.314111[/C][/ROW]
[ROW][C]31[/C][C]0.079788[/C][C]0.618[/C][C]0.269446[/C][/ROW]
[ROW][C]32[/C][C]-0.128936[/C][C]-0.9987[/C][C]0.160968[/C][/ROW]
[ROW][C]33[/C][C]0.075045[/C][C]0.5813[/C][C]0.28161[/C][/ROW]
[ROW][C]34[/C][C]-0.064591[/C][C]-0.5003[/C][C]0.309341[/C][/ROW]
[ROW][C]35[/C][C]0.025888[/C][C]0.2005[/C][C]0.420874[/C][/ROW]
[ROW][C]36[/C][C]0.028252[/C][C]0.2188[/C][C]0.413759[/C][/ROW]
[/TABLE]
Source: https://freestatistics.org/blog/index.php?pk=60086&T=2

Globally Unique Identifier (entire table): ba.freestatistics.org/blog/index.php?pk=60086&T=2

As an alternative you can also use a QR Code:  

The GUIDs for individual cells are displayed in the table below:

Partial Autocorrelation Function
Time lag kPACF(k)T-STATP-value
10.7339475.68510
2-0.340377-2.63650.005324
3-0.364437-2.82290.003224
4-0.419498-3.24940.000949
5-0.34358-2.66140.004986
6-0.163771-1.26860.104748
7-0.232811-1.80330.038178
80.0095020.07360.470786
9-0.039379-0.3050.3807
10-0.149433-1.15750.125827
110.0744850.5770.283064
120.2815662.1810.016557
13-0.262307-2.03180.023303
140.0418340.3240.373517
15-0.00319-0.02470.490183
160.1889371.46350.074275
17-0.006199-0.0480.480931
180.0084850.06570.473909
190.0518420.40160.344716
20-0.007036-0.05450.47836
21-6.8e-05-5e-040.499791
220.005830.04520.482067
230.0823090.63760.263092
24-0.05741-0.44470.329069
250.0053640.04150.483498
26-0.072212-0.55940.289002
270.0353240.27360.392658
280.0653970.50660.307159
29-0.065869-0.51020.305884
300.0628370.48670.314111
310.0797880.6180.269446
32-0.128936-0.99870.160968
330.0750450.58130.28161
34-0.064591-0.50030.309341
350.0258880.20050.420874
360.0282520.21880.413759


Parameters (Session):
par1 = 36 ; par2 = 1 ; par3 = 0 ; par4 = 0 ; par5 = 12 ; par6 = MA ; par7 = 0.95 ;
Parameters (R input):
par1 = 36 ; par2 = 1 ; par3 = 0 ; par4 = 0 ; par5 = 12 ; par6 = MA ; par7 = 0.95 ;
R code (references can be found in the software module):
if (par1 == 'Default') {
par1 = 10*log10(length(x))
} else {
par1 <- as.numeric(par1)
}
par2 <- as.numeric(par2)
par3 <- as.numeric(par3)
par4 <- as.numeric(par4)
par5 <- as.numeric(par5)
if (par6 == 'White Noise') par6 <- 'white' else par6 <- 'ma'
par7 <- as.numeric(par7)
if (par2 == 0) {
x <- log(x)
} else {
x <- (x ^ par2 - 1) / par2
}
if (par3 > 0) x <- diff(x,lag=1,difference=par3)
if (par4 > 0) x <- diff(x,lag=par5,difference=par4)
bitmap(file='pic1.png')
racf <- acf(x, par1, main='Autocorrelation', xlab='time lag', ylab='ACF', ci.type=par6, ci=par7, sub=paste('(lambda=',par2,', d=',par3,', D=',par4,', CI=', par7, ', CI type=',par6,')',sep=''))
dev.off()
bitmap(file='pic2.png')
rpacf <- pacf(x,par1,main='Partial Autocorrelation',xlab='lags',ylab='PACF')
dev.off()
(myacf <- c(racf$acf))
(mypacf <- c(rpacf$acf))
lengthx <- length(x)
sqrtn <- sqrt(lengthx)
load(file='createtable')
a<-table.start()
a<-table.row.start(a)
a<-table.element(a,'Autocorrelation Function',4,TRUE)
a<-table.row.end(a)
a<-table.row.start(a)
a<-table.element(a,'Time lag k',header=TRUE)
a<-table.element(a,hyperlink('basics.htm','ACF(k)','click here for more information about the Autocorrelation Function'),header=TRUE)
a<-table.element(a,'T-STAT',header=TRUE)
a<-table.element(a,'P-value',header=TRUE)
a<-table.row.end(a)
for (i in 2:(par1+1)) {
a<-table.row.start(a)
a<-table.element(a,i-1,header=TRUE)
a<-table.element(a,round(myacf[i],6))
mytstat <- myacf[i]*sqrtn
a<-table.element(a,round(mytstat,4))
a<-table.element(a,round(1-pt(abs(mytstat),lengthx),6))
a<-table.row.end(a)
}
a<-table.end(a)
table.save(a,file='mytable.tab')
a<-table.start()
a<-table.row.start(a)
a<-table.element(a,'Partial Autocorrelation Function',4,TRUE)
a<-table.row.end(a)
a<-table.row.start(a)
a<-table.element(a,'Time lag k',header=TRUE)
a<-table.element(a,hyperlink('basics.htm','PACF(k)','click here for more information about the Partial Autocorrelation Function'),header=TRUE)
a<-table.element(a,'T-STAT',header=TRUE)
a<-table.element(a,'P-value',header=TRUE)
a<-table.row.end(a)
for (i in 1:par1) {
a<-table.row.start(a)
a<-table.element(a,i,header=TRUE)
a<-table.element(a,round(mypacf[i],6))
mytstat <- mypacf[i]*sqrtn
a<-table.element(a,round(mytstat,4))
a<-table.element(a,round(1-pt(abs(mytstat),lengthx),6))
a<-table.row.end(a)
}
a<-table.end(a)
table.save(a,file='mytable1.tab')