Free Statistics

of Irreproducible Research!

Author's title

Author*The author of this computation has been verified*
R Software Modulerwasp_autocorrelation.wasp
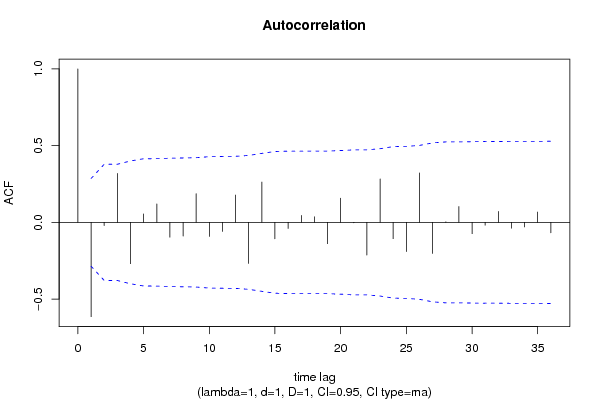
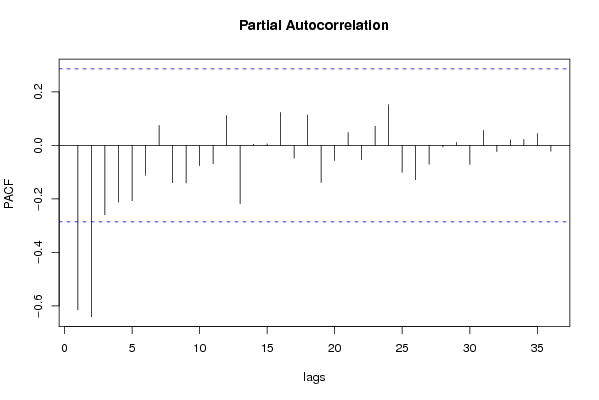
Title produced by software(Partial) Autocorrelation Function
Date of computationThu, 26 Nov 2009 08:30:00 -0700
Cite this page as followsStatistical Computations at FreeStatistics.org, Office for Research Development and Education, URL https://freestatistics.org/blog/index.php?v=date/2009/Nov/26/t1259249437fmu3ybb6nib0z8q.htm/, Retrieved Mon, 29 Apr 2024 06:29:20 +0000
Statistical Computations at FreeStatistics.org, Office for Research Development and Education, URL https://freestatistics.org/blog/index.php?pk=60096, Retrieved Mon, 29 Apr 2024 06:29:20 +0000
QR Codes:

Original text written by user:
IsPrivate?No (this computation is public)
User-defined keywords
Estimated Impact130
Family? (F = Feedback message, R = changed R code, M = changed R Module, P = changed Parameters, D = changed Data)
-       [(Partial) Autocorrelation Function] [ACF (d=1 en D=1)] [2009-11-26 15:30:00] [208e60166df5802f3c494097313a670f] [Current]
Feedback Forum

Post a new message
Dataseries X:
1169
2154
2249
2687
4359
5382
4459
6398
4596
3024
1887
2070
1351
2218
2461
3028
4784
4975
4607
6249
4809
3157
1910
2228
1594
2467
2222
3607
4685
4962
5770
5480
5000
3228
1993
2288
1580
2111
2192
3601
4665
4876
5813
5589
5331
3075
2002
2306
1507
1992
2487
3490
4647
5594
5611
5788
6204
3013
1931
2549


Summary of computational transaction
Raw Inputview raw input (R code)
Raw Outputview raw output of R engine
Computing time1 seconds
R Server'Gwilym Jenkins' @ 72.249.127.135

\begin{tabular}{lllllllll}
\hline
Summary of computational transaction \tabularnewline
Raw Input & view raw input (R code)  \tabularnewline
Raw Output & view raw output of R engine  \tabularnewline
Computing time & 1 seconds \tabularnewline
R Server & 'Gwilym Jenkins' @ 72.249.127.135 \tabularnewline
\hline
\end{tabular}
%Source: https://freestatistics.org/blog/index.php?pk=60096&T=0

[TABLE]
[ROW][C]Summary of computational transaction[/C][/ROW]
[ROW][C]Raw Input[/C][C]view raw input (R code) [/C][/ROW]
[ROW][C]Raw Output[/C][C]view raw output of R engine [/C][/ROW]
[ROW][C]Computing time[/C][C]1 seconds[/C][/ROW]
[ROW][C]R Server[/C][C]'Gwilym Jenkins' @ 72.249.127.135[/C][/ROW]
[/TABLE]
Source: https://freestatistics.org/blog/index.php?pk=60096&T=0

Globally Unique Identifier (entire table): ba.freestatistics.org/blog/index.php?pk=60096&T=0

As an alternative you can also use a QR Code:  

The GUIDs for individual cells are displayed in the table below:

Summary of computational transaction
Raw Inputview raw input (R code)
Raw Outputview raw output of R engine
Computing time1 seconds
R Server'Gwilym Jenkins' @ 72.249.127.135


Autocorrelation Function
Time lag kACF(k)T-STATP-value
1-0.614537-4.21315.7e-05
2-0.020815-0.14270.443569
30.3191932.18830.016827
4-0.269057-1.84460.035704
50.0548560.37610.354278
60.1200050.82270.207414
7-0.096924-0.66450.254817
8-0.08953-0.61380.271158
90.1866881.27990.103437
10-0.092027-0.63090.265579
11-0.058995-0.40450.343858
120.1775961.21750.114739
13-0.268125-1.83820.036181
140.2625611.80.039138
15-0.106865-0.73260.233711
16-0.03937-0.26990.394207
170.0448550.30750.379907
180.0366460.25120.401364
19-0.138844-0.95190.173018
200.1572651.07820.143233
21-0.002901-0.01990.492107
22-0.213272-1.46210.075182
230.2829111.93950.029225
24-0.10651-0.73020.234448
25-0.190552-1.30640.098894
260.3219622.20730.016107
27-0.202166-1.3860.086147
280.0039510.02710.489252
290.1028530.70510.242106
30-0.073782-0.50580.307672
31-0.018516-0.12690.449764
320.0716370.49110.312813
33-0.037687-0.25840.398624
34-0.030019-0.20580.418918
350.0669630.45910.324147
36-0.067858-0.46520.321965

\begin{tabular}{lllllllll}
\hline
Autocorrelation Function \tabularnewline
Time lag k & ACF(k) & T-STAT & P-value \tabularnewline
1 & -0.614537 & -4.2131 & 5.7e-05 \tabularnewline
2 & -0.020815 & -0.1427 & 0.443569 \tabularnewline
3 & 0.319193 & 2.1883 & 0.016827 \tabularnewline
4 & -0.269057 & -1.8446 & 0.035704 \tabularnewline
5 & 0.054856 & 0.3761 & 0.354278 \tabularnewline
6 & 0.120005 & 0.8227 & 0.207414 \tabularnewline
7 & -0.096924 & -0.6645 & 0.254817 \tabularnewline
8 & -0.08953 & -0.6138 & 0.271158 \tabularnewline
9 & 0.186688 & 1.2799 & 0.103437 \tabularnewline
10 & -0.092027 & -0.6309 & 0.265579 \tabularnewline
11 & -0.058995 & -0.4045 & 0.343858 \tabularnewline
12 & 0.177596 & 1.2175 & 0.114739 \tabularnewline
13 & -0.268125 & -1.8382 & 0.036181 \tabularnewline
14 & 0.262561 & 1.8 & 0.039138 \tabularnewline
15 & -0.106865 & -0.7326 & 0.233711 \tabularnewline
16 & -0.03937 & -0.2699 & 0.394207 \tabularnewline
17 & 0.044855 & 0.3075 & 0.379907 \tabularnewline
18 & 0.036646 & 0.2512 & 0.401364 \tabularnewline
19 & -0.138844 & -0.9519 & 0.173018 \tabularnewline
20 & 0.157265 & 1.0782 & 0.143233 \tabularnewline
21 & -0.002901 & -0.0199 & 0.492107 \tabularnewline
22 & -0.213272 & -1.4621 & 0.075182 \tabularnewline
23 & 0.282911 & 1.9395 & 0.029225 \tabularnewline
24 & -0.10651 & -0.7302 & 0.234448 \tabularnewline
25 & -0.190552 & -1.3064 & 0.098894 \tabularnewline
26 & 0.321962 & 2.2073 & 0.016107 \tabularnewline
27 & -0.202166 & -1.386 & 0.086147 \tabularnewline
28 & 0.003951 & 0.0271 & 0.489252 \tabularnewline
29 & 0.102853 & 0.7051 & 0.242106 \tabularnewline
30 & -0.073782 & -0.5058 & 0.307672 \tabularnewline
31 & -0.018516 & -0.1269 & 0.449764 \tabularnewline
32 & 0.071637 & 0.4911 & 0.312813 \tabularnewline
33 & -0.037687 & -0.2584 & 0.398624 \tabularnewline
34 & -0.030019 & -0.2058 & 0.418918 \tabularnewline
35 & 0.066963 & 0.4591 & 0.324147 \tabularnewline
36 & -0.067858 & -0.4652 & 0.321965 \tabularnewline
\hline
\end{tabular}
%Source: https://freestatistics.org/blog/index.php?pk=60096&T=1

[TABLE]
[ROW][C]Autocorrelation Function[/C][/ROW]
[ROW][C]Time lag k[/C][C]ACF(k)[/C][C]T-STAT[/C][C]P-value[/C][/ROW]
[ROW][C]1[/C][C]-0.614537[/C][C]-4.2131[/C][C]5.7e-05[/C][/ROW]
[ROW][C]2[/C][C]-0.020815[/C][C]-0.1427[/C][C]0.443569[/C][/ROW]
[ROW][C]3[/C][C]0.319193[/C][C]2.1883[/C][C]0.016827[/C][/ROW]
[ROW][C]4[/C][C]-0.269057[/C][C]-1.8446[/C][C]0.035704[/C][/ROW]
[ROW][C]5[/C][C]0.054856[/C][C]0.3761[/C][C]0.354278[/C][/ROW]
[ROW][C]6[/C][C]0.120005[/C][C]0.8227[/C][C]0.207414[/C][/ROW]
[ROW][C]7[/C][C]-0.096924[/C][C]-0.6645[/C][C]0.254817[/C][/ROW]
[ROW][C]8[/C][C]-0.08953[/C][C]-0.6138[/C][C]0.271158[/C][/ROW]
[ROW][C]9[/C][C]0.186688[/C][C]1.2799[/C][C]0.103437[/C][/ROW]
[ROW][C]10[/C][C]-0.092027[/C][C]-0.6309[/C][C]0.265579[/C][/ROW]
[ROW][C]11[/C][C]-0.058995[/C][C]-0.4045[/C][C]0.343858[/C][/ROW]
[ROW][C]12[/C][C]0.177596[/C][C]1.2175[/C][C]0.114739[/C][/ROW]
[ROW][C]13[/C][C]-0.268125[/C][C]-1.8382[/C][C]0.036181[/C][/ROW]
[ROW][C]14[/C][C]0.262561[/C][C]1.8[/C][C]0.039138[/C][/ROW]
[ROW][C]15[/C][C]-0.106865[/C][C]-0.7326[/C][C]0.233711[/C][/ROW]
[ROW][C]16[/C][C]-0.03937[/C][C]-0.2699[/C][C]0.394207[/C][/ROW]
[ROW][C]17[/C][C]0.044855[/C][C]0.3075[/C][C]0.379907[/C][/ROW]
[ROW][C]18[/C][C]0.036646[/C][C]0.2512[/C][C]0.401364[/C][/ROW]
[ROW][C]19[/C][C]-0.138844[/C][C]-0.9519[/C][C]0.173018[/C][/ROW]
[ROW][C]20[/C][C]0.157265[/C][C]1.0782[/C][C]0.143233[/C][/ROW]
[ROW][C]21[/C][C]-0.002901[/C][C]-0.0199[/C][C]0.492107[/C][/ROW]
[ROW][C]22[/C][C]-0.213272[/C][C]-1.4621[/C][C]0.075182[/C][/ROW]
[ROW][C]23[/C][C]0.282911[/C][C]1.9395[/C][C]0.029225[/C][/ROW]
[ROW][C]24[/C][C]-0.10651[/C][C]-0.7302[/C][C]0.234448[/C][/ROW]
[ROW][C]25[/C][C]-0.190552[/C][C]-1.3064[/C][C]0.098894[/C][/ROW]
[ROW][C]26[/C][C]0.321962[/C][C]2.2073[/C][C]0.016107[/C][/ROW]
[ROW][C]27[/C][C]-0.202166[/C][C]-1.386[/C][C]0.086147[/C][/ROW]
[ROW][C]28[/C][C]0.003951[/C][C]0.0271[/C][C]0.489252[/C][/ROW]
[ROW][C]29[/C][C]0.102853[/C][C]0.7051[/C][C]0.242106[/C][/ROW]
[ROW][C]30[/C][C]-0.073782[/C][C]-0.5058[/C][C]0.307672[/C][/ROW]
[ROW][C]31[/C][C]-0.018516[/C][C]-0.1269[/C][C]0.449764[/C][/ROW]
[ROW][C]32[/C][C]0.071637[/C][C]0.4911[/C][C]0.312813[/C][/ROW]
[ROW][C]33[/C][C]-0.037687[/C][C]-0.2584[/C][C]0.398624[/C][/ROW]
[ROW][C]34[/C][C]-0.030019[/C][C]-0.2058[/C][C]0.418918[/C][/ROW]
[ROW][C]35[/C][C]0.066963[/C][C]0.4591[/C][C]0.324147[/C][/ROW]
[ROW][C]36[/C][C]-0.067858[/C][C]-0.4652[/C][C]0.321965[/C][/ROW]
[/TABLE]
Source: https://freestatistics.org/blog/index.php?pk=60096&T=1

Globally Unique Identifier (entire table): ba.freestatistics.org/blog/index.php?pk=60096&T=1

As an alternative you can also use a QR Code:  

The GUIDs for individual cells are displayed in the table below:

Autocorrelation Function
Time lag kACF(k)T-STATP-value
1-0.614537-4.21315.7e-05
2-0.020815-0.14270.443569
30.3191932.18830.016827
4-0.269057-1.84460.035704
50.0548560.37610.354278
60.1200050.82270.207414
7-0.096924-0.66450.254817
8-0.08953-0.61380.271158
90.1866881.27990.103437
10-0.092027-0.63090.265579
11-0.058995-0.40450.343858
120.1775961.21750.114739
13-0.268125-1.83820.036181
140.2625611.80.039138
15-0.106865-0.73260.233711
16-0.03937-0.26990.394207
170.0448550.30750.379907
180.0366460.25120.401364
19-0.138844-0.95190.173018
200.1572651.07820.143233
21-0.002901-0.01990.492107
22-0.213272-1.46210.075182
230.2829111.93950.029225
24-0.10651-0.73020.234448
25-0.190552-1.30640.098894
260.3219622.20730.016107
27-0.202166-1.3860.086147
280.0039510.02710.489252
290.1028530.70510.242106
30-0.073782-0.50580.307672
31-0.018516-0.12690.449764
320.0716370.49110.312813
33-0.037687-0.25840.398624
34-0.030019-0.20580.418918
350.0669630.45910.324147
36-0.067858-0.46520.321965


Partial Autocorrelation Function
Time lag kPACF(k)T-STATP-value
1-0.614537-4.21315.7e-05
2-0.640273-4.38953.2e-05
3-0.25941-1.77840.040901
4-0.211616-1.45080.076743
5-0.206885-1.41830.081346
6-0.111736-0.7660.223747
70.0747080.51220.305464
8-0.139517-0.95650.171862
9-0.140542-0.96350.170111
10-0.075279-0.51610.304107
11-0.068668-0.47080.319994
120.1115350.76460.224153
13-0.217643-1.49210.07118
140.0040890.0280.488879
150.0060820.04170.483458
160.1234310.84620.200864
17-0.047907-0.32840.372022
180.1136840.77940.219833
19-0.1385-0.94950.17361
20-0.055987-0.38380.351418
210.0478460.3280.372177
22-0.05331-0.36550.358199
230.0716910.49150.312684
240.1524681.04530.150623
25-0.100498-0.6890.247111
26-0.128088-0.87810.19217
27-0.070244-0.48160.316173
28-0.005938-0.04070.483849
290.0111760.07660.469627
30-0.071218-0.48820.313822
310.0560760.38440.351194
32-0.023191-0.1590.437179
330.0207310.14210.443794
340.0224270.15380.439231
350.0440460.3020.382005
36-0.021533-0.14760.441635

\begin{tabular}{lllllllll}
\hline
Partial Autocorrelation Function \tabularnewline
Time lag k & PACF(k) & T-STAT & P-value \tabularnewline
1 & -0.614537 & -4.2131 & 5.7e-05 \tabularnewline
2 & -0.640273 & -4.3895 & 3.2e-05 \tabularnewline
3 & -0.25941 & -1.7784 & 0.040901 \tabularnewline
4 & -0.211616 & -1.4508 & 0.076743 \tabularnewline
5 & -0.206885 & -1.4183 & 0.081346 \tabularnewline
6 & -0.111736 & -0.766 & 0.223747 \tabularnewline
7 & 0.074708 & 0.5122 & 0.305464 \tabularnewline
8 & -0.139517 & -0.9565 & 0.171862 \tabularnewline
9 & -0.140542 & -0.9635 & 0.170111 \tabularnewline
10 & -0.075279 & -0.5161 & 0.304107 \tabularnewline
11 & -0.068668 & -0.4708 & 0.319994 \tabularnewline
12 & 0.111535 & 0.7646 & 0.224153 \tabularnewline
13 & -0.217643 & -1.4921 & 0.07118 \tabularnewline
14 & 0.004089 & 0.028 & 0.488879 \tabularnewline
15 & 0.006082 & 0.0417 & 0.483458 \tabularnewline
16 & 0.123431 & 0.8462 & 0.200864 \tabularnewline
17 & -0.047907 & -0.3284 & 0.372022 \tabularnewline
18 & 0.113684 & 0.7794 & 0.219833 \tabularnewline
19 & -0.1385 & -0.9495 & 0.17361 \tabularnewline
20 & -0.055987 & -0.3838 & 0.351418 \tabularnewline
21 & 0.047846 & 0.328 & 0.372177 \tabularnewline
22 & -0.05331 & -0.3655 & 0.358199 \tabularnewline
23 & 0.071691 & 0.4915 & 0.312684 \tabularnewline
24 & 0.152468 & 1.0453 & 0.150623 \tabularnewline
25 & -0.100498 & -0.689 & 0.247111 \tabularnewline
26 & -0.128088 & -0.8781 & 0.19217 \tabularnewline
27 & -0.070244 & -0.4816 & 0.316173 \tabularnewline
28 & -0.005938 & -0.0407 & 0.483849 \tabularnewline
29 & 0.011176 & 0.0766 & 0.469627 \tabularnewline
30 & -0.071218 & -0.4882 & 0.313822 \tabularnewline
31 & 0.056076 & 0.3844 & 0.351194 \tabularnewline
32 & -0.023191 & -0.159 & 0.437179 \tabularnewline
33 & 0.020731 & 0.1421 & 0.443794 \tabularnewline
34 & 0.022427 & 0.1538 & 0.439231 \tabularnewline
35 & 0.044046 & 0.302 & 0.382005 \tabularnewline
36 & -0.021533 & -0.1476 & 0.441635 \tabularnewline
\hline
\end{tabular}
%Source: https://freestatistics.org/blog/index.php?pk=60096&T=2

[TABLE]
[ROW][C]Partial Autocorrelation Function[/C][/ROW]
[ROW][C]Time lag k[/C][C]PACF(k)[/C][C]T-STAT[/C][C]P-value[/C][/ROW]
[ROW][C]1[/C][C]-0.614537[/C][C]-4.2131[/C][C]5.7e-05[/C][/ROW]
[ROW][C]2[/C][C]-0.640273[/C][C]-4.3895[/C][C]3.2e-05[/C][/ROW]
[ROW][C]3[/C][C]-0.25941[/C][C]-1.7784[/C][C]0.040901[/C][/ROW]
[ROW][C]4[/C][C]-0.211616[/C][C]-1.4508[/C][C]0.076743[/C][/ROW]
[ROW][C]5[/C][C]-0.206885[/C][C]-1.4183[/C][C]0.081346[/C][/ROW]
[ROW][C]6[/C][C]-0.111736[/C][C]-0.766[/C][C]0.223747[/C][/ROW]
[ROW][C]7[/C][C]0.074708[/C][C]0.5122[/C][C]0.305464[/C][/ROW]
[ROW][C]8[/C][C]-0.139517[/C][C]-0.9565[/C][C]0.171862[/C][/ROW]
[ROW][C]9[/C][C]-0.140542[/C][C]-0.9635[/C][C]0.170111[/C][/ROW]
[ROW][C]10[/C][C]-0.075279[/C][C]-0.5161[/C][C]0.304107[/C][/ROW]
[ROW][C]11[/C][C]-0.068668[/C][C]-0.4708[/C][C]0.319994[/C][/ROW]
[ROW][C]12[/C][C]0.111535[/C][C]0.7646[/C][C]0.224153[/C][/ROW]
[ROW][C]13[/C][C]-0.217643[/C][C]-1.4921[/C][C]0.07118[/C][/ROW]
[ROW][C]14[/C][C]0.004089[/C][C]0.028[/C][C]0.488879[/C][/ROW]
[ROW][C]15[/C][C]0.006082[/C][C]0.0417[/C][C]0.483458[/C][/ROW]
[ROW][C]16[/C][C]0.123431[/C][C]0.8462[/C][C]0.200864[/C][/ROW]
[ROW][C]17[/C][C]-0.047907[/C][C]-0.3284[/C][C]0.372022[/C][/ROW]
[ROW][C]18[/C][C]0.113684[/C][C]0.7794[/C][C]0.219833[/C][/ROW]
[ROW][C]19[/C][C]-0.1385[/C][C]-0.9495[/C][C]0.17361[/C][/ROW]
[ROW][C]20[/C][C]-0.055987[/C][C]-0.3838[/C][C]0.351418[/C][/ROW]
[ROW][C]21[/C][C]0.047846[/C][C]0.328[/C][C]0.372177[/C][/ROW]
[ROW][C]22[/C][C]-0.05331[/C][C]-0.3655[/C][C]0.358199[/C][/ROW]
[ROW][C]23[/C][C]0.071691[/C][C]0.4915[/C][C]0.312684[/C][/ROW]
[ROW][C]24[/C][C]0.152468[/C][C]1.0453[/C][C]0.150623[/C][/ROW]
[ROW][C]25[/C][C]-0.100498[/C][C]-0.689[/C][C]0.247111[/C][/ROW]
[ROW][C]26[/C][C]-0.128088[/C][C]-0.8781[/C][C]0.19217[/C][/ROW]
[ROW][C]27[/C][C]-0.070244[/C][C]-0.4816[/C][C]0.316173[/C][/ROW]
[ROW][C]28[/C][C]-0.005938[/C][C]-0.0407[/C][C]0.483849[/C][/ROW]
[ROW][C]29[/C][C]0.011176[/C][C]0.0766[/C][C]0.469627[/C][/ROW]
[ROW][C]30[/C][C]-0.071218[/C][C]-0.4882[/C][C]0.313822[/C][/ROW]
[ROW][C]31[/C][C]0.056076[/C][C]0.3844[/C][C]0.351194[/C][/ROW]
[ROW][C]32[/C][C]-0.023191[/C][C]-0.159[/C][C]0.437179[/C][/ROW]
[ROW][C]33[/C][C]0.020731[/C][C]0.1421[/C][C]0.443794[/C][/ROW]
[ROW][C]34[/C][C]0.022427[/C][C]0.1538[/C][C]0.439231[/C][/ROW]
[ROW][C]35[/C][C]0.044046[/C][C]0.302[/C][C]0.382005[/C][/ROW]
[ROW][C]36[/C][C]-0.021533[/C][C]-0.1476[/C][C]0.441635[/C][/ROW]
[/TABLE]
Source: https://freestatistics.org/blog/index.php?pk=60096&T=2

Globally Unique Identifier (entire table): ba.freestatistics.org/blog/index.php?pk=60096&T=2

As an alternative you can also use a QR Code:  

The GUIDs for individual cells are displayed in the table below:

Partial Autocorrelation Function
Time lag kPACF(k)T-STATP-value
1-0.614537-4.21315.7e-05
2-0.640273-4.38953.2e-05
3-0.25941-1.77840.040901
4-0.211616-1.45080.076743
5-0.206885-1.41830.081346
6-0.111736-0.7660.223747
70.0747080.51220.305464
8-0.139517-0.95650.171862
9-0.140542-0.96350.170111
10-0.075279-0.51610.304107
11-0.068668-0.47080.319994
120.1115350.76460.224153
13-0.217643-1.49210.07118
140.0040890.0280.488879
150.0060820.04170.483458
160.1234310.84620.200864
17-0.047907-0.32840.372022
180.1136840.77940.219833
19-0.1385-0.94950.17361
20-0.055987-0.38380.351418
210.0478460.3280.372177
22-0.05331-0.36550.358199
230.0716910.49150.312684
240.1524681.04530.150623
25-0.100498-0.6890.247111
26-0.128088-0.87810.19217
27-0.070244-0.48160.316173
28-0.005938-0.04070.483849
290.0111760.07660.469627
30-0.071218-0.48820.313822
310.0560760.38440.351194
32-0.023191-0.1590.437179
330.0207310.14210.443794
340.0224270.15380.439231
350.0440460.3020.382005
36-0.021533-0.14760.441635


Parameters (Session):
par1 = 36 ; par2 = 1 ; par3 = 1 ; par4 = 1 ; par5 = 12 ; par6 = MA ; par7 = 0.95 ;
Parameters (R input):
par1 = 36 ; par2 = 1 ; par3 = 1 ; par4 = 1 ; par5 = 12 ; par6 = MA ; par7 = 0.95 ;
R code (references can be found in the software module):
if (par1 == 'Default') {
par1 = 10*log10(length(x))
} else {
par1 <- as.numeric(par1)
}
par2 <- as.numeric(par2)
par3 <- as.numeric(par3)
par4 <- as.numeric(par4)
par5 <- as.numeric(par5)
if (par6 == 'White Noise') par6 <- 'white' else par6 <- 'ma'
par7 <- as.numeric(par7)
if (par2 == 0) {
x <- log(x)
} else {
x <- (x ^ par2 - 1) / par2
}
if (par3 > 0) x <- diff(x,lag=1,difference=par3)
if (par4 > 0) x <- diff(x,lag=par5,difference=par4)
bitmap(file='pic1.png')
racf <- acf(x, par1, main='Autocorrelation', xlab='time lag', ylab='ACF', ci.type=par6, ci=par7, sub=paste('(lambda=',par2,', d=',par3,', D=',par4,', CI=', par7, ', CI type=',par6,')',sep=''))
dev.off()
bitmap(file='pic2.png')
rpacf <- pacf(x,par1,main='Partial Autocorrelation',xlab='lags',ylab='PACF')
dev.off()
(myacf <- c(racf$acf))
(mypacf <- c(rpacf$acf))
lengthx <- length(x)
sqrtn <- sqrt(lengthx)
load(file='createtable')
a<-table.start()
a<-table.row.start(a)
a<-table.element(a,'Autocorrelation Function',4,TRUE)
a<-table.row.end(a)
a<-table.row.start(a)
a<-table.element(a,'Time lag k',header=TRUE)
a<-table.element(a,hyperlink('basics.htm','ACF(k)','click here for more information about the Autocorrelation Function'),header=TRUE)
a<-table.element(a,'T-STAT',header=TRUE)
a<-table.element(a,'P-value',header=TRUE)
a<-table.row.end(a)
for (i in 2:(par1+1)) {
a<-table.row.start(a)
a<-table.element(a,i-1,header=TRUE)
a<-table.element(a,round(myacf[i],6))
mytstat <- myacf[i]*sqrtn
a<-table.element(a,round(mytstat,4))
a<-table.element(a,round(1-pt(abs(mytstat),lengthx),6))
a<-table.row.end(a)
}
a<-table.end(a)
table.save(a,file='mytable.tab')
a<-table.start()
a<-table.row.start(a)
a<-table.element(a,'Partial Autocorrelation Function',4,TRUE)
a<-table.row.end(a)
a<-table.row.start(a)
a<-table.element(a,'Time lag k',header=TRUE)
a<-table.element(a,hyperlink('basics.htm','PACF(k)','click here for more information about the Partial Autocorrelation Function'),header=TRUE)
a<-table.element(a,'T-STAT',header=TRUE)
a<-table.element(a,'P-value',header=TRUE)
a<-table.row.end(a)
for (i in 1:par1) {
a<-table.row.start(a)
a<-table.element(a,i,header=TRUE)
a<-table.element(a,round(mypacf[i],6))
mytstat <- mypacf[i]*sqrtn
a<-table.element(a,round(mytstat,4))
a<-table.element(a,round(1-pt(abs(mytstat),lengthx),6))
a<-table.row.end(a)
}
a<-table.end(a)
table.save(a,file='mytable1.tab')