Free Statistics

of Irreproducible Research!

Author's title

Author*The author of this computation has been verified*
R Software Modulerwasp_autocorrelation.wasp
Title produced by software(Partial) Autocorrelation Function
Date of computationThu, 26 Nov 2009 08:30:55 -0700
Cite this page as followsStatistical Computations at FreeStatistics.org, Office for Research Development and Education, URL https://freestatistics.org/blog/index.php?v=date/2009/Nov/26/t1259249542zqh0xg6krfc1z1h.htm/, Retrieved Mon, 29 Apr 2024 02:36:24 +0000
Statistical Computations at FreeStatistics.org, Office for Research Development and Education, URL https://freestatistics.org/blog/index.php?pk=60097, Retrieved Mon, 29 Apr 2024 02:36:24 +0000
QR Codes:

Original text written by user:
IsPrivate?No (this computation is public)
User-defined keywords
Estimated Impact114
Family? (F = Feedback message, R = changed R code, M = changed R Module, P = changed Parameters, D = changed Data)
-       [(Partial) Autocorrelation Function] [ws8 ACF 1] [2009-11-26 15:30:55] [8b8f95c5f2993a04d1b74eff1a82c018] [Current]
Feedback Forum

Post a new message
Dataseries X:
89
88
86
89
84
86
85
86
85
83
85
84
88
84
84
86
85
88
87
88
87
89
90
94
95
95
96
97
97
97
96
100
97
98
96
94
95
93
95
96
96
98
95
96
98
94
93
94
92
92
93
95
92
94
96
97
95
94
96
93


Summary of computational transaction
Raw Inputview raw input (R code)
Raw Outputview raw output of R engine
Computing time1 seconds
R Server'Gwilym Jenkins' @ 72.249.127.135

\begin{tabular}{lllllllll}
\hline
Summary of computational transaction \tabularnewline
Raw Input & view raw input (R code)  \tabularnewline
Raw Output & view raw output of R engine  \tabularnewline
Computing time & 1 seconds \tabularnewline
R Server & 'Gwilym Jenkins' @ 72.249.127.135 \tabularnewline
\hline
\end{tabular}
%Source: https://freestatistics.org/blog/index.php?pk=60097&T=0

[TABLE]
[ROW][C]Summary of computational transaction[/C][/ROW]
[ROW][C]Raw Input[/C][C]view raw input (R code) [/C][/ROW]
[ROW][C]Raw Output[/C][C]view raw output of R engine [/C][/ROW]
[ROW][C]Computing time[/C][C]1 seconds[/C][/ROW]
[ROW][C]R Server[/C][C]'Gwilym Jenkins' @ 72.249.127.135[/C][/ROW]
[/TABLE]
Source: https://freestatistics.org/blog/index.php?pk=60097&T=0

Globally Unique Identifier (entire table): ba.freestatistics.org/blog/index.php?pk=60097&T=0

As an alternative you can also use a QR Code:  

The GUIDs for individual cells are displayed in the table below:

Summary of computational transaction
Raw Inputview raw input (R code)
Raw Outputview raw output of R engine
Computing time1 seconds
R Server'Gwilym Jenkins' @ 72.249.127.135


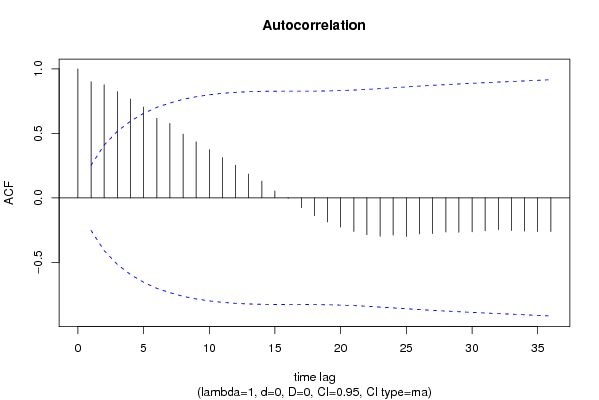
Autocorrelation Function
Time lag kACF(k)T-STATP-value
10.9014516.98260
20.8782326.80280
30.8248326.38910
40.7664425.93680
50.7046855.45850
60.6166134.77636e-06
70.5775554.47371.7e-05
80.4952193.8360.000151
90.4343353.36430.000671
100.373952.89660.002629
110.3126922.42210.009234
120.2530561.96020.027313
130.1844391.42870.079144
140.1306641.01210.157772
150.0535670.41490.339837
16-0.004074-0.03160.487464
17-0.076307-0.59110.278345
18-0.138314-1.07140.144146
19-0.1871-1.44930.076235
20-0.226781-1.75660.042041
21-0.260352-2.01670.024106
22-0.287312-2.22550.014908
23-0.298433-2.31160.012124
24-0.288601-2.23550.014559
25-0.299721-2.32160.011833
26-0.279662-2.16630.017137
27-0.277189-2.14710.017918
28-0.264987-2.05260.022241
29-0.267378-2.07110.021329
30-0.263283-2.03940.022912
31-0.255446-1.97870.026224
32-0.245863-1.90450.030825
33-0.253866-1.96640.026939
34-0.258128-1.99940.025047
35-0.262015-2.02960.023422
36-0.261911-2.02880.023464

\begin{tabular}{lllllllll}
\hline
Autocorrelation Function \tabularnewline
Time lag k & ACF(k) & T-STAT & P-value \tabularnewline
1 & 0.901451 & 6.9826 & 0 \tabularnewline
2 & 0.878232 & 6.8028 & 0 \tabularnewline
3 & 0.824832 & 6.3891 & 0 \tabularnewline
4 & 0.766442 & 5.9368 & 0 \tabularnewline
5 & 0.704685 & 5.4585 & 0 \tabularnewline
6 & 0.616613 & 4.7763 & 6e-06 \tabularnewline
7 & 0.577555 & 4.4737 & 1.7e-05 \tabularnewline
8 & 0.495219 & 3.836 & 0.000151 \tabularnewline
9 & 0.434335 & 3.3643 & 0.000671 \tabularnewline
10 & 0.37395 & 2.8966 & 0.002629 \tabularnewline
11 & 0.312692 & 2.4221 & 0.009234 \tabularnewline
12 & 0.253056 & 1.9602 & 0.027313 \tabularnewline
13 & 0.184439 & 1.4287 & 0.079144 \tabularnewline
14 & 0.130664 & 1.0121 & 0.157772 \tabularnewline
15 & 0.053567 & 0.4149 & 0.339837 \tabularnewline
16 & -0.004074 & -0.0316 & 0.487464 \tabularnewline
17 & -0.076307 & -0.5911 & 0.278345 \tabularnewline
18 & -0.138314 & -1.0714 & 0.144146 \tabularnewline
19 & -0.1871 & -1.4493 & 0.076235 \tabularnewline
20 & -0.226781 & -1.7566 & 0.042041 \tabularnewline
21 & -0.260352 & -2.0167 & 0.024106 \tabularnewline
22 & -0.287312 & -2.2255 & 0.014908 \tabularnewline
23 & -0.298433 & -2.3116 & 0.012124 \tabularnewline
24 & -0.288601 & -2.2355 & 0.014559 \tabularnewline
25 & -0.299721 & -2.3216 & 0.011833 \tabularnewline
26 & -0.279662 & -2.1663 & 0.017137 \tabularnewline
27 & -0.277189 & -2.1471 & 0.017918 \tabularnewline
28 & -0.264987 & -2.0526 & 0.022241 \tabularnewline
29 & -0.267378 & -2.0711 & 0.021329 \tabularnewline
30 & -0.263283 & -2.0394 & 0.022912 \tabularnewline
31 & -0.255446 & -1.9787 & 0.026224 \tabularnewline
32 & -0.245863 & -1.9045 & 0.030825 \tabularnewline
33 & -0.253866 & -1.9664 & 0.026939 \tabularnewline
34 & -0.258128 & -1.9994 & 0.025047 \tabularnewline
35 & -0.262015 & -2.0296 & 0.023422 \tabularnewline
36 & -0.261911 & -2.0288 & 0.023464 \tabularnewline
\hline
\end{tabular}
%Source: https://freestatistics.org/blog/index.php?pk=60097&T=1

[TABLE]
[ROW][C]Autocorrelation Function[/C][/ROW]
[ROW][C]Time lag k[/C][C]ACF(k)[/C][C]T-STAT[/C][C]P-value[/C][/ROW]
[ROW][C]1[/C][C]0.901451[/C][C]6.9826[/C][C]0[/C][/ROW]
[ROW][C]2[/C][C]0.878232[/C][C]6.8028[/C][C]0[/C][/ROW]
[ROW][C]3[/C][C]0.824832[/C][C]6.3891[/C][C]0[/C][/ROW]
[ROW][C]4[/C][C]0.766442[/C][C]5.9368[/C][C]0[/C][/ROW]
[ROW][C]5[/C][C]0.704685[/C][C]5.4585[/C][C]0[/C][/ROW]
[ROW][C]6[/C][C]0.616613[/C][C]4.7763[/C][C]6e-06[/C][/ROW]
[ROW][C]7[/C][C]0.577555[/C][C]4.4737[/C][C]1.7e-05[/C][/ROW]
[ROW][C]8[/C][C]0.495219[/C][C]3.836[/C][C]0.000151[/C][/ROW]
[ROW][C]9[/C][C]0.434335[/C][C]3.3643[/C][C]0.000671[/C][/ROW]
[ROW][C]10[/C][C]0.37395[/C][C]2.8966[/C][C]0.002629[/C][/ROW]
[ROW][C]11[/C][C]0.312692[/C][C]2.4221[/C][C]0.009234[/C][/ROW]
[ROW][C]12[/C][C]0.253056[/C][C]1.9602[/C][C]0.027313[/C][/ROW]
[ROW][C]13[/C][C]0.184439[/C][C]1.4287[/C][C]0.079144[/C][/ROW]
[ROW][C]14[/C][C]0.130664[/C][C]1.0121[/C][C]0.157772[/C][/ROW]
[ROW][C]15[/C][C]0.053567[/C][C]0.4149[/C][C]0.339837[/C][/ROW]
[ROW][C]16[/C][C]-0.004074[/C][C]-0.0316[/C][C]0.487464[/C][/ROW]
[ROW][C]17[/C][C]-0.076307[/C][C]-0.5911[/C][C]0.278345[/C][/ROW]
[ROW][C]18[/C][C]-0.138314[/C][C]-1.0714[/C][C]0.144146[/C][/ROW]
[ROW][C]19[/C][C]-0.1871[/C][C]-1.4493[/C][C]0.076235[/C][/ROW]
[ROW][C]20[/C][C]-0.226781[/C][C]-1.7566[/C][C]0.042041[/C][/ROW]
[ROW][C]21[/C][C]-0.260352[/C][C]-2.0167[/C][C]0.024106[/C][/ROW]
[ROW][C]22[/C][C]-0.287312[/C][C]-2.2255[/C][C]0.014908[/C][/ROW]
[ROW][C]23[/C][C]-0.298433[/C][C]-2.3116[/C][C]0.012124[/C][/ROW]
[ROW][C]24[/C][C]-0.288601[/C][C]-2.2355[/C][C]0.014559[/C][/ROW]
[ROW][C]25[/C][C]-0.299721[/C][C]-2.3216[/C][C]0.011833[/C][/ROW]
[ROW][C]26[/C][C]-0.279662[/C][C]-2.1663[/C][C]0.017137[/C][/ROW]
[ROW][C]27[/C][C]-0.277189[/C][C]-2.1471[/C][C]0.017918[/C][/ROW]
[ROW][C]28[/C][C]-0.264987[/C][C]-2.0526[/C][C]0.022241[/C][/ROW]
[ROW][C]29[/C][C]-0.267378[/C][C]-2.0711[/C][C]0.021329[/C][/ROW]
[ROW][C]30[/C][C]-0.263283[/C][C]-2.0394[/C][C]0.022912[/C][/ROW]
[ROW][C]31[/C][C]-0.255446[/C][C]-1.9787[/C][C]0.026224[/C][/ROW]
[ROW][C]32[/C][C]-0.245863[/C][C]-1.9045[/C][C]0.030825[/C][/ROW]
[ROW][C]33[/C][C]-0.253866[/C][C]-1.9664[/C][C]0.026939[/C][/ROW]
[ROW][C]34[/C][C]-0.258128[/C][C]-1.9994[/C][C]0.025047[/C][/ROW]
[ROW][C]35[/C][C]-0.262015[/C][C]-2.0296[/C][C]0.023422[/C][/ROW]
[ROW][C]36[/C][C]-0.261911[/C][C]-2.0288[/C][C]0.023464[/C][/ROW]
[/TABLE]
Source: https://freestatistics.org/blog/index.php?pk=60097&T=1

Globally Unique Identifier (entire table): ba.freestatistics.org/blog/index.php?pk=60097&T=1

As an alternative you can also use a QR Code:  

The GUIDs for individual cells are displayed in the table below:

Autocorrelation Function
Time lag kACF(k)T-STATP-value
10.9014516.98260
20.8782326.80280
30.8248326.38910
40.7664425.93680
50.7046855.45850
60.6166134.77636e-06
70.5775554.47371.7e-05
80.4952193.8360.000151
90.4343353.36430.000671
100.373952.89660.002629
110.3126922.42210.009234
120.2530561.96020.027313
130.1844391.42870.079144
140.1306641.01210.157772
150.0535670.41490.339837
16-0.004074-0.03160.487464
17-0.076307-0.59110.278345
18-0.138314-1.07140.144146
19-0.1871-1.44930.076235
20-0.226781-1.75660.042041
21-0.260352-2.01670.024106
22-0.287312-2.22550.014908
23-0.298433-2.31160.012124
24-0.288601-2.23550.014559
25-0.299721-2.32160.011833
26-0.279662-2.16630.017137
27-0.277189-2.14710.017918
28-0.264987-2.05260.022241
29-0.267378-2.07110.021329
30-0.263283-2.03940.022912
31-0.255446-1.97870.026224
32-0.245863-1.90450.030825
33-0.253866-1.96640.026939
34-0.258128-1.99940.025047
35-0.262015-2.02960.023422
36-0.261911-2.02880.023464


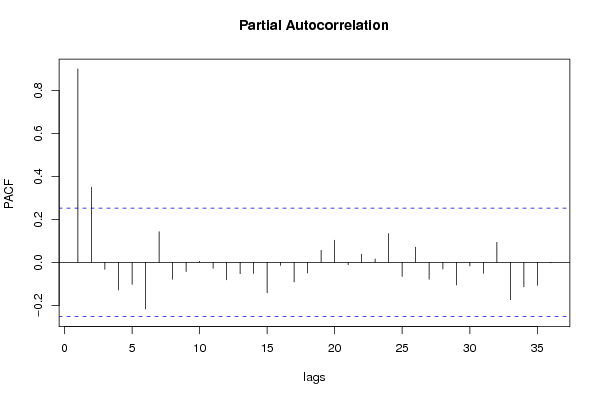
Partial Autocorrelation Function
Time lag kPACF(k)T-STATP-value
10.9014516.98260
20.3501782.71250.004351
3-0.032175-0.24920.402017
4-0.128528-0.99560.161727
5-0.102335-0.79270.215544
6-0.217042-1.68120.048962
70.142781.1060.136577
8-0.078329-0.60670.273158
9-0.042765-0.33130.370804
100.0046580.03610.485668
11-0.026887-0.20830.417862
12-0.081296-0.62970.265635
13-0.052953-0.41020.34157
14-0.051546-0.39930.345553
15-0.141868-1.09890.138099
16-0.014599-0.11310.455172
17-0.09109-0.70560.241589
18-0.049429-0.38290.351584
190.0562790.43590.332224
200.1033940.80090.213178
21-0.011321-0.08770.465208
220.0379010.29360.385047
230.0160730.12450.450669
240.1340911.03870.151564
25-0.065464-0.50710.306977
260.0705770.54670.29331
27-0.078379-0.60710.273032
28-0.030759-0.23830.406247
29-0.105026-0.81350.209565
30-0.016688-0.12930.448791
31-0.051029-0.39530.347022
320.0933310.72290.236264
33-0.174075-1.34840.091302
34-0.113863-0.8820.190653
35-0.107243-0.83070.204718
36-0.002166-0.01680.493335

\begin{tabular}{lllllllll}
\hline
Partial Autocorrelation Function \tabularnewline
Time lag k & PACF(k) & T-STAT & P-value \tabularnewline
1 & 0.901451 & 6.9826 & 0 \tabularnewline
2 & 0.350178 & 2.7125 & 0.004351 \tabularnewline
3 & -0.032175 & -0.2492 & 0.402017 \tabularnewline
4 & -0.128528 & -0.9956 & 0.161727 \tabularnewline
5 & -0.102335 & -0.7927 & 0.215544 \tabularnewline
6 & -0.217042 & -1.6812 & 0.048962 \tabularnewline
7 & 0.14278 & 1.106 & 0.136577 \tabularnewline
8 & -0.078329 & -0.6067 & 0.273158 \tabularnewline
9 & -0.042765 & -0.3313 & 0.370804 \tabularnewline
10 & 0.004658 & 0.0361 & 0.485668 \tabularnewline
11 & -0.026887 & -0.2083 & 0.417862 \tabularnewline
12 & -0.081296 & -0.6297 & 0.265635 \tabularnewline
13 & -0.052953 & -0.4102 & 0.34157 \tabularnewline
14 & -0.051546 & -0.3993 & 0.345553 \tabularnewline
15 & -0.141868 & -1.0989 & 0.138099 \tabularnewline
16 & -0.014599 & -0.1131 & 0.455172 \tabularnewline
17 & -0.09109 & -0.7056 & 0.241589 \tabularnewline
18 & -0.049429 & -0.3829 & 0.351584 \tabularnewline
19 & 0.056279 & 0.4359 & 0.332224 \tabularnewline
20 & 0.103394 & 0.8009 & 0.213178 \tabularnewline
21 & -0.011321 & -0.0877 & 0.465208 \tabularnewline
22 & 0.037901 & 0.2936 & 0.385047 \tabularnewline
23 & 0.016073 & 0.1245 & 0.450669 \tabularnewline
24 & 0.134091 & 1.0387 & 0.151564 \tabularnewline
25 & -0.065464 & -0.5071 & 0.306977 \tabularnewline
26 & 0.070577 & 0.5467 & 0.29331 \tabularnewline
27 & -0.078379 & -0.6071 & 0.273032 \tabularnewline
28 & -0.030759 & -0.2383 & 0.406247 \tabularnewline
29 & -0.105026 & -0.8135 & 0.209565 \tabularnewline
30 & -0.016688 & -0.1293 & 0.448791 \tabularnewline
31 & -0.051029 & -0.3953 & 0.347022 \tabularnewline
32 & 0.093331 & 0.7229 & 0.236264 \tabularnewline
33 & -0.174075 & -1.3484 & 0.091302 \tabularnewline
34 & -0.113863 & -0.882 & 0.190653 \tabularnewline
35 & -0.107243 & -0.8307 & 0.204718 \tabularnewline
36 & -0.002166 & -0.0168 & 0.493335 \tabularnewline
\hline
\end{tabular}
%Source: https://freestatistics.org/blog/index.php?pk=60097&T=2

[TABLE]
[ROW][C]Partial Autocorrelation Function[/C][/ROW]
[ROW][C]Time lag k[/C][C]PACF(k)[/C][C]T-STAT[/C][C]P-value[/C][/ROW]
[ROW][C]1[/C][C]0.901451[/C][C]6.9826[/C][C]0[/C][/ROW]
[ROW][C]2[/C][C]0.350178[/C][C]2.7125[/C][C]0.004351[/C][/ROW]
[ROW][C]3[/C][C]-0.032175[/C][C]-0.2492[/C][C]0.402017[/C][/ROW]
[ROW][C]4[/C][C]-0.128528[/C][C]-0.9956[/C][C]0.161727[/C][/ROW]
[ROW][C]5[/C][C]-0.102335[/C][C]-0.7927[/C][C]0.215544[/C][/ROW]
[ROW][C]6[/C][C]-0.217042[/C][C]-1.6812[/C][C]0.048962[/C][/ROW]
[ROW][C]7[/C][C]0.14278[/C][C]1.106[/C][C]0.136577[/C][/ROW]
[ROW][C]8[/C][C]-0.078329[/C][C]-0.6067[/C][C]0.273158[/C][/ROW]
[ROW][C]9[/C][C]-0.042765[/C][C]-0.3313[/C][C]0.370804[/C][/ROW]
[ROW][C]10[/C][C]0.004658[/C][C]0.0361[/C][C]0.485668[/C][/ROW]
[ROW][C]11[/C][C]-0.026887[/C][C]-0.2083[/C][C]0.417862[/C][/ROW]
[ROW][C]12[/C][C]-0.081296[/C][C]-0.6297[/C][C]0.265635[/C][/ROW]
[ROW][C]13[/C][C]-0.052953[/C][C]-0.4102[/C][C]0.34157[/C][/ROW]
[ROW][C]14[/C][C]-0.051546[/C][C]-0.3993[/C][C]0.345553[/C][/ROW]
[ROW][C]15[/C][C]-0.141868[/C][C]-1.0989[/C][C]0.138099[/C][/ROW]
[ROW][C]16[/C][C]-0.014599[/C][C]-0.1131[/C][C]0.455172[/C][/ROW]
[ROW][C]17[/C][C]-0.09109[/C][C]-0.7056[/C][C]0.241589[/C][/ROW]
[ROW][C]18[/C][C]-0.049429[/C][C]-0.3829[/C][C]0.351584[/C][/ROW]
[ROW][C]19[/C][C]0.056279[/C][C]0.4359[/C][C]0.332224[/C][/ROW]
[ROW][C]20[/C][C]0.103394[/C][C]0.8009[/C][C]0.213178[/C][/ROW]
[ROW][C]21[/C][C]-0.011321[/C][C]-0.0877[/C][C]0.465208[/C][/ROW]
[ROW][C]22[/C][C]0.037901[/C][C]0.2936[/C][C]0.385047[/C][/ROW]
[ROW][C]23[/C][C]0.016073[/C][C]0.1245[/C][C]0.450669[/C][/ROW]
[ROW][C]24[/C][C]0.134091[/C][C]1.0387[/C][C]0.151564[/C][/ROW]
[ROW][C]25[/C][C]-0.065464[/C][C]-0.5071[/C][C]0.306977[/C][/ROW]
[ROW][C]26[/C][C]0.070577[/C][C]0.5467[/C][C]0.29331[/C][/ROW]
[ROW][C]27[/C][C]-0.078379[/C][C]-0.6071[/C][C]0.273032[/C][/ROW]
[ROW][C]28[/C][C]-0.030759[/C][C]-0.2383[/C][C]0.406247[/C][/ROW]
[ROW][C]29[/C][C]-0.105026[/C][C]-0.8135[/C][C]0.209565[/C][/ROW]
[ROW][C]30[/C][C]-0.016688[/C][C]-0.1293[/C][C]0.448791[/C][/ROW]
[ROW][C]31[/C][C]-0.051029[/C][C]-0.3953[/C][C]0.347022[/C][/ROW]
[ROW][C]32[/C][C]0.093331[/C][C]0.7229[/C][C]0.236264[/C][/ROW]
[ROW][C]33[/C][C]-0.174075[/C][C]-1.3484[/C][C]0.091302[/C][/ROW]
[ROW][C]34[/C][C]-0.113863[/C][C]-0.882[/C][C]0.190653[/C][/ROW]
[ROW][C]35[/C][C]-0.107243[/C][C]-0.8307[/C][C]0.204718[/C][/ROW]
[ROW][C]36[/C][C]-0.002166[/C][C]-0.0168[/C][C]0.493335[/C][/ROW]
[/TABLE]
Source: https://freestatistics.org/blog/index.php?pk=60097&T=2

Globally Unique Identifier (entire table): ba.freestatistics.org/blog/index.php?pk=60097&T=2

As an alternative you can also use a QR Code:  

The GUIDs for individual cells are displayed in the table below:

Partial Autocorrelation Function
Time lag kPACF(k)T-STATP-value
10.9014516.98260
20.3501782.71250.004351
3-0.032175-0.24920.402017
4-0.128528-0.99560.161727
5-0.102335-0.79270.215544
6-0.217042-1.68120.048962
70.142781.1060.136577
8-0.078329-0.60670.273158
9-0.042765-0.33130.370804
100.0046580.03610.485668
11-0.026887-0.20830.417862
12-0.081296-0.62970.265635
13-0.052953-0.41020.34157
14-0.051546-0.39930.345553
15-0.141868-1.09890.138099
16-0.014599-0.11310.455172
17-0.09109-0.70560.241589
18-0.049429-0.38290.351584
190.0562790.43590.332224
200.1033940.80090.213178
21-0.011321-0.08770.465208
220.0379010.29360.385047
230.0160730.12450.450669
240.1340911.03870.151564
25-0.065464-0.50710.306977
260.0705770.54670.29331
27-0.078379-0.60710.273032
28-0.030759-0.23830.406247
29-0.105026-0.81350.209565
30-0.016688-0.12930.448791
31-0.051029-0.39530.347022
320.0933310.72290.236264
33-0.174075-1.34840.091302
34-0.113863-0.8820.190653
35-0.107243-0.83070.204718
36-0.002166-0.01680.493335


Parameters (Session):
par1 = 36 ; par2 = 1 ; par3 = 0 ; par4 = 0 ; par5 = 12 ; par6 = MA ; par7 = 0.95 ;
Parameters (R input):
par1 = 36 ; par2 = 1 ; par3 = 0 ; par4 = 0 ; par5 = 12 ; par6 = MA ; par7 = 0.95 ;
R code (references can be found in the software module):
if (par1 == 'Default') {
par1 = 10*log10(length(x))
} else {
par1 <- as.numeric(par1)
}
par2 <- as.numeric(par2)
par3 <- as.numeric(par3)
par4 <- as.numeric(par4)
par5 <- as.numeric(par5)
if (par6 == 'White Noise') par6 <- 'white' else par6 <- 'ma'
par7 <- as.numeric(par7)
if (par2 == 0) {
x <- log(x)
} else {
x <- (x ^ par2 - 1) / par2
}
if (par3 > 0) x <- diff(x,lag=1,difference=par3)
if (par4 > 0) x <- diff(x,lag=par5,difference=par4)
bitmap(file='pic1.png')
racf <- acf(x, par1, main='Autocorrelation', xlab='time lag', ylab='ACF', ci.type=par6, ci=par7, sub=paste('(lambda=',par2,', d=',par3,', D=',par4,', CI=', par7, ', CI type=',par6,')',sep=''))
dev.off()
bitmap(file='pic2.png')
rpacf <- pacf(x,par1,main='Partial Autocorrelation',xlab='lags',ylab='PACF')
dev.off()
(myacf <- c(racf$acf))
(mypacf <- c(rpacf$acf))
lengthx <- length(x)
sqrtn <- sqrt(lengthx)
load(file='createtable')
a<-table.start()
a<-table.row.start(a)
a<-table.element(a,'Autocorrelation Function',4,TRUE)
a<-table.row.end(a)
a<-table.row.start(a)
a<-table.element(a,'Time lag k',header=TRUE)
a<-table.element(a,hyperlink('basics.htm','ACF(k)','click here for more information about the Autocorrelation Function'),header=TRUE)
a<-table.element(a,'T-STAT',header=TRUE)
a<-table.element(a,'P-value',header=TRUE)
a<-table.row.end(a)
for (i in 2:(par1+1)) {
a<-table.row.start(a)
a<-table.element(a,i-1,header=TRUE)
a<-table.element(a,round(myacf[i],6))
mytstat <- myacf[i]*sqrtn
a<-table.element(a,round(mytstat,4))
a<-table.element(a,round(1-pt(abs(mytstat),lengthx),6))
a<-table.row.end(a)
}
a<-table.end(a)
table.save(a,file='mytable.tab')
a<-table.start()
a<-table.row.start(a)
a<-table.element(a,'Partial Autocorrelation Function',4,TRUE)
a<-table.row.end(a)
a<-table.row.start(a)
a<-table.element(a,'Time lag k',header=TRUE)
a<-table.element(a,hyperlink('basics.htm','PACF(k)','click here for more information about the Partial Autocorrelation Function'),header=TRUE)
a<-table.element(a,'T-STAT',header=TRUE)
a<-table.element(a,'P-value',header=TRUE)
a<-table.row.end(a)
for (i in 1:par1) {
a<-table.row.start(a)
a<-table.element(a,i,header=TRUE)
a<-table.element(a,round(mypacf[i],6))
mytstat <- mypacf[i]*sqrtn
a<-table.element(a,round(mytstat,4))
a<-table.element(a,round(1-pt(abs(mytstat),lengthx),6))
a<-table.row.end(a)
}
a<-table.end(a)
table.save(a,file='mytable1.tab')