Free Statistics

of Irreproducible Research!

Author's title

Author*The author of this computation has been verified*
R Software Modulerwasp_autocorrelation.wasp
Title produced by software(Partial) Autocorrelation Function
Date of computationThu, 26 Nov 2009 08:33:12 -0700
Cite this page as followsStatistical Computations at FreeStatistics.org, Office for Research Development and Education, URL https://freestatistics.org/blog/index.php?v=date/2009/Nov/26/t12592496420st9cm5mqak5v35.htm/, Retrieved Mon, 29 Apr 2024 02:41:43 +0000
Statistical Computations at FreeStatistics.org, Office for Research Development and Education, URL https://freestatistics.org/blog/index.php?pk=60099, Retrieved Mon, 29 Apr 2024 02:41:43 +0000
QR Codes:

Original text written by user:
IsPrivate?No (this computation is public)
User-defined keywords
Estimated Impact122
Family? (F = Feedback message, R = changed R code, M = changed R Module, P = changed Parameters, D = changed Data)
-       [(Partial) Autocorrelation Function] [ws 8 ACF 2] [2009-11-26 15:33:12] [8b8f95c5f2993a04d1b74eff1a82c018] [Current]
Feedback Forum

Post a new message
Dataseries X:
89
88
86
89
84
86
85
86
85
83
85
84
88
84
84
86
85
88
87
88
87
89
90
94
95
95
96
97
97
97
96
100
97
98
96
94
95
93
95
96
96
98
95
96
98
94
93
94
92
92
93
95
92
94
96
97
95
94
96
93


Summary of computational transaction
Raw Inputview raw input (R code)
Raw Outputview raw output of R engine
Computing time1 seconds
R Server'Gwilym Jenkins' @ 72.249.127.135

\begin{tabular}{lllllllll}
\hline
Summary of computational transaction \tabularnewline
Raw Input & view raw input (R code)  \tabularnewline
Raw Output & view raw output of R engine  \tabularnewline
Computing time & 1 seconds \tabularnewline
R Server & 'Gwilym Jenkins' @ 72.249.127.135 \tabularnewline
\hline
\end{tabular}
%Source: https://freestatistics.org/blog/index.php?pk=60099&T=0

[TABLE]
[ROW][C]Summary of computational transaction[/C][/ROW]
[ROW][C]Raw Input[/C][C]view raw input (R code) [/C][/ROW]
[ROW][C]Raw Output[/C][C]view raw output of R engine [/C][/ROW]
[ROW][C]Computing time[/C][C]1 seconds[/C][/ROW]
[ROW][C]R Server[/C][C]'Gwilym Jenkins' @ 72.249.127.135[/C][/ROW]
[/TABLE]
Source: https://freestatistics.org/blog/index.php?pk=60099&T=0

Globally Unique Identifier (entire table): ba.freestatistics.org/blog/index.php?pk=60099&T=0

As an alternative you can also use a QR Code:  

The GUIDs for individual cells are displayed in the table below:

Summary of computational transaction
Raw Inputview raw input (R code)
Raw Outputview raw output of R engine
Computing time1 seconds
R Server'Gwilym Jenkins' @ 72.249.127.135


Autocorrelation Function
Time lag kACF(k)T-STATP-value
10.8494645.88530
20.7879715.45921e-06
30.7215294.99894e-06
40.5879344.07338.6e-05
50.5102663.53520.000457
60.402442.78820.003787
70.3066062.12420.019415
80.1797471.24530.109529
90.0407940.28260.389339
10-0.047386-0.32830.372056
11-0.147813-1.02410.155466
12-0.274213-1.89980.031738
13-0.281411-1.94970.028535
14-0.325299-2.25370.014408
15-0.356939-2.47290.008497
16-0.343471-2.37960.010676
17-0.375928-2.60450.006106
18-0.393689-2.72760.004443
19-0.39012-2.70280.004739
20-0.371804-2.57590.006565
21-0.310319-2.14990.018313
22-0.283991-1.96750.027456
23-0.246438-1.70740.047107
24-0.226234-1.56740.061796
25-0.235422-1.63110.054712
26-0.201134-1.39350.084944
27-0.179705-1.2450.109581
28-0.146795-1.0170.157119
29-0.117866-0.81660.209097
30-0.070208-0.48640.314442
31-0.052862-0.36620.357898
32-0.015921-0.11030.456315
330.0065280.04520.482056
340.0091790.06360.47478
350.0330570.2290.409912
360.0356560.2470.402969

\begin{tabular}{lllllllll}
\hline
Autocorrelation Function \tabularnewline
Time lag k & ACF(k) & T-STAT & P-value \tabularnewline
1 & 0.849464 & 5.8853 & 0 \tabularnewline
2 & 0.787971 & 5.4592 & 1e-06 \tabularnewline
3 & 0.721529 & 4.9989 & 4e-06 \tabularnewline
4 & 0.587934 & 4.0733 & 8.6e-05 \tabularnewline
5 & 0.510266 & 3.5352 & 0.000457 \tabularnewline
6 & 0.40244 & 2.7882 & 0.003787 \tabularnewline
7 & 0.306606 & 2.1242 & 0.019415 \tabularnewline
8 & 0.179747 & 1.2453 & 0.109529 \tabularnewline
9 & 0.040794 & 0.2826 & 0.389339 \tabularnewline
10 & -0.047386 & -0.3283 & 0.372056 \tabularnewline
11 & -0.147813 & -1.0241 & 0.155466 \tabularnewline
12 & -0.274213 & -1.8998 & 0.031738 \tabularnewline
13 & -0.281411 & -1.9497 & 0.028535 \tabularnewline
14 & -0.325299 & -2.2537 & 0.014408 \tabularnewline
15 & -0.356939 & -2.4729 & 0.008497 \tabularnewline
16 & -0.343471 & -2.3796 & 0.010676 \tabularnewline
17 & -0.375928 & -2.6045 & 0.006106 \tabularnewline
18 & -0.393689 & -2.7276 & 0.004443 \tabularnewline
19 & -0.39012 & -2.7028 & 0.004739 \tabularnewline
20 & -0.371804 & -2.5759 & 0.006565 \tabularnewline
21 & -0.310319 & -2.1499 & 0.018313 \tabularnewline
22 & -0.283991 & -1.9675 & 0.027456 \tabularnewline
23 & -0.246438 & -1.7074 & 0.047107 \tabularnewline
24 & -0.226234 & -1.5674 & 0.061796 \tabularnewline
25 & -0.235422 & -1.6311 & 0.054712 \tabularnewline
26 & -0.201134 & -1.3935 & 0.084944 \tabularnewline
27 & -0.179705 & -1.245 & 0.109581 \tabularnewline
28 & -0.146795 & -1.017 & 0.157119 \tabularnewline
29 & -0.117866 & -0.8166 & 0.209097 \tabularnewline
30 & -0.070208 & -0.4864 & 0.314442 \tabularnewline
31 & -0.052862 & -0.3662 & 0.357898 \tabularnewline
32 & -0.015921 & -0.1103 & 0.456315 \tabularnewline
33 & 0.006528 & 0.0452 & 0.482056 \tabularnewline
34 & 0.009179 & 0.0636 & 0.47478 \tabularnewline
35 & 0.033057 & 0.229 & 0.409912 \tabularnewline
36 & 0.035656 & 0.247 & 0.402969 \tabularnewline
\hline
\end{tabular}
%Source: https://freestatistics.org/blog/index.php?pk=60099&T=1

[TABLE]
[ROW][C]Autocorrelation Function[/C][/ROW]
[ROW][C]Time lag k[/C][C]ACF(k)[/C][C]T-STAT[/C][C]P-value[/C][/ROW]
[ROW][C]1[/C][C]0.849464[/C][C]5.8853[/C][C]0[/C][/ROW]
[ROW][C]2[/C][C]0.787971[/C][C]5.4592[/C][C]1e-06[/C][/ROW]
[ROW][C]3[/C][C]0.721529[/C][C]4.9989[/C][C]4e-06[/C][/ROW]
[ROW][C]4[/C][C]0.587934[/C][C]4.0733[/C][C]8.6e-05[/C][/ROW]
[ROW][C]5[/C][C]0.510266[/C][C]3.5352[/C][C]0.000457[/C][/ROW]
[ROW][C]6[/C][C]0.40244[/C][C]2.7882[/C][C]0.003787[/C][/ROW]
[ROW][C]7[/C][C]0.306606[/C][C]2.1242[/C][C]0.019415[/C][/ROW]
[ROW][C]8[/C][C]0.179747[/C][C]1.2453[/C][C]0.109529[/C][/ROW]
[ROW][C]9[/C][C]0.040794[/C][C]0.2826[/C][C]0.389339[/C][/ROW]
[ROW][C]10[/C][C]-0.047386[/C][C]-0.3283[/C][C]0.372056[/C][/ROW]
[ROW][C]11[/C][C]-0.147813[/C][C]-1.0241[/C][C]0.155466[/C][/ROW]
[ROW][C]12[/C][C]-0.274213[/C][C]-1.8998[/C][C]0.031738[/C][/ROW]
[ROW][C]13[/C][C]-0.281411[/C][C]-1.9497[/C][C]0.028535[/C][/ROW]
[ROW][C]14[/C][C]-0.325299[/C][C]-2.2537[/C][C]0.014408[/C][/ROW]
[ROW][C]15[/C][C]-0.356939[/C][C]-2.4729[/C][C]0.008497[/C][/ROW]
[ROW][C]16[/C][C]-0.343471[/C][C]-2.3796[/C][C]0.010676[/C][/ROW]
[ROW][C]17[/C][C]-0.375928[/C][C]-2.6045[/C][C]0.006106[/C][/ROW]
[ROW][C]18[/C][C]-0.393689[/C][C]-2.7276[/C][C]0.004443[/C][/ROW]
[ROW][C]19[/C][C]-0.39012[/C][C]-2.7028[/C][C]0.004739[/C][/ROW]
[ROW][C]20[/C][C]-0.371804[/C][C]-2.5759[/C][C]0.006565[/C][/ROW]
[ROW][C]21[/C][C]-0.310319[/C][C]-2.1499[/C][C]0.018313[/C][/ROW]
[ROW][C]22[/C][C]-0.283991[/C][C]-1.9675[/C][C]0.027456[/C][/ROW]
[ROW][C]23[/C][C]-0.246438[/C][C]-1.7074[/C][C]0.047107[/C][/ROW]
[ROW][C]24[/C][C]-0.226234[/C][C]-1.5674[/C][C]0.061796[/C][/ROW]
[ROW][C]25[/C][C]-0.235422[/C][C]-1.6311[/C][C]0.054712[/C][/ROW]
[ROW][C]26[/C][C]-0.201134[/C][C]-1.3935[/C][C]0.084944[/C][/ROW]
[ROW][C]27[/C][C]-0.179705[/C][C]-1.245[/C][C]0.109581[/C][/ROW]
[ROW][C]28[/C][C]-0.146795[/C][C]-1.017[/C][C]0.157119[/C][/ROW]
[ROW][C]29[/C][C]-0.117866[/C][C]-0.8166[/C][C]0.209097[/C][/ROW]
[ROW][C]30[/C][C]-0.070208[/C][C]-0.4864[/C][C]0.314442[/C][/ROW]
[ROW][C]31[/C][C]-0.052862[/C][C]-0.3662[/C][C]0.357898[/C][/ROW]
[ROW][C]32[/C][C]-0.015921[/C][C]-0.1103[/C][C]0.456315[/C][/ROW]
[ROW][C]33[/C][C]0.006528[/C][C]0.0452[/C][C]0.482056[/C][/ROW]
[ROW][C]34[/C][C]0.009179[/C][C]0.0636[/C][C]0.47478[/C][/ROW]
[ROW][C]35[/C][C]0.033057[/C][C]0.229[/C][C]0.409912[/C][/ROW]
[ROW][C]36[/C][C]0.035656[/C][C]0.247[/C][C]0.402969[/C][/ROW]
[/TABLE]
Source: https://freestatistics.org/blog/index.php?pk=60099&T=1

Globally Unique Identifier (entire table): ba.freestatistics.org/blog/index.php?pk=60099&T=1

As an alternative you can also use a QR Code:  

The GUIDs for individual cells are displayed in the table below:

Autocorrelation Function
Time lag kACF(k)T-STATP-value
10.8494645.88530
20.7879715.45921e-06
30.7215294.99894e-06
40.5879344.07338.6e-05
50.5102663.53520.000457
60.402442.78820.003787
70.3066062.12420.019415
80.1797471.24530.109529
90.0407940.28260.389339
10-0.047386-0.32830.372056
11-0.147813-1.02410.155466
12-0.274213-1.89980.031738
13-0.281411-1.94970.028535
14-0.325299-2.25370.014408
15-0.356939-2.47290.008497
16-0.343471-2.37960.010676
17-0.375928-2.60450.006106
18-0.393689-2.72760.004443
19-0.39012-2.70280.004739
20-0.371804-2.57590.006565
21-0.310319-2.14990.018313
22-0.283991-1.96750.027456
23-0.246438-1.70740.047107
24-0.226234-1.56740.061796
25-0.235422-1.63110.054712
26-0.201134-1.39350.084944
27-0.179705-1.2450.109581
28-0.146795-1.0170.157119
29-0.117866-0.81660.209097
30-0.070208-0.48640.314442
31-0.052862-0.36620.357898
32-0.015921-0.11030.456315
330.0065280.04520.482056
340.0091790.06360.47478
350.0330570.2290.409912
360.0356560.2470.402969


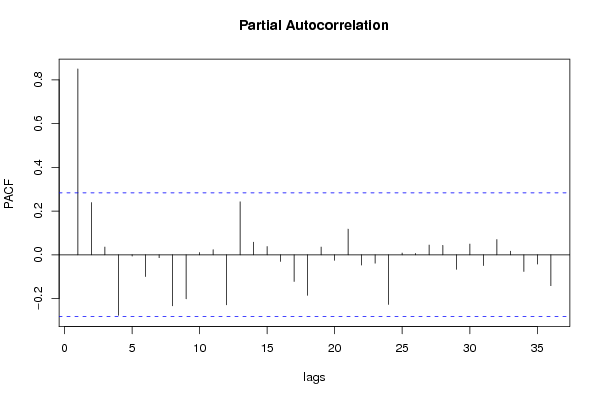
Partial Autocorrelation Function
Time lag kPACF(k)T-STATP-value
10.8494645.88530
20.2384351.65190.052539
30.0351580.24360.404297
4-0.276877-1.91830.030518
5-0.005822-0.04030.483997
6-0.099623-0.69020.246693
7-0.013063-0.09050.464131
8-0.233441-1.61730.056181
9-0.201558-1.39640.084504
100.0103560.07170.471551
110.023260.16120.436325
12-0.228511-1.58320.059975
130.2422061.67810.049918
140.057740.40.345452
150.0373160.25850.39855
16-0.030761-0.21310.416067
17-0.121716-0.84330.201629
18-0.185392-1.28440.102577
190.0353120.24460.403886
20-0.025416-0.17610.430483
210.1172650.81240.210277
22-0.047191-0.32690.372565
23-0.038479-0.26660.395464
24-0.227214-1.57420.061007
250.007990.05540.478042
260.0062580.04340.482798
270.0446230.30920.37927
280.0429640.29770.383623
29-0.066575-0.46120.323354
300.0490220.33960.367806
31-0.049509-0.3430.366545
320.0696350.48240.315842
330.0164470.11390.454876
34-0.076283-0.52850.299791
35-0.042707-0.29590.384297
36-0.141127-0.97780.166548

\begin{tabular}{lllllllll}
\hline
Partial Autocorrelation Function \tabularnewline
Time lag k & PACF(k) & T-STAT & P-value \tabularnewline
1 & 0.849464 & 5.8853 & 0 \tabularnewline
2 & 0.238435 & 1.6519 & 0.052539 \tabularnewline
3 & 0.035158 & 0.2436 & 0.404297 \tabularnewline
4 & -0.276877 & -1.9183 & 0.030518 \tabularnewline
5 & -0.005822 & -0.0403 & 0.483997 \tabularnewline
6 & -0.099623 & -0.6902 & 0.246693 \tabularnewline
7 & -0.013063 & -0.0905 & 0.464131 \tabularnewline
8 & -0.233441 & -1.6173 & 0.056181 \tabularnewline
9 & -0.201558 & -1.3964 & 0.084504 \tabularnewline
10 & 0.010356 & 0.0717 & 0.471551 \tabularnewline
11 & 0.02326 & 0.1612 & 0.436325 \tabularnewline
12 & -0.228511 & -1.5832 & 0.059975 \tabularnewline
13 & 0.242206 & 1.6781 & 0.049918 \tabularnewline
14 & 0.05774 & 0.4 & 0.345452 \tabularnewline
15 & 0.037316 & 0.2585 & 0.39855 \tabularnewline
16 & -0.030761 & -0.2131 & 0.416067 \tabularnewline
17 & -0.121716 & -0.8433 & 0.201629 \tabularnewline
18 & -0.185392 & -1.2844 & 0.102577 \tabularnewline
19 & 0.035312 & 0.2446 & 0.403886 \tabularnewline
20 & -0.025416 & -0.1761 & 0.430483 \tabularnewline
21 & 0.117265 & 0.8124 & 0.210277 \tabularnewline
22 & -0.047191 & -0.3269 & 0.372565 \tabularnewline
23 & -0.038479 & -0.2666 & 0.395464 \tabularnewline
24 & -0.227214 & -1.5742 & 0.061007 \tabularnewline
25 & 0.00799 & 0.0554 & 0.478042 \tabularnewline
26 & 0.006258 & 0.0434 & 0.482798 \tabularnewline
27 & 0.044623 & 0.3092 & 0.37927 \tabularnewline
28 & 0.042964 & 0.2977 & 0.383623 \tabularnewline
29 & -0.066575 & -0.4612 & 0.323354 \tabularnewline
30 & 0.049022 & 0.3396 & 0.367806 \tabularnewline
31 & -0.049509 & -0.343 & 0.366545 \tabularnewline
32 & 0.069635 & 0.4824 & 0.315842 \tabularnewline
33 & 0.016447 & 0.1139 & 0.454876 \tabularnewline
34 & -0.076283 & -0.5285 & 0.299791 \tabularnewline
35 & -0.042707 & -0.2959 & 0.384297 \tabularnewline
36 & -0.141127 & -0.9778 & 0.166548 \tabularnewline
\hline
\end{tabular}
%Source: https://freestatistics.org/blog/index.php?pk=60099&T=2

[TABLE]
[ROW][C]Partial Autocorrelation Function[/C][/ROW]
[ROW][C]Time lag k[/C][C]PACF(k)[/C][C]T-STAT[/C][C]P-value[/C][/ROW]
[ROW][C]1[/C][C]0.849464[/C][C]5.8853[/C][C]0[/C][/ROW]
[ROW][C]2[/C][C]0.238435[/C][C]1.6519[/C][C]0.052539[/C][/ROW]
[ROW][C]3[/C][C]0.035158[/C][C]0.2436[/C][C]0.404297[/C][/ROW]
[ROW][C]4[/C][C]-0.276877[/C][C]-1.9183[/C][C]0.030518[/C][/ROW]
[ROW][C]5[/C][C]-0.005822[/C][C]-0.0403[/C][C]0.483997[/C][/ROW]
[ROW][C]6[/C][C]-0.099623[/C][C]-0.6902[/C][C]0.246693[/C][/ROW]
[ROW][C]7[/C][C]-0.013063[/C][C]-0.0905[/C][C]0.464131[/C][/ROW]
[ROW][C]8[/C][C]-0.233441[/C][C]-1.6173[/C][C]0.056181[/C][/ROW]
[ROW][C]9[/C][C]-0.201558[/C][C]-1.3964[/C][C]0.084504[/C][/ROW]
[ROW][C]10[/C][C]0.010356[/C][C]0.0717[/C][C]0.471551[/C][/ROW]
[ROW][C]11[/C][C]0.02326[/C][C]0.1612[/C][C]0.436325[/C][/ROW]
[ROW][C]12[/C][C]-0.228511[/C][C]-1.5832[/C][C]0.059975[/C][/ROW]
[ROW][C]13[/C][C]0.242206[/C][C]1.6781[/C][C]0.049918[/C][/ROW]
[ROW][C]14[/C][C]0.05774[/C][C]0.4[/C][C]0.345452[/C][/ROW]
[ROW][C]15[/C][C]0.037316[/C][C]0.2585[/C][C]0.39855[/C][/ROW]
[ROW][C]16[/C][C]-0.030761[/C][C]-0.2131[/C][C]0.416067[/C][/ROW]
[ROW][C]17[/C][C]-0.121716[/C][C]-0.8433[/C][C]0.201629[/C][/ROW]
[ROW][C]18[/C][C]-0.185392[/C][C]-1.2844[/C][C]0.102577[/C][/ROW]
[ROW][C]19[/C][C]0.035312[/C][C]0.2446[/C][C]0.403886[/C][/ROW]
[ROW][C]20[/C][C]-0.025416[/C][C]-0.1761[/C][C]0.430483[/C][/ROW]
[ROW][C]21[/C][C]0.117265[/C][C]0.8124[/C][C]0.210277[/C][/ROW]
[ROW][C]22[/C][C]-0.047191[/C][C]-0.3269[/C][C]0.372565[/C][/ROW]
[ROW][C]23[/C][C]-0.038479[/C][C]-0.2666[/C][C]0.395464[/C][/ROW]
[ROW][C]24[/C][C]-0.227214[/C][C]-1.5742[/C][C]0.061007[/C][/ROW]
[ROW][C]25[/C][C]0.00799[/C][C]0.0554[/C][C]0.478042[/C][/ROW]
[ROW][C]26[/C][C]0.006258[/C][C]0.0434[/C][C]0.482798[/C][/ROW]
[ROW][C]27[/C][C]0.044623[/C][C]0.3092[/C][C]0.37927[/C][/ROW]
[ROW][C]28[/C][C]0.042964[/C][C]0.2977[/C][C]0.383623[/C][/ROW]
[ROW][C]29[/C][C]-0.066575[/C][C]-0.4612[/C][C]0.323354[/C][/ROW]
[ROW][C]30[/C][C]0.049022[/C][C]0.3396[/C][C]0.367806[/C][/ROW]
[ROW][C]31[/C][C]-0.049509[/C][C]-0.343[/C][C]0.366545[/C][/ROW]
[ROW][C]32[/C][C]0.069635[/C][C]0.4824[/C][C]0.315842[/C][/ROW]
[ROW][C]33[/C][C]0.016447[/C][C]0.1139[/C][C]0.454876[/C][/ROW]
[ROW][C]34[/C][C]-0.076283[/C][C]-0.5285[/C][C]0.299791[/C][/ROW]
[ROW][C]35[/C][C]-0.042707[/C][C]-0.2959[/C][C]0.384297[/C][/ROW]
[ROW][C]36[/C][C]-0.141127[/C][C]-0.9778[/C][C]0.166548[/C][/ROW]
[/TABLE]
Source: https://freestatistics.org/blog/index.php?pk=60099&T=2

Globally Unique Identifier (entire table): ba.freestatistics.org/blog/index.php?pk=60099&T=2

As an alternative you can also use a QR Code:  

The GUIDs for individual cells are displayed in the table below:

Partial Autocorrelation Function
Time lag kPACF(k)T-STATP-value
10.8494645.88530
20.2384351.65190.052539
30.0351580.24360.404297
4-0.276877-1.91830.030518
5-0.005822-0.04030.483997
6-0.099623-0.69020.246693
7-0.013063-0.09050.464131
8-0.233441-1.61730.056181
9-0.201558-1.39640.084504
100.0103560.07170.471551
110.023260.16120.436325
12-0.228511-1.58320.059975
130.2422061.67810.049918
140.057740.40.345452
150.0373160.25850.39855
16-0.030761-0.21310.416067
17-0.121716-0.84330.201629
18-0.185392-1.28440.102577
190.0353120.24460.403886
20-0.025416-0.17610.430483
210.1172650.81240.210277
22-0.047191-0.32690.372565
23-0.038479-0.26660.395464
24-0.227214-1.57420.061007
250.007990.05540.478042
260.0062580.04340.482798
270.0446230.30920.37927
280.0429640.29770.383623
29-0.066575-0.46120.323354
300.0490220.33960.367806
31-0.049509-0.3430.366545
320.0696350.48240.315842
330.0164470.11390.454876
34-0.076283-0.52850.299791
35-0.042707-0.29590.384297
36-0.141127-0.97780.166548


Parameters (Session):
par1 = 36 ; par2 = 1 ; par3 = 0 ; par4 = 1 ; par5 = 12 ; par6 = MA ; par7 = 0.95 ;
Parameters (R input):
par1 = 36 ; par2 = 1 ; par3 = 0 ; par4 = 1 ; par5 = 12 ; par6 = MA ; par7 = 0.95 ;
R code (references can be found in the software module):
if (par1 == 'Default') {
par1 = 10*log10(length(x))
} else {
par1 <- as.numeric(par1)
}
par2 <- as.numeric(par2)
par3 <- as.numeric(par3)
par4 <- as.numeric(par4)
par5 <- as.numeric(par5)
if (par6 == 'White Noise') par6 <- 'white' else par6 <- 'ma'
par7 <- as.numeric(par7)
if (par2 == 0) {
x <- log(x)
} else {
x <- (x ^ par2 - 1) / par2
}
if (par3 > 0) x <- diff(x,lag=1,difference=par3)
if (par4 > 0) x <- diff(x,lag=par5,difference=par4)
bitmap(file='pic1.png')
racf <- acf(x, par1, main='Autocorrelation', xlab='time lag', ylab='ACF', ci.type=par6, ci=par7, sub=paste('(lambda=',par2,', d=',par3,', D=',par4,', CI=', par7, ', CI type=',par6,')',sep=''))
dev.off()
bitmap(file='pic2.png')
rpacf <- pacf(x,par1,main='Partial Autocorrelation',xlab='lags',ylab='PACF')
dev.off()
(myacf <- c(racf$acf))
(mypacf <- c(rpacf$acf))
lengthx <- length(x)
sqrtn <- sqrt(lengthx)
load(file='createtable')
a<-table.start()
a<-table.row.start(a)
a<-table.element(a,'Autocorrelation Function',4,TRUE)
a<-table.row.end(a)
a<-table.row.start(a)
a<-table.element(a,'Time lag k',header=TRUE)
a<-table.element(a,hyperlink('basics.htm','ACF(k)','click here for more information about the Autocorrelation Function'),header=TRUE)
a<-table.element(a,'T-STAT',header=TRUE)
a<-table.element(a,'P-value',header=TRUE)
a<-table.row.end(a)
for (i in 2:(par1+1)) {
a<-table.row.start(a)
a<-table.element(a,i-1,header=TRUE)
a<-table.element(a,round(myacf[i],6))
mytstat <- myacf[i]*sqrtn
a<-table.element(a,round(mytstat,4))
a<-table.element(a,round(1-pt(abs(mytstat),lengthx),6))
a<-table.row.end(a)
}
a<-table.end(a)
table.save(a,file='mytable.tab')
a<-table.start()
a<-table.row.start(a)
a<-table.element(a,'Partial Autocorrelation Function',4,TRUE)
a<-table.row.end(a)
a<-table.row.start(a)
a<-table.element(a,'Time lag k',header=TRUE)
a<-table.element(a,hyperlink('basics.htm','PACF(k)','click here for more information about the Partial Autocorrelation Function'),header=TRUE)
a<-table.element(a,'T-STAT',header=TRUE)
a<-table.element(a,'P-value',header=TRUE)
a<-table.row.end(a)
for (i in 1:par1) {
a<-table.row.start(a)
a<-table.element(a,i,header=TRUE)
a<-table.element(a,round(mypacf[i],6))
mytstat <- mypacf[i]*sqrtn
a<-table.element(a,round(mytstat,4))
a<-table.element(a,round(1-pt(abs(mytstat),lengthx),6))
a<-table.row.end(a)
}
a<-table.end(a)
table.save(a,file='mytable1.tab')