Free Statistics

of Irreproducible Research!

Author's title

Author*The author of this computation has been verified*
R Software Modulerwasp_autocorrelation.wasp
Title produced by software(Partial) Autocorrelation Function
Date of computationThu, 26 Nov 2009 08:34:54 -0700
Cite this page as followsStatistical Computations at FreeStatistics.org, Office for Research Development and Education, URL https://freestatistics.org/blog/index.php?v=date/2009/Nov/26/t1259249762vlchnp3fhn7xih5.htm/, Retrieved Mon, 29 Apr 2024 00:48:30 +0000
Statistical Computations at FreeStatistics.org, Office for Research Development and Education, URL https://freestatistics.org/blog/index.php?pk=60104, Retrieved Mon, 29 Apr 2024 00:48:30 +0000
QR Codes:

Original text written by user:
IsPrivate?No (this computation is public)
User-defined keywords
Estimated Impact119
Family? (F = Feedback message, R = changed R code, M = changed R Module, P = changed Parameters, D = changed Data)
-       [(Partial) Autocorrelation Function] [ws8 ACF 3] [2009-11-26 15:34:54] [8b8f95c5f2993a04d1b74eff1a82c018] [Current]
Feedback Forum

Post a new message
Dataseries X:
89
88
86
89
84
86
85
86
85
83
85
84
88
84
84
86
85
88
87
88
87
89
90
94
95
95
96
97
97
97
96
100
97
98
96
94
95
93
95
96
96
98
95
96
98
94
93
94
92
92
93
95
92
94
96
97
95
94
96
93


Summary of computational transaction
Raw Inputview raw input (R code)
Raw Outputview raw output of R engine
Computing time2 seconds
R Server'Gwilym Jenkins' @ 72.249.127.135

\begin{tabular}{lllllllll}
\hline
Summary of computational transaction \tabularnewline
Raw Input & view raw input (R code)  \tabularnewline
Raw Output & view raw output of R engine  \tabularnewline
Computing time & 2 seconds \tabularnewline
R Server & 'Gwilym Jenkins' @ 72.249.127.135 \tabularnewline
\hline
\end{tabular}
%Source: https://freestatistics.org/blog/index.php?pk=60104&T=0

[TABLE]
[ROW][C]Summary of computational transaction[/C][/ROW]
[ROW][C]Raw Input[/C][C]view raw input (R code) [/C][/ROW]
[ROW][C]Raw Output[/C][C]view raw output of R engine [/C][/ROW]
[ROW][C]Computing time[/C][C]2 seconds[/C][/ROW]
[ROW][C]R Server[/C][C]'Gwilym Jenkins' @ 72.249.127.135[/C][/ROW]
[/TABLE]
Source: https://freestatistics.org/blog/index.php?pk=60104&T=0

Globally Unique Identifier (entire table): ba.freestatistics.org/blog/index.php?pk=60104&T=0

As an alternative you can also use a QR Code:  

The GUIDs for individual cells are displayed in the table below:

Summary of computational transaction
Raw Inputview raw input (R code)
Raw Outputview raw output of R engine
Computing time2 seconds
R Server'Gwilym Jenkins' @ 72.249.127.135


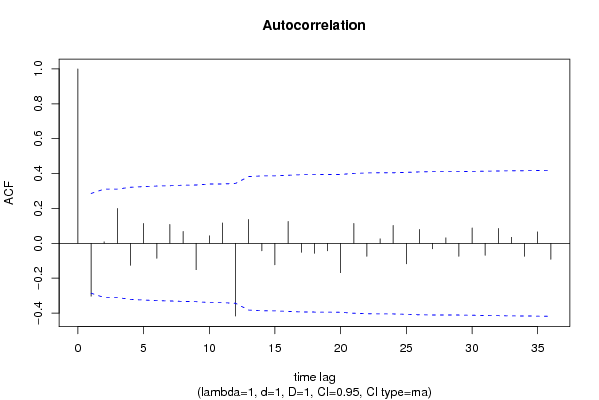
Autocorrelation Function
Time lag kACF(k)T-STATP-value
1-0.302857-2.07630.021681
20.0085710.05880.476695
30.21.37110.088423
4-0.125714-0.86190.196572
50.1142860.78350.218631
6-0.085714-0.58760.279798
70.1085710.74430.230192
80.0685710.47010.320228
9-0.151429-1.03810.152258
100.0428570.29380.385097
110.1171430.80310.212982
12-0.417143-2.85980.003152
130.1371430.94020.17596
14-0.042857-0.29380.385097
15-0.122857-0.84230.201952
160.1257140.86190.196572
17-0.051429-0.35260.362991
18-0.057143-0.39180.348506
19-0.042857-0.29380.385097
20-0.168571-1.15570.126829
210.1142860.78350.218631
22-0.074286-0.50930.30647
230.0257140.17630.430412
240.1028570.70520.242098
25-0.117143-0.80310.212982
260.080.54850.292989
27-0.031429-0.21550.415169
280.0314290.21550.415169
29-0.074286-0.50930.30647
300.0885710.60720.273315
31-0.068571-0.47010.320228
320.0857140.58760.279798
330.0342860.23510.407595
34-0.074286-0.50930.30647
350.0657140.45050.327205
36-0.091429-0.62680.266911

\begin{tabular}{lllllllll}
\hline
Autocorrelation Function \tabularnewline
Time lag k & ACF(k) & T-STAT & P-value \tabularnewline
1 & -0.302857 & -2.0763 & 0.021681 \tabularnewline
2 & 0.008571 & 0.0588 & 0.476695 \tabularnewline
3 & 0.2 & 1.3711 & 0.088423 \tabularnewline
4 & -0.125714 & -0.8619 & 0.196572 \tabularnewline
5 & 0.114286 & 0.7835 & 0.218631 \tabularnewline
6 & -0.085714 & -0.5876 & 0.279798 \tabularnewline
7 & 0.108571 & 0.7443 & 0.230192 \tabularnewline
8 & 0.068571 & 0.4701 & 0.320228 \tabularnewline
9 & -0.151429 & -1.0381 & 0.152258 \tabularnewline
10 & 0.042857 & 0.2938 & 0.385097 \tabularnewline
11 & 0.117143 & 0.8031 & 0.212982 \tabularnewline
12 & -0.417143 & -2.8598 & 0.003152 \tabularnewline
13 & 0.137143 & 0.9402 & 0.17596 \tabularnewline
14 & -0.042857 & -0.2938 & 0.385097 \tabularnewline
15 & -0.122857 & -0.8423 & 0.201952 \tabularnewline
16 & 0.125714 & 0.8619 & 0.196572 \tabularnewline
17 & -0.051429 & -0.3526 & 0.362991 \tabularnewline
18 & -0.057143 & -0.3918 & 0.348506 \tabularnewline
19 & -0.042857 & -0.2938 & 0.385097 \tabularnewline
20 & -0.168571 & -1.1557 & 0.126829 \tabularnewline
21 & 0.114286 & 0.7835 & 0.218631 \tabularnewline
22 & -0.074286 & -0.5093 & 0.30647 \tabularnewline
23 & 0.025714 & 0.1763 & 0.430412 \tabularnewline
24 & 0.102857 & 0.7052 & 0.242098 \tabularnewline
25 & -0.117143 & -0.8031 & 0.212982 \tabularnewline
26 & 0.08 & 0.5485 & 0.292989 \tabularnewline
27 & -0.031429 & -0.2155 & 0.415169 \tabularnewline
28 & 0.031429 & 0.2155 & 0.415169 \tabularnewline
29 & -0.074286 & -0.5093 & 0.30647 \tabularnewline
30 & 0.088571 & 0.6072 & 0.273315 \tabularnewline
31 & -0.068571 & -0.4701 & 0.320228 \tabularnewline
32 & 0.085714 & 0.5876 & 0.279798 \tabularnewline
33 & 0.034286 & 0.2351 & 0.407595 \tabularnewline
34 & -0.074286 & -0.5093 & 0.30647 \tabularnewline
35 & 0.065714 & 0.4505 & 0.327205 \tabularnewline
36 & -0.091429 & -0.6268 & 0.266911 \tabularnewline
\hline
\end{tabular}
%Source: https://freestatistics.org/blog/index.php?pk=60104&T=1

[TABLE]
[ROW][C]Autocorrelation Function[/C][/ROW]
[ROW][C]Time lag k[/C][C]ACF(k)[/C][C]T-STAT[/C][C]P-value[/C][/ROW]
[ROW][C]1[/C][C]-0.302857[/C][C]-2.0763[/C][C]0.021681[/C][/ROW]
[ROW][C]2[/C][C]0.008571[/C][C]0.0588[/C][C]0.476695[/C][/ROW]
[ROW][C]3[/C][C]0.2[/C][C]1.3711[/C][C]0.088423[/C][/ROW]
[ROW][C]4[/C][C]-0.125714[/C][C]-0.8619[/C][C]0.196572[/C][/ROW]
[ROW][C]5[/C][C]0.114286[/C][C]0.7835[/C][C]0.218631[/C][/ROW]
[ROW][C]6[/C][C]-0.085714[/C][C]-0.5876[/C][C]0.279798[/C][/ROW]
[ROW][C]7[/C][C]0.108571[/C][C]0.7443[/C][C]0.230192[/C][/ROW]
[ROW][C]8[/C][C]0.068571[/C][C]0.4701[/C][C]0.320228[/C][/ROW]
[ROW][C]9[/C][C]-0.151429[/C][C]-1.0381[/C][C]0.152258[/C][/ROW]
[ROW][C]10[/C][C]0.042857[/C][C]0.2938[/C][C]0.385097[/C][/ROW]
[ROW][C]11[/C][C]0.117143[/C][C]0.8031[/C][C]0.212982[/C][/ROW]
[ROW][C]12[/C][C]-0.417143[/C][C]-2.8598[/C][C]0.003152[/C][/ROW]
[ROW][C]13[/C][C]0.137143[/C][C]0.9402[/C][C]0.17596[/C][/ROW]
[ROW][C]14[/C][C]-0.042857[/C][C]-0.2938[/C][C]0.385097[/C][/ROW]
[ROW][C]15[/C][C]-0.122857[/C][C]-0.8423[/C][C]0.201952[/C][/ROW]
[ROW][C]16[/C][C]0.125714[/C][C]0.8619[/C][C]0.196572[/C][/ROW]
[ROW][C]17[/C][C]-0.051429[/C][C]-0.3526[/C][C]0.362991[/C][/ROW]
[ROW][C]18[/C][C]-0.057143[/C][C]-0.3918[/C][C]0.348506[/C][/ROW]
[ROW][C]19[/C][C]-0.042857[/C][C]-0.2938[/C][C]0.385097[/C][/ROW]
[ROW][C]20[/C][C]-0.168571[/C][C]-1.1557[/C][C]0.126829[/C][/ROW]
[ROW][C]21[/C][C]0.114286[/C][C]0.7835[/C][C]0.218631[/C][/ROW]
[ROW][C]22[/C][C]-0.074286[/C][C]-0.5093[/C][C]0.30647[/C][/ROW]
[ROW][C]23[/C][C]0.025714[/C][C]0.1763[/C][C]0.430412[/C][/ROW]
[ROW][C]24[/C][C]0.102857[/C][C]0.7052[/C][C]0.242098[/C][/ROW]
[ROW][C]25[/C][C]-0.117143[/C][C]-0.8031[/C][C]0.212982[/C][/ROW]
[ROW][C]26[/C][C]0.08[/C][C]0.5485[/C][C]0.292989[/C][/ROW]
[ROW][C]27[/C][C]-0.031429[/C][C]-0.2155[/C][C]0.415169[/C][/ROW]
[ROW][C]28[/C][C]0.031429[/C][C]0.2155[/C][C]0.415169[/C][/ROW]
[ROW][C]29[/C][C]-0.074286[/C][C]-0.5093[/C][C]0.30647[/C][/ROW]
[ROW][C]30[/C][C]0.088571[/C][C]0.6072[/C][C]0.273315[/C][/ROW]
[ROW][C]31[/C][C]-0.068571[/C][C]-0.4701[/C][C]0.320228[/C][/ROW]
[ROW][C]32[/C][C]0.085714[/C][C]0.5876[/C][C]0.279798[/C][/ROW]
[ROW][C]33[/C][C]0.034286[/C][C]0.2351[/C][C]0.407595[/C][/ROW]
[ROW][C]34[/C][C]-0.074286[/C][C]-0.5093[/C][C]0.30647[/C][/ROW]
[ROW][C]35[/C][C]0.065714[/C][C]0.4505[/C][C]0.327205[/C][/ROW]
[ROW][C]36[/C][C]-0.091429[/C][C]-0.6268[/C][C]0.266911[/C][/ROW]
[/TABLE]
Source: https://freestatistics.org/blog/index.php?pk=60104&T=1

Globally Unique Identifier (entire table): ba.freestatistics.org/blog/index.php?pk=60104&T=1

As an alternative you can also use a QR Code:  

The GUIDs for individual cells are displayed in the table below:

Autocorrelation Function
Time lag kACF(k)T-STATP-value
1-0.302857-2.07630.021681
20.0085710.05880.476695
30.21.37110.088423
4-0.125714-0.86190.196572
50.1142860.78350.218631
6-0.085714-0.58760.279798
70.1085710.74430.230192
80.0685710.47010.320228
9-0.151429-1.03810.152258
100.0428570.29380.385097
110.1171430.80310.212982
12-0.417143-2.85980.003152
130.1371430.94020.17596
14-0.042857-0.29380.385097
15-0.122857-0.84230.201952
160.1257140.86190.196572
17-0.051429-0.35260.362991
18-0.057143-0.39180.348506
19-0.042857-0.29380.385097
20-0.168571-1.15570.126829
210.1142860.78350.218631
22-0.074286-0.50930.30647
230.0257140.17630.430412
240.1028570.70520.242098
25-0.117143-0.80310.212982
260.080.54850.292989
27-0.031429-0.21550.415169
280.0314290.21550.415169
29-0.074286-0.50930.30647
300.0885710.60720.273315
31-0.068571-0.47010.320228
320.0857140.58760.279798
330.0342860.23510.407595
34-0.074286-0.50930.30647
350.0657140.45050.327205
36-0.091429-0.62680.266911


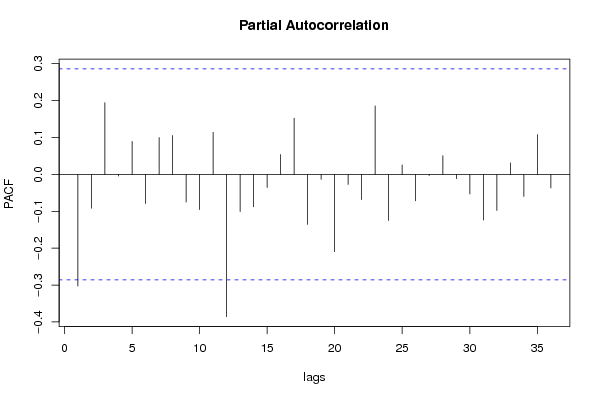
Partial Autocorrelation Function
Time lag kPACF(k)T-STATP-value
1-0.302857-2.07630.021681
2-0.091548-0.62760.266645
30.194421.33290.094499
4-0.004664-0.0320.487313
50.0894210.6130.271403
6-0.079022-0.54170.295277
70.1000290.68580.248116
80.1056810.72450.236172
9-0.074963-0.51390.304857
10-0.095431-0.65420.258072
110.1141560.78260.218889
12-0.385726-2.64440.005545
13-0.10078-0.69090.24651
14-0.087765-0.60170.275136
15-0.035371-0.24250.404728
160.0539060.36960.356684
170.1524871.04540.150593
18-0.135788-0.93090.178328
19-0.013391-0.09180.463622
20-0.209622-1.43710.078658
21-0.02723-0.18670.426357
22-0.06832-0.46840.320838
230.1856281.27260.10471
24-0.125298-0.8590.19735
250.0257320.17640.430366
26-0.071488-0.49010.313173
27-0.003261-0.02240.49113
280.0508110.34830.36457
29-0.01152-0.0790.468692
30-0.053064-0.36380.358825
31-0.123844-0.8490.200084
32-0.097878-0.6710.252747
330.03090.21180.416574
34-0.059873-0.41050.341663
350.1080380.74070.231288
36-0.036733-0.25180.401136

\begin{tabular}{lllllllll}
\hline
Partial Autocorrelation Function \tabularnewline
Time lag k & PACF(k) & T-STAT & P-value \tabularnewline
1 & -0.302857 & -2.0763 & 0.021681 \tabularnewline
2 & -0.091548 & -0.6276 & 0.266645 \tabularnewline
3 & 0.19442 & 1.3329 & 0.094499 \tabularnewline
4 & -0.004664 & -0.032 & 0.487313 \tabularnewline
5 & 0.089421 & 0.613 & 0.271403 \tabularnewline
6 & -0.079022 & -0.5417 & 0.295277 \tabularnewline
7 & 0.100029 & 0.6858 & 0.248116 \tabularnewline
8 & 0.105681 & 0.7245 & 0.236172 \tabularnewline
9 & -0.074963 & -0.5139 & 0.304857 \tabularnewline
10 & -0.095431 & -0.6542 & 0.258072 \tabularnewline
11 & 0.114156 & 0.7826 & 0.218889 \tabularnewline
12 & -0.385726 & -2.6444 & 0.005545 \tabularnewline
13 & -0.10078 & -0.6909 & 0.24651 \tabularnewline
14 & -0.087765 & -0.6017 & 0.275136 \tabularnewline
15 & -0.035371 & -0.2425 & 0.404728 \tabularnewline
16 & 0.053906 & 0.3696 & 0.356684 \tabularnewline
17 & 0.152487 & 1.0454 & 0.150593 \tabularnewline
18 & -0.135788 & -0.9309 & 0.178328 \tabularnewline
19 & -0.013391 & -0.0918 & 0.463622 \tabularnewline
20 & -0.209622 & -1.4371 & 0.078658 \tabularnewline
21 & -0.02723 & -0.1867 & 0.426357 \tabularnewline
22 & -0.06832 & -0.4684 & 0.320838 \tabularnewline
23 & 0.185628 & 1.2726 & 0.10471 \tabularnewline
24 & -0.125298 & -0.859 & 0.19735 \tabularnewline
25 & 0.025732 & 0.1764 & 0.430366 \tabularnewline
26 & -0.071488 & -0.4901 & 0.313173 \tabularnewline
27 & -0.003261 & -0.0224 & 0.49113 \tabularnewline
28 & 0.050811 & 0.3483 & 0.36457 \tabularnewline
29 & -0.01152 & -0.079 & 0.468692 \tabularnewline
30 & -0.053064 & -0.3638 & 0.358825 \tabularnewline
31 & -0.123844 & -0.849 & 0.200084 \tabularnewline
32 & -0.097878 & -0.671 & 0.252747 \tabularnewline
33 & 0.0309 & 0.2118 & 0.416574 \tabularnewline
34 & -0.059873 & -0.4105 & 0.341663 \tabularnewline
35 & 0.108038 & 0.7407 & 0.231288 \tabularnewline
36 & -0.036733 & -0.2518 & 0.401136 \tabularnewline
\hline
\end{tabular}
%Source: https://freestatistics.org/blog/index.php?pk=60104&T=2

[TABLE]
[ROW][C]Partial Autocorrelation Function[/C][/ROW]
[ROW][C]Time lag k[/C][C]PACF(k)[/C][C]T-STAT[/C][C]P-value[/C][/ROW]
[ROW][C]1[/C][C]-0.302857[/C][C]-2.0763[/C][C]0.021681[/C][/ROW]
[ROW][C]2[/C][C]-0.091548[/C][C]-0.6276[/C][C]0.266645[/C][/ROW]
[ROW][C]3[/C][C]0.19442[/C][C]1.3329[/C][C]0.094499[/C][/ROW]
[ROW][C]4[/C][C]-0.004664[/C][C]-0.032[/C][C]0.487313[/C][/ROW]
[ROW][C]5[/C][C]0.089421[/C][C]0.613[/C][C]0.271403[/C][/ROW]
[ROW][C]6[/C][C]-0.079022[/C][C]-0.5417[/C][C]0.295277[/C][/ROW]
[ROW][C]7[/C][C]0.100029[/C][C]0.6858[/C][C]0.248116[/C][/ROW]
[ROW][C]8[/C][C]0.105681[/C][C]0.7245[/C][C]0.236172[/C][/ROW]
[ROW][C]9[/C][C]-0.074963[/C][C]-0.5139[/C][C]0.304857[/C][/ROW]
[ROW][C]10[/C][C]-0.095431[/C][C]-0.6542[/C][C]0.258072[/C][/ROW]
[ROW][C]11[/C][C]0.114156[/C][C]0.7826[/C][C]0.218889[/C][/ROW]
[ROW][C]12[/C][C]-0.385726[/C][C]-2.6444[/C][C]0.005545[/C][/ROW]
[ROW][C]13[/C][C]-0.10078[/C][C]-0.6909[/C][C]0.24651[/C][/ROW]
[ROW][C]14[/C][C]-0.087765[/C][C]-0.6017[/C][C]0.275136[/C][/ROW]
[ROW][C]15[/C][C]-0.035371[/C][C]-0.2425[/C][C]0.404728[/C][/ROW]
[ROW][C]16[/C][C]0.053906[/C][C]0.3696[/C][C]0.356684[/C][/ROW]
[ROW][C]17[/C][C]0.152487[/C][C]1.0454[/C][C]0.150593[/C][/ROW]
[ROW][C]18[/C][C]-0.135788[/C][C]-0.9309[/C][C]0.178328[/C][/ROW]
[ROW][C]19[/C][C]-0.013391[/C][C]-0.0918[/C][C]0.463622[/C][/ROW]
[ROW][C]20[/C][C]-0.209622[/C][C]-1.4371[/C][C]0.078658[/C][/ROW]
[ROW][C]21[/C][C]-0.02723[/C][C]-0.1867[/C][C]0.426357[/C][/ROW]
[ROW][C]22[/C][C]-0.06832[/C][C]-0.4684[/C][C]0.320838[/C][/ROW]
[ROW][C]23[/C][C]0.185628[/C][C]1.2726[/C][C]0.10471[/C][/ROW]
[ROW][C]24[/C][C]-0.125298[/C][C]-0.859[/C][C]0.19735[/C][/ROW]
[ROW][C]25[/C][C]0.025732[/C][C]0.1764[/C][C]0.430366[/C][/ROW]
[ROW][C]26[/C][C]-0.071488[/C][C]-0.4901[/C][C]0.313173[/C][/ROW]
[ROW][C]27[/C][C]-0.003261[/C][C]-0.0224[/C][C]0.49113[/C][/ROW]
[ROW][C]28[/C][C]0.050811[/C][C]0.3483[/C][C]0.36457[/C][/ROW]
[ROW][C]29[/C][C]-0.01152[/C][C]-0.079[/C][C]0.468692[/C][/ROW]
[ROW][C]30[/C][C]-0.053064[/C][C]-0.3638[/C][C]0.358825[/C][/ROW]
[ROW][C]31[/C][C]-0.123844[/C][C]-0.849[/C][C]0.200084[/C][/ROW]
[ROW][C]32[/C][C]-0.097878[/C][C]-0.671[/C][C]0.252747[/C][/ROW]
[ROW][C]33[/C][C]0.0309[/C][C]0.2118[/C][C]0.416574[/C][/ROW]
[ROW][C]34[/C][C]-0.059873[/C][C]-0.4105[/C][C]0.341663[/C][/ROW]
[ROW][C]35[/C][C]0.108038[/C][C]0.7407[/C][C]0.231288[/C][/ROW]
[ROW][C]36[/C][C]-0.036733[/C][C]-0.2518[/C][C]0.401136[/C][/ROW]
[/TABLE]
Source: https://freestatistics.org/blog/index.php?pk=60104&T=2

Globally Unique Identifier (entire table): ba.freestatistics.org/blog/index.php?pk=60104&T=2

As an alternative you can also use a QR Code:  

The GUIDs for individual cells are displayed in the table below:

Partial Autocorrelation Function
Time lag kPACF(k)T-STATP-value
1-0.302857-2.07630.021681
2-0.091548-0.62760.266645
30.194421.33290.094499
4-0.004664-0.0320.487313
50.0894210.6130.271403
6-0.079022-0.54170.295277
70.1000290.68580.248116
80.1056810.72450.236172
9-0.074963-0.51390.304857
10-0.095431-0.65420.258072
110.1141560.78260.218889
12-0.385726-2.64440.005545
13-0.10078-0.69090.24651
14-0.087765-0.60170.275136
15-0.035371-0.24250.404728
160.0539060.36960.356684
170.1524871.04540.150593
18-0.135788-0.93090.178328
19-0.013391-0.09180.463622
20-0.209622-1.43710.078658
21-0.02723-0.18670.426357
22-0.06832-0.46840.320838
230.1856281.27260.10471
24-0.125298-0.8590.19735
250.0257320.17640.430366
26-0.071488-0.49010.313173
27-0.003261-0.02240.49113
280.0508110.34830.36457
29-0.01152-0.0790.468692
30-0.053064-0.36380.358825
31-0.123844-0.8490.200084
32-0.097878-0.6710.252747
330.03090.21180.416574
34-0.059873-0.41050.341663
350.1080380.74070.231288
36-0.036733-0.25180.401136


Parameters (Session):
par1 = 36 ; par2 = 1 ; par3 = 1 ; par4 = 1 ; par5 = 12 ; par6 = MA ; par7 = 0.95 ;
Parameters (R input):
par1 = 36 ; par2 = 1 ; par3 = 1 ; par4 = 1 ; par5 = 12 ; par6 = MA ; par7 = 0.95 ;
R code (references can be found in the software module):
if (par1 == 'Default') {
par1 = 10*log10(length(x))
} else {
par1 <- as.numeric(par1)
}
par2 <- as.numeric(par2)
par3 <- as.numeric(par3)
par4 <- as.numeric(par4)
par5 <- as.numeric(par5)
if (par6 == 'White Noise') par6 <- 'white' else par6 <- 'ma'
par7 <- as.numeric(par7)
if (par2 == 0) {
x <- log(x)
} else {
x <- (x ^ par2 - 1) / par2
}
if (par3 > 0) x <- diff(x,lag=1,difference=par3)
if (par4 > 0) x <- diff(x,lag=par5,difference=par4)
bitmap(file='pic1.png')
racf <- acf(x, par1, main='Autocorrelation', xlab='time lag', ylab='ACF', ci.type=par6, ci=par7, sub=paste('(lambda=',par2,', d=',par3,', D=',par4,', CI=', par7, ', CI type=',par6,')',sep=''))
dev.off()
bitmap(file='pic2.png')
rpacf <- pacf(x,par1,main='Partial Autocorrelation',xlab='lags',ylab='PACF')
dev.off()
(myacf <- c(racf$acf))
(mypacf <- c(rpacf$acf))
lengthx <- length(x)
sqrtn <- sqrt(lengthx)
load(file='createtable')
a<-table.start()
a<-table.row.start(a)
a<-table.element(a,'Autocorrelation Function',4,TRUE)
a<-table.row.end(a)
a<-table.row.start(a)
a<-table.element(a,'Time lag k',header=TRUE)
a<-table.element(a,hyperlink('basics.htm','ACF(k)','click here for more information about the Autocorrelation Function'),header=TRUE)
a<-table.element(a,'T-STAT',header=TRUE)
a<-table.element(a,'P-value',header=TRUE)
a<-table.row.end(a)
for (i in 2:(par1+1)) {
a<-table.row.start(a)
a<-table.element(a,i-1,header=TRUE)
a<-table.element(a,round(myacf[i],6))
mytstat <- myacf[i]*sqrtn
a<-table.element(a,round(mytstat,4))
a<-table.element(a,round(1-pt(abs(mytstat),lengthx),6))
a<-table.row.end(a)
}
a<-table.end(a)
table.save(a,file='mytable.tab')
a<-table.start()
a<-table.row.start(a)
a<-table.element(a,'Partial Autocorrelation Function',4,TRUE)
a<-table.row.end(a)
a<-table.row.start(a)
a<-table.element(a,'Time lag k',header=TRUE)
a<-table.element(a,hyperlink('basics.htm','PACF(k)','click here for more information about the Partial Autocorrelation Function'),header=TRUE)
a<-table.element(a,'T-STAT',header=TRUE)
a<-table.element(a,'P-value',header=TRUE)
a<-table.row.end(a)
for (i in 1:par1) {
a<-table.row.start(a)
a<-table.element(a,i,header=TRUE)
a<-table.element(a,round(mypacf[i],6))
mytstat <- mypacf[i]*sqrtn
a<-table.element(a,round(mytstat,4))
a<-table.element(a,round(1-pt(abs(mytstat),lengthx),6))
a<-table.row.end(a)
}
a<-table.end(a)
table.save(a,file='mytable1.tab')