Free Statistics

of Irreproducible Research!

Author's title

Author*The author of this computation has been verified*
R Software Modulerwasp_multipleregression.wasp
Title produced by softwareMultiple Regression
Date of computationThu, 26 Nov 2009 08:43:34 -0700
Cite this page as followsStatistical Computations at FreeStatistics.org, Office for Research Development and Education, URL https://freestatistics.org/blog/index.php?v=date/2009/Nov/26/t1259251225767320ztf5oylrk.htm/, Retrieved Mon, 29 Apr 2024 07:11:57 +0000
Statistical Computations at FreeStatistics.org, Office for Research Development and Education, URL https://freestatistics.org/blog/index.php?pk=60136, Retrieved Mon, 29 Apr 2024 07:11:57 +0000
QR Codes:

Original text written by user:
IsPrivate?No (this computation is public)
User-defined keywords
Estimated Impact145
Family? (F = Feedback message, R = changed R code, M = changed R Module, P = changed Parameters, D = changed Data)
-     [Multiple Regression] [Q1 The Seatbeltlaw] [2007-11-14 19:27:43] [8cd6641b921d30ebe00b648d1481bba0]
- RMPD  [Multiple Regression] [Seatbelt] [2009-11-12 13:54:52] [b98453cac15ba1066b407e146608df68]
-    D    [Multiple Regression] [workshop 7] [2009-11-20 08:30:37] [f1a50df816abcbb519e7637ff6b72fa0]
-    D        [Multiple Regression] [cs.shw.ws7.v1] [2009-11-26 15:43:34] [47f146dd9fb230449e079c6cbc92f5f5] [Current]
-    D          [Multiple Regression] [ws7 seatbelt law ...] [2009-11-27 17:39:19] [bd8e774728cf1f2f4e6868fd314defe3]
Feedback Forum

Post a new message
Dataseries X:
8.9	1.9
9	1.6
9	1.7
9	2
9	2.5
9	2.4
9	2.3
9	2.3
9	2.1
9	2.4
9	2.2
9.1	2.4
9	1.9
9	2.1
9.1	2.1
9	2.1
9	2
9	2.1
9	2.2
8.9	2.2
8.9	2.6
8.9	2.5
8.9	2.3
8.8	2.2
8.8	2.4
8.7	2.3
8.7	2.2
8.5	2.5
8.5	2.5
8.4	2.5
8.2	2.4
8.2	2.3
8.1	1.7
8.1	1.6
8	1.9
7.9	1.9
7.8	1.8
7.7	1.8
7.6	1.9
7.5	1.9
7.5	1.9
7.5	1.9
7.5	1.8
7.5	1.7
7.4	2.1
7.4	2.6
7.3	3.1
7.3	3.1
7.3	3.2
7.2	3.3
7.2	3.6
7.3	3.3
7.4	3.7
7.4	4
7.5	4
7.6	3.8
7.7	3.6
7.9	3.2
8	2.1
8.2	1.6


Summary of computational transaction
Raw Inputview raw input (R code)
Raw Outputview raw output of R engine
Computing time4 seconds
R Server'Gwilym Jenkins' @ 72.249.127.135
R Framework error message
The field 'Names of X columns' contains a hard return which cannot be interpreted.
Please, resubmit your request without hard returns in the 'Names of X columns'.

\begin{tabular}{lllllllll}
\hline
Summary of computational transaction \tabularnewline
Raw Input & view raw input (R code)  \tabularnewline
Raw Output & view raw output of R engine  \tabularnewline
Computing time & 4 seconds \tabularnewline
R Server & 'Gwilym Jenkins' @ 72.249.127.135 \tabularnewline
R Framework error message & 
The field 'Names of X columns' contains a hard return which cannot be interpreted.
Please, resubmit your request without hard returns in the 'Names of X columns'.
\tabularnewline \hline \end{tabular} %Source: https://freestatistics.org/blog/index.php?pk=60136&T=0

[TABLE]
[ROW][C]Summary of computational transaction[/C][/ROW]
[ROW][C]Raw Input[/C][C]view raw input (R code) [/C][/ROW]
[ROW][C]Raw Output[/C][C]view raw output of R engine [/C][/ROW]
[ROW][C]Computing time[/C][C]4 seconds[/C][/ROW]
[ROW][C]R Server[/C][C]'Gwilym Jenkins' @ 72.249.127.135[/C][/ROW]
[ROW][C]R Framework error message[/C][C]
The field 'Names of X columns' contains a hard return which cannot be interpreted.
Please, resubmit your request without hard returns in the 'Names of X columns'.
[/C][/ROW] [/TABLE] Source: https://freestatistics.org/blog/index.php?pk=60136&T=0

Globally Unique Identifier (entire table): ba.freestatistics.org/blog/index.php?pk=60136&T=0

As an alternative you can also use a QR Code:  

The GUIDs for individual cells are displayed in the table below:

Summary of computational transaction
Raw Inputview raw input (R code)
Raw Outputview raw output of R engine
Computing time4 seconds
R Server'Gwilym Jenkins' @ 72.249.127.135
R Framework error message
The field 'Names of X columns' contains a hard return which cannot be interpreted.
Please, resubmit your request without hard returns in the 'Names of X columns'.


Multiple Linear Regression - Estimated Regression Equation
werkl[t] = + 9.4012055941857 -0.472940234830022`infl `[t] + e[t]

\begin{tabular}{lllllllll}
\hline
Multiple Linear Regression - Estimated Regression Equation \tabularnewline
werkl[t] =  +  9.4012055941857 -0.472940234830022`infl
`[t]  + e[t] \tabularnewline
\hline
\end{tabular}
%Source: https://freestatistics.org/blog/index.php?pk=60136&T=1

[TABLE]
[ROW][C]Multiple Linear Regression - Estimated Regression Equation[/C][/ROW]
[ROW][C]werkl[t] =  +  9.4012055941857 -0.472940234830022`infl
`[t]  + e[t][/C][/ROW]
[/TABLE]
Source: https://freestatistics.org/blog/index.php?pk=60136&T=1

Globally Unique Identifier (entire table): ba.freestatistics.org/blog/index.php?pk=60136&T=1

As an alternative you can also use a QR Code:  

The GUIDs for individual cells are displayed in the table below:

Multiple Linear Regression - Estimated Regression Equation
werkl[t] = + 9.4012055941857 -0.472940234830022`infl `[t] + e[t]


Multiple Linear Regression - Ordinary Least Squares
VariableParameterS.D.T-STATH0: parameter = 02-tail p-value1-tail p-value
(Intercept)9.40120559418570.31923629.44900
`infl `-0.4729402348300220.129331-3.65680.0005520.000276

\begin{tabular}{lllllllll}
\hline
Multiple Linear Regression - Ordinary Least Squares \tabularnewline
Variable & Parameter & S.D. & T-STATH0: parameter = 0 & 2-tail p-value & 1-tail p-value \tabularnewline
(Intercept) & 9.4012055941857 & 0.319236 & 29.449 & 0 & 0 \tabularnewline
`infl
` & -0.472940234830022 & 0.129331 & -3.6568 & 0.000552 & 0.000276 \tabularnewline
\hline
\end{tabular}
%Source: https://freestatistics.org/blog/index.php?pk=60136&T=2

[TABLE]
[ROW][C]Multiple Linear Regression - Ordinary Least Squares[/C][/ROW]
[ROW][C]Variable[/C][C]Parameter[/C][C]S.D.[/C][C]T-STATH0: parameter = 0[/C][C]2-tail p-value[/C][C]1-tail p-value[/C][/ROW]
[ROW][C](Intercept)[/C][C]9.4012055941857[/C][C]0.319236[/C][C]29.449[/C][C]0[/C][C]0[/C][/ROW]
[ROW][C]`infl
`[/C][C]-0.472940234830022[/C][C]0.129331[/C][C]-3.6568[/C][C]0.000552[/C][C]0.000276[/C][/ROW]
[/TABLE]
Source: https://freestatistics.org/blog/index.php?pk=60136&T=2

Globally Unique Identifier (entire table): ba.freestatistics.org/blog/index.php?pk=60136&T=2

As an alternative you can also use a QR Code:  

The GUIDs for individual cells are displayed in the table below:

Multiple Linear Regression - Ordinary Least Squares
VariableParameterS.D.T-STATH0: parameter = 02-tail p-value1-tail p-value
(Intercept)9.40120559418570.31923629.44900
`infl `-0.4729402348300220.129331-3.65680.0005520.000276


Multiple Linear Regression - Regression Statistics
Multiple R0.432851265611944
R-squared0.187360218141862
Adjusted R-squared0.173349187420170
F-TEST (value)13.3723365442193
F-TEST (DF numerator)1
F-TEST (DF denominator)58
p-value0.000551893072794796
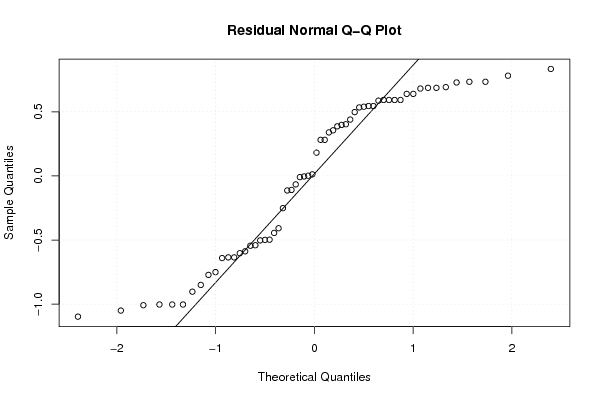
Multiple Linear Regression - Residual Statistics
Residual Standard Deviation0.624574080619395
Sum Squared Residuals22.6253813665306

\begin{tabular}{lllllllll}
\hline
Multiple Linear Regression - Regression Statistics \tabularnewline
Multiple R & 0.432851265611944 \tabularnewline
R-squared & 0.187360218141862 \tabularnewline
Adjusted R-squared & 0.173349187420170 \tabularnewline
F-TEST (value) & 13.3723365442193 \tabularnewline
F-TEST (DF numerator) & 1 \tabularnewline
F-TEST (DF denominator) & 58 \tabularnewline
p-value & 0.000551893072794796 \tabularnewline
Multiple Linear Regression - Residual Statistics \tabularnewline
Residual Standard Deviation & 0.624574080619395 \tabularnewline
Sum Squared Residuals & 22.6253813665306 \tabularnewline
\hline
\end{tabular}
%Source: https://freestatistics.org/blog/index.php?pk=60136&T=3

[TABLE]
[ROW][C]Multiple Linear Regression - Regression Statistics[/C][/ROW]
[ROW][C]Multiple R[/C][C]0.432851265611944[/C][/ROW]
[ROW][C]R-squared[/C][C]0.187360218141862[/C][/ROW]
[ROW][C]Adjusted R-squared[/C][C]0.173349187420170[/C][/ROW]
[ROW][C]F-TEST (value)[/C][C]13.3723365442193[/C][/ROW]
[ROW][C]F-TEST (DF numerator)[/C][C]1[/C][/ROW]
[ROW][C]F-TEST (DF denominator)[/C][C]58[/C][/ROW]
[ROW][C]p-value[/C][C]0.000551893072794796[/C][/ROW]
[ROW][C]Multiple Linear Regression - Residual Statistics[/C][/ROW]
[ROW][C]Residual Standard Deviation[/C][C]0.624574080619395[/C][/ROW]
[ROW][C]Sum Squared Residuals[/C][C]22.6253813665306[/C][/ROW]
[/TABLE]
Source: https://freestatistics.org/blog/index.php?pk=60136&T=3

Globally Unique Identifier (entire table): ba.freestatistics.org/blog/index.php?pk=60136&T=3

As an alternative you can also use a QR Code:  

The GUIDs for individual cells are displayed in the table below:

Multiple Linear Regression - Regression Statistics
Multiple R0.432851265611944
R-squared0.187360218141862
Adjusted R-squared0.173349187420170
F-TEST (value)13.3723365442193
F-TEST (DF numerator)1
F-TEST (DF denominator)58
p-value0.000551893072794796
Multiple Linear Regression - Residual Statistics
Residual Standard Deviation0.624574080619395
Sum Squared Residuals22.6253813665306


Multiple Linear Regression - Actuals, Interpolation, and Residuals
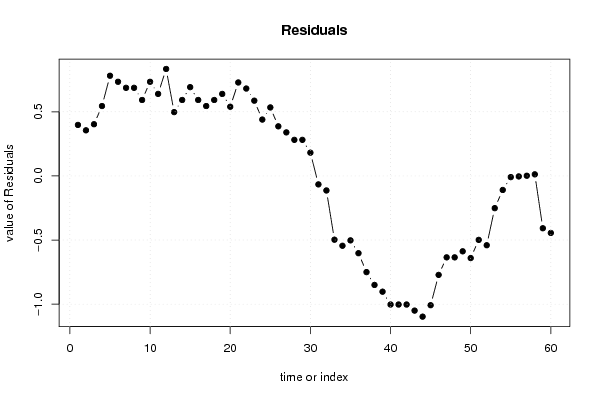
Time or IndexActualsInterpolationForecastResidualsPrediction Error
18.98.50261914800870.397380851991294
298.644501218457670.355498781542334
398.597207194974660.402792805025335
498.455325124525660.544674875474342
598.218855007110650.781144992889353
698.266149030593650.733850969406351
798.313443054076650.686556945923349
898.313443054076650.686556945923349
998.408031101042660.591968898957344
1098.266149030593650.733850969406351
1198.360737077559650.639262922440347
129.18.266149030593650.83385096940635
1398.502619148008660.49738085199134
1498.408031101042660.591968898957344
159.18.408031101042660.691968898957344
1698.408031101042660.591968898957344
1798.455325124525660.544674875474342
1898.408031101042660.591968898957344
1998.360737077559650.639262922440347
208.98.360737077559650.539262922440347
218.98.171560983627640.728439016372356
228.98.218855007110650.681144992889354
238.98.313443054076650.586556945923349
248.88.360737077559650.439262922440347
258.88.266149030593650.533850969406352
268.78.313443054076650.386556945923348
278.78.360737077559650.339262922440346
288.58.218855007110650.281144992889353
298.58.218855007110650.281144992889353
308.48.218855007110650.181144992889354
318.28.26614903059365-0.0661490305936497
328.28.31344305407665-0.113443054076652
338.18.59720719497466-0.497207194974665
348.18.64450121845767-0.544501218457667
3588.50261914800866-0.50261914800866
367.98.50261914800866-0.60261914800866
377.88.54991317149166-0.749913171491662
387.78.54991317149166-0.849913171491662
397.68.50261914800866-0.90261914800866
407.58.50261914800866-1.00261914800866
417.58.50261914800866-1.00261914800866
427.58.50261914800866-1.00261914800866
437.58.54991317149166-1.04991317149166
447.58.59720719497466-1.09720719497466
457.48.40803110104266-1.00803110104266
467.48.17156098362764-0.771560983627644
477.37.93509086621263-0.635090866212634
487.37.93509086621263-0.635090866212634
497.37.88779684272963-0.587796842729631
507.27.84050281924663-0.640502819246629
517.27.69862074879762-0.498620748797622
527.37.84050281924663-0.540502819246629
537.47.65132672531462-0.251326725314619
547.47.50944465486561-0.109444654865613
557.57.50944465486561-0.00944465486561315
567.67.60403270183162-0.0040327018316181
577.77.698620748797620.00137925120237802
587.97.887796842729630.0122031572703693
5988.40803110104266-0.408031101042656
608.28.64450121845767-0.444501218457667

\begin{tabular}{lllllllll}
\hline
Multiple Linear Regression - Actuals, Interpolation, and Residuals \tabularnewline
Time or Index & Actuals & InterpolationForecast & ResidualsPrediction Error \tabularnewline
1 & 8.9 & 8.5026191480087 & 0.397380851991294 \tabularnewline
2 & 9 & 8.64450121845767 & 0.355498781542334 \tabularnewline
3 & 9 & 8.59720719497466 & 0.402792805025335 \tabularnewline
4 & 9 & 8.45532512452566 & 0.544674875474342 \tabularnewline
5 & 9 & 8.21885500711065 & 0.781144992889353 \tabularnewline
6 & 9 & 8.26614903059365 & 0.733850969406351 \tabularnewline
7 & 9 & 8.31344305407665 & 0.686556945923349 \tabularnewline
8 & 9 & 8.31344305407665 & 0.686556945923349 \tabularnewline
9 & 9 & 8.40803110104266 & 0.591968898957344 \tabularnewline
10 & 9 & 8.26614903059365 & 0.733850969406351 \tabularnewline
11 & 9 & 8.36073707755965 & 0.639262922440347 \tabularnewline
12 & 9.1 & 8.26614903059365 & 0.83385096940635 \tabularnewline
13 & 9 & 8.50261914800866 & 0.49738085199134 \tabularnewline
14 & 9 & 8.40803110104266 & 0.591968898957344 \tabularnewline
15 & 9.1 & 8.40803110104266 & 0.691968898957344 \tabularnewline
16 & 9 & 8.40803110104266 & 0.591968898957344 \tabularnewline
17 & 9 & 8.45532512452566 & 0.544674875474342 \tabularnewline
18 & 9 & 8.40803110104266 & 0.591968898957344 \tabularnewline
19 & 9 & 8.36073707755965 & 0.639262922440347 \tabularnewline
20 & 8.9 & 8.36073707755965 & 0.539262922440347 \tabularnewline
21 & 8.9 & 8.17156098362764 & 0.728439016372356 \tabularnewline
22 & 8.9 & 8.21885500711065 & 0.681144992889354 \tabularnewline
23 & 8.9 & 8.31344305407665 & 0.586556945923349 \tabularnewline
24 & 8.8 & 8.36073707755965 & 0.439262922440347 \tabularnewline
25 & 8.8 & 8.26614903059365 & 0.533850969406352 \tabularnewline
26 & 8.7 & 8.31344305407665 & 0.386556945923348 \tabularnewline
27 & 8.7 & 8.36073707755965 & 0.339262922440346 \tabularnewline
28 & 8.5 & 8.21885500711065 & 0.281144992889353 \tabularnewline
29 & 8.5 & 8.21885500711065 & 0.281144992889353 \tabularnewline
30 & 8.4 & 8.21885500711065 & 0.181144992889354 \tabularnewline
31 & 8.2 & 8.26614903059365 & -0.0661490305936497 \tabularnewline
32 & 8.2 & 8.31344305407665 & -0.113443054076652 \tabularnewline
33 & 8.1 & 8.59720719497466 & -0.497207194974665 \tabularnewline
34 & 8.1 & 8.64450121845767 & -0.544501218457667 \tabularnewline
35 & 8 & 8.50261914800866 & -0.50261914800866 \tabularnewline
36 & 7.9 & 8.50261914800866 & -0.60261914800866 \tabularnewline
37 & 7.8 & 8.54991317149166 & -0.749913171491662 \tabularnewline
38 & 7.7 & 8.54991317149166 & -0.849913171491662 \tabularnewline
39 & 7.6 & 8.50261914800866 & -0.90261914800866 \tabularnewline
40 & 7.5 & 8.50261914800866 & -1.00261914800866 \tabularnewline
41 & 7.5 & 8.50261914800866 & -1.00261914800866 \tabularnewline
42 & 7.5 & 8.50261914800866 & -1.00261914800866 \tabularnewline
43 & 7.5 & 8.54991317149166 & -1.04991317149166 \tabularnewline
44 & 7.5 & 8.59720719497466 & -1.09720719497466 \tabularnewline
45 & 7.4 & 8.40803110104266 & -1.00803110104266 \tabularnewline
46 & 7.4 & 8.17156098362764 & -0.771560983627644 \tabularnewline
47 & 7.3 & 7.93509086621263 & -0.635090866212634 \tabularnewline
48 & 7.3 & 7.93509086621263 & -0.635090866212634 \tabularnewline
49 & 7.3 & 7.88779684272963 & -0.587796842729631 \tabularnewline
50 & 7.2 & 7.84050281924663 & -0.640502819246629 \tabularnewline
51 & 7.2 & 7.69862074879762 & -0.498620748797622 \tabularnewline
52 & 7.3 & 7.84050281924663 & -0.540502819246629 \tabularnewline
53 & 7.4 & 7.65132672531462 & -0.251326725314619 \tabularnewline
54 & 7.4 & 7.50944465486561 & -0.109444654865613 \tabularnewline
55 & 7.5 & 7.50944465486561 & -0.00944465486561315 \tabularnewline
56 & 7.6 & 7.60403270183162 & -0.0040327018316181 \tabularnewline
57 & 7.7 & 7.69862074879762 & 0.00137925120237802 \tabularnewline
58 & 7.9 & 7.88779684272963 & 0.0122031572703693 \tabularnewline
59 & 8 & 8.40803110104266 & -0.408031101042656 \tabularnewline
60 & 8.2 & 8.64450121845767 & -0.444501218457667 \tabularnewline
\hline
\end{tabular}
%Source: https://freestatistics.org/blog/index.php?pk=60136&T=4

[TABLE]
[ROW][C]Multiple Linear Regression - Actuals, Interpolation, and Residuals[/C][/ROW]
[ROW][C]Time or Index[/C][C]Actuals[/C][C]InterpolationForecast[/C][C]ResidualsPrediction Error[/C][/ROW]
[ROW][C]1[/C][C]8.9[/C][C]8.5026191480087[/C][C]0.397380851991294[/C][/ROW]
[ROW][C]2[/C][C]9[/C][C]8.64450121845767[/C][C]0.355498781542334[/C][/ROW]
[ROW][C]3[/C][C]9[/C][C]8.59720719497466[/C][C]0.402792805025335[/C][/ROW]
[ROW][C]4[/C][C]9[/C][C]8.45532512452566[/C][C]0.544674875474342[/C][/ROW]
[ROW][C]5[/C][C]9[/C][C]8.21885500711065[/C][C]0.781144992889353[/C][/ROW]
[ROW][C]6[/C][C]9[/C][C]8.26614903059365[/C][C]0.733850969406351[/C][/ROW]
[ROW][C]7[/C][C]9[/C][C]8.31344305407665[/C][C]0.686556945923349[/C][/ROW]
[ROW][C]8[/C][C]9[/C][C]8.31344305407665[/C][C]0.686556945923349[/C][/ROW]
[ROW][C]9[/C][C]9[/C][C]8.40803110104266[/C][C]0.591968898957344[/C][/ROW]
[ROW][C]10[/C][C]9[/C][C]8.26614903059365[/C][C]0.733850969406351[/C][/ROW]
[ROW][C]11[/C][C]9[/C][C]8.36073707755965[/C][C]0.639262922440347[/C][/ROW]
[ROW][C]12[/C][C]9.1[/C][C]8.26614903059365[/C][C]0.83385096940635[/C][/ROW]
[ROW][C]13[/C][C]9[/C][C]8.50261914800866[/C][C]0.49738085199134[/C][/ROW]
[ROW][C]14[/C][C]9[/C][C]8.40803110104266[/C][C]0.591968898957344[/C][/ROW]
[ROW][C]15[/C][C]9.1[/C][C]8.40803110104266[/C][C]0.691968898957344[/C][/ROW]
[ROW][C]16[/C][C]9[/C][C]8.40803110104266[/C][C]0.591968898957344[/C][/ROW]
[ROW][C]17[/C][C]9[/C][C]8.45532512452566[/C][C]0.544674875474342[/C][/ROW]
[ROW][C]18[/C][C]9[/C][C]8.40803110104266[/C][C]0.591968898957344[/C][/ROW]
[ROW][C]19[/C][C]9[/C][C]8.36073707755965[/C][C]0.639262922440347[/C][/ROW]
[ROW][C]20[/C][C]8.9[/C][C]8.36073707755965[/C][C]0.539262922440347[/C][/ROW]
[ROW][C]21[/C][C]8.9[/C][C]8.17156098362764[/C][C]0.728439016372356[/C][/ROW]
[ROW][C]22[/C][C]8.9[/C][C]8.21885500711065[/C][C]0.681144992889354[/C][/ROW]
[ROW][C]23[/C][C]8.9[/C][C]8.31344305407665[/C][C]0.586556945923349[/C][/ROW]
[ROW][C]24[/C][C]8.8[/C][C]8.36073707755965[/C][C]0.439262922440347[/C][/ROW]
[ROW][C]25[/C][C]8.8[/C][C]8.26614903059365[/C][C]0.533850969406352[/C][/ROW]
[ROW][C]26[/C][C]8.7[/C][C]8.31344305407665[/C][C]0.386556945923348[/C][/ROW]
[ROW][C]27[/C][C]8.7[/C][C]8.36073707755965[/C][C]0.339262922440346[/C][/ROW]
[ROW][C]28[/C][C]8.5[/C][C]8.21885500711065[/C][C]0.281144992889353[/C][/ROW]
[ROW][C]29[/C][C]8.5[/C][C]8.21885500711065[/C][C]0.281144992889353[/C][/ROW]
[ROW][C]30[/C][C]8.4[/C][C]8.21885500711065[/C][C]0.181144992889354[/C][/ROW]
[ROW][C]31[/C][C]8.2[/C][C]8.26614903059365[/C][C]-0.0661490305936497[/C][/ROW]
[ROW][C]32[/C][C]8.2[/C][C]8.31344305407665[/C][C]-0.113443054076652[/C][/ROW]
[ROW][C]33[/C][C]8.1[/C][C]8.59720719497466[/C][C]-0.497207194974665[/C][/ROW]
[ROW][C]34[/C][C]8.1[/C][C]8.64450121845767[/C][C]-0.544501218457667[/C][/ROW]
[ROW][C]35[/C][C]8[/C][C]8.50261914800866[/C][C]-0.50261914800866[/C][/ROW]
[ROW][C]36[/C][C]7.9[/C][C]8.50261914800866[/C][C]-0.60261914800866[/C][/ROW]
[ROW][C]37[/C][C]7.8[/C][C]8.54991317149166[/C][C]-0.749913171491662[/C][/ROW]
[ROW][C]38[/C][C]7.7[/C][C]8.54991317149166[/C][C]-0.849913171491662[/C][/ROW]
[ROW][C]39[/C][C]7.6[/C][C]8.50261914800866[/C][C]-0.90261914800866[/C][/ROW]
[ROW][C]40[/C][C]7.5[/C][C]8.50261914800866[/C][C]-1.00261914800866[/C][/ROW]
[ROW][C]41[/C][C]7.5[/C][C]8.50261914800866[/C][C]-1.00261914800866[/C][/ROW]
[ROW][C]42[/C][C]7.5[/C][C]8.50261914800866[/C][C]-1.00261914800866[/C][/ROW]
[ROW][C]43[/C][C]7.5[/C][C]8.54991317149166[/C][C]-1.04991317149166[/C][/ROW]
[ROW][C]44[/C][C]7.5[/C][C]8.59720719497466[/C][C]-1.09720719497466[/C][/ROW]
[ROW][C]45[/C][C]7.4[/C][C]8.40803110104266[/C][C]-1.00803110104266[/C][/ROW]
[ROW][C]46[/C][C]7.4[/C][C]8.17156098362764[/C][C]-0.771560983627644[/C][/ROW]
[ROW][C]47[/C][C]7.3[/C][C]7.93509086621263[/C][C]-0.635090866212634[/C][/ROW]
[ROW][C]48[/C][C]7.3[/C][C]7.93509086621263[/C][C]-0.635090866212634[/C][/ROW]
[ROW][C]49[/C][C]7.3[/C][C]7.88779684272963[/C][C]-0.587796842729631[/C][/ROW]
[ROW][C]50[/C][C]7.2[/C][C]7.84050281924663[/C][C]-0.640502819246629[/C][/ROW]
[ROW][C]51[/C][C]7.2[/C][C]7.69862074879762[/C][C]-0.498620748797622[/C][/ROW]
[ROW][C]52[/C][C]7.3[/C][C]7.84050281924663[/C][C]-0.540502819246629[/C][/ROW]
[ROW][C]53[/C][C]7.4[/C][C]7.65132672531462[/C][C]-0.251326725314619[/C][/ROW]
[ROW][C]54[/C][C]7.4[/C][C]7.50944465486561[/C][C]-0.109444654865613[/C][/ROW]
[ROW][C]55[/C][C]7.5[/C][C]7.50944465486561[/C][C]-0.00944465486561315[/C][/ROW]
[ROW][C]56[/C][C]7.6[/C][C]7.60403270183162[/C][C]-0.0040327018316181[/C][/ROW]
[ROW][C]57[/C][C]7.7[/C][C]7.69862074879762[/C][C]0.00137925120237802[/C][/ROW]
[ROW][C]58[/C][C]7.9[/C][C]7.88779684272963[/C][C]0.0122031572703693[/C][/ROW]
[ROW][C]59[/C][C]8[/C][C]8.40803110104266[/C][C]-0.408031101042656[/C][/ROW]
[ROW][C]60[/C][C]8.2[/C][C]8.64450121845767[/C][C]-0.444501218457667[/C][/ROW]
[/TABLE]
Source: https://freestatistics.org/blog/index.php?pk=60136&T=4

Globally Unique Identifier (entire table): ba.freestatistics.org/blog/index.php?pk=60136&T=4

As an alternative you can also use a QR Code:  

The GUIDs for individual cells are displayed in the table below:

Multiple Linear Regression - Actuals, Interpolation, and Residuals
Time or IndexActualsInterpolationForecastResidualsPrediction Error
18.98.50261914800870.397380851991294
298.644501218457670.355498781542334
398.597207194974660.402792805025335
498.455325124525660.544674875474342
598.218855007110650.781144992889353
698.266149030593650.733850969406351
798.313443054076650.686556945923349
898.313443054076650.686556945923349
998.408031101042660.591968898957344
1098.266149030593650.733850969406351
1198.360737077559650.639262922440347
129.18.266149030593650.83385096940635
1398.502619148008660.49738085199134
1498.408031101042660.591968898957344
159.18.408031101042660.691968898957344
1698.408031101042660.591968898957344
1798.455325124525660.544674875474342
1898.408031101042660.591968898957344
1998.360737077559650.639262922440347
208.98.360737077559650.539262922440347
218.98.171560983627640.728439016372356
228.98.218855007110650.681144992889354
238.98.313443054076650.586556945923349
248.88.360737077559650.439262922440347
258.88.266149030593650.533850969406352
268.78.313443054076650.386556945923348
278.78.360737077559650.339262922440346
288.58.218855007110650.281144992889353
298.58.218855007110650.281144992889353
308.48.218855007110650.181144992889354
318.28.26614903059365-0.0661490305936497
328.28.31344305407665-0.113443054076652
338.18.59720719497466-0.497207194974665
348.18.64450121845767-0.544501218457667
3588.50261914800866-0.50261914800866
367.98.50261914800866-0.60261914800866
377.88.54991317149166-0.749913171491662
387.78.54991317149166-0.849913171491662
397.68.50261914800866-0.90261914800866
407.58.50261914800866-1.00261914800866
417.58.50261914800866-1.00261914800866
427.58.50261914800866-1.00261914800866
437.58.54991317149166-1.04991317149166
447.58.59720719497466-1.09720719497466
457.48.40803110104266-1.00803110104266
467.48.17156098362764-0.771560983627644
477.37.93509086621263-0.635090866212634
487.37.93509086621263-0.635090866212634
497.37.88779684272963-0.587796842729631
507.27.84050281924663-0.640502819246629
517.27.69862074879762-0.498620748797622
527.37.84050281924663-0.540502819246629
537.47.65132672531462-0.251326725314619
547.47.50944465486561-0.109444654865613
557.57.50944465486561-0.00944465486561315
567.67.60403270183162-0.0040327018316181
577.77.698620748797620.00137925120237802
587.97.887796842729630.0122031572703693
5988.40803110104266-0.408031101042656
608.28.64450121845767-0.444501218457667


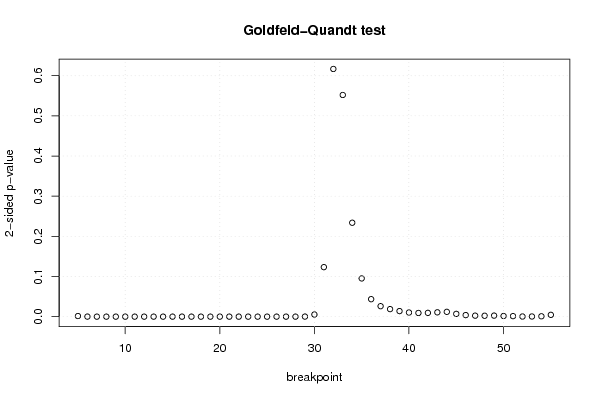
Goldfeld-Quandt test for Heteroskedasticity
p-valuesAlternative Hypothesis
breakpoint indexgreater2-sidedless
50.0007578995765892950.001515799153178590.99924210042341
65.48154011273894e-050.0001096308022547790.999945184598873
73.65997501458079e-067.31995002916159e-060.999996340024985
82.3021512987223e-074.6043025974446e-070.99999976978487
91.40367935983326e-082.80735871966651e-080.999999985963206
108.23592113884243e-101.64718422776849e-090.999999999176408
114.73273301894511e-119.46546603789021e-110.999999999952673
121.00998494466102e-102.01996988932204e-100.999999999899001
137.98259204079453e-121.59651840815891e-110.999999999992017
146.30363953199072e-131.26072790639814e-120.99999999999937
159.22790855053638e-131.84558171010728e-120.999999999999077
169.73763390151574e-141.94752678030315e-130.999999999999903
171.04334106269684e-142.08668212539367e-140.99999999999999
181.24760415456600e-152.49520830913200e-150.999999999999999
191.7539477491751e-163.5078954983502e-161
205.11781616206576e-161.02356323241315e-151
211.22529335474876e-152.45058670949753e-150.999999999999999
221.54652612553001e-153.09305225106003e-150.999999999999998
232.03165768310201e-154.06331536620402e-150.999999999999998
246.92821281494951e-141.38564256298990e-130.99999999999993
258.40182026105028e-131.68036405221006e-120.99999999999916
269.64661829547985e-111.92932365909597e-100.999999999903534
274.44974039352286e-098.89948078704571e-090.99999999555026
281.51872924364754e-063.03745848729509e-060.999998481270756
297.35501388822122e-050.0001471002777644240.999926449861118
300.002672430764329130.005344861528658260.99732756923567
310.06162983972931410.1232596794586280.938370160270686
320.3083995023398510.6167990046797030.691600497660149
330.724008429418450.5519831411630990.275991570581549
340.8830862676367220.2338274647265560.116913732363278
350.9523939244023250.09521215119535040.0476060755976752
360.9782500033015140.04349999339697150.0217499966984858
370.9869607904345430.02607841913091450.0130392095654573
380.9905840784186380.01883184316272300.00941592158136149
390.9930749859603360.01385002807932800.00692501403966398
400.9948714187526420.01025716249471520.00512858124735758
410.9953948515930160.009210296813967090.00460514840698354
420.9952946261515790.00941074769684230.00470537384842115
430.994604053917650.01079189216469960.00539594608234978
440.9939950863680380.01200982726392340.00600491363196171
450.9965343165303210.006931366939357510.00346568346967876
460.9980514244490780.00389715110184390.00194857555092195
470.998766646680190.002466706639617790.00123335331980889
480.9988765149052090.002246970189582560.00112348509479128
490.9987161055340150.002567788931969170.00128389446598459
500.999190156306970.001619687386058230.000809843693029114
510.9993407451562080.001318509687583050.000659254843791524
520.9998540008225550.0002919983548907910.000145999177445395
530.999797256150650.0004054876987013710.000202743849350686
540.9995630008349860.0008739983300277150.000436999165013857
550.9977369574562450.004526085087509920.00226304254375496

\begin{tabular}{lllllllll}
\hline
Goldfeld-Quandt test for Heteroskedasticity \tabularnewline
p-values & Alternative Hypothesis \tabularnewline
breakpoint index & greater & 2-sided & less \tabularnewline
5 & 0.000757899576589295 & 0.00151579915317859 & 0.99924210042341 \tabularnewline
6 & 5.48154011273894e-05 & 0.000109630802254779 & 0.999945184598873 \tabularnewline
7 & 3.65997501458079e-06 & 7.31995002916159e-06 & 0.999996340024985 \tabularnewline
8 & 2.3021512987223e-07 & 4.6043025974446e-07 & 0.99999976978487 \tabularnewline
9 & 1.40367935983326e-08 & 2.80735871966651e-08 & 0.999999985963206 \tabularnewline
10 & 8.23592113884243e-10 & 1.64718422776849e-09 & 0.999999999176408 \tabularnewline
11 & 4.73273301894511e-11 & 9.46546603789021e-11 & 0.999999999952673 \tabularnewline
12 & 1.00998494466102e-10 & 2.01996988932204e-10 & 0.999999999899001 \tabularnewline
13 & 7.98259204079453e-12 & 1.59651840815891e-11 & 0.999999999992017 \tabularnewline
14 & 6.30363953199072e-13 & 1.26072790639814e-12 & 0.99999999999937 \tabularnewline
15 & 9.22790855053638e-13 & 1.84558171010728e-12 & 0.999999999999077 \tabularnewline
16 & 9.73763390151574e-14 & 1.94752678030315e-13 & 0.999999999999903 \tabularnewline
17 & 1.04334106269684e-14 & 2.08668212539367e-14 & 0.99999999999999 \tabularnewline
18 & 1.24760415456600e-15 & 2.49520830913200e-15 & 0.999999999999999 \tabularnewline
19 & 1.7539477491751e-16 & 3.5078954983502e-16 & 1 \tabularnewline
20 & 5.11781616206576e-16 & 1.02356323241315e-15 & 1 \tabularnewline
21 & 1.22529335474876e-15 & 2.45058670949753e-15 & 0.999999999999999 \tabularnewline
22 & 1.54652612553001e-15 & 3.09305225106003e-15 & 0.999999999999998 \tabularnewline
23 & 2.03165768310201e-15 & 4.06331536620402e-15 & 0.999999999999998 \tabularnewline
24 & 6.92821281494951e-14 & 1.38564256298990e-13 & 0.99999999999993 \tabularnewline
25 & 8.40182026105028e-13 & 1.68036405221006e-12 & 0.99999999999916 \tabularnewline
26 & 9.64661829547985e-11 & 1.92932365909597e-10 & 0.999999999903534 \tabularnewline
27 & 4.44974039352286e-09 & 8.89948078704571e-09 & 0.99999999555026 \tabularnewline
28 & 1.51872924364754e-06 & 3.03745848729509e-06 & 0.999998481270756 \tabularnewline
29 & 7.35501388822122e-05 & 0.000147100277764424 & 0.999926449861118 \tabularnewline
30 & 0.00267243076432913 & 0.00534486152865826 & 0.99732756923567 \tabularnewline
31 & 0.0616298397293141 & 0.123259679458628 & 0.938370160270686 \tabularnewline
32 & 0.308399502339851 & 0.616799004679703 & 0.691600497660149 \tabularnewline
33 & 0.72400842941845 & 0.551983141163099 & 0.275991570581549 \tabularnewline
34 & 0.883086267636722 & 0.233827464726556 & 0.116913732363278 \tabularnewline
35 & 0.952393924402325 & 0.0952121511953504 & 0.0476060755976752 \tabularnewline
36 & 0.978250003301514 & 0.0434999933969715 & 0.0217499966984858 \tabularnewline
37 & 0.986960790434543 & 0.0260784191309145 & 0.0130392095654573 \tabularnewline
38 & 0.990584078418638 & 0.0188318431627230 & 0.00941592158136149 \tabularnewline
39 & 0.993074985960336 & 0.0138500280793280 & 0.00692501403966398 \tabularnewline
40 & 0.994871418752642 & 0.0102571624947152 & 0.00512858124735758 \tabularnewline
41 & 0.995394851593016 & 0.00921029681396709 & 0.00460514840698354 \tabularnewline
42 & 0.995294626151579 & 0.0094107476968423 & 0.00470537384842115 \tabularnewline
43 & 0.99460405391765 & 0.0107918921646996 & 0.00539594608234978 \tabularnewline
44 & 0.993995086368038 & 0.0120098272639234 & 0.00600491363196171 \tabularnewline
45 & 0.996534316530321 & 0.00693136693935751 & 0.00346568346967876 \tabularnewline
46 & 0.998051424449078 & 0.0038971511018439 & 0.00194857555092195 \tabularnewline
47 & 0.99876664668019 & 0.00246670663961779 & 0.00123335331980889 \tabularnewline
48 & 0.998876514905209 & 0.00224697018958256 & 0.00112348509479128 \tabularnewline
49 & 0.998716105534015 & 0.00256778893196917 & 0.00128389446598459 \tabularnewline
50 & 0.99919015630697 & 0.00161968738605823 & 0.000809843693029114 \tabularnewline
51 & 0.999340745156208 & 0.00131850968758305 & 0.000659254843791524 \tabularnewline
52 & 0.999854000822555 & 0.000291998354890791 & 0.000145999177445395 \tabularnewline
53 & 0.99979725615065 & 0.000405487698701371 & 0.000202743849350686 \tabularnewline
54 & 0.999563000834986 & 0.000873998330027715 & 0.000436999165013857 \tabularnewline
55 & 0.997736957456245 & 0.00452608508750992 & 0.00226304254375496 \tabularnewline
\hline
\end{tabular}
%Source: https://freestatistics.org/blog/index.php?pk=60136&T=5

[TABLE]
[ROW][C]Goldfeld-Quandt test for Heteroskedasticity[/C][/ROW]
[ROW][C]p-values[/C][C]Alternative Hypothesis[/C][/ROW]
[ROW][C]breakpoint index[/C][C]greater[/C][C]2-sided[/C][C]less[/C][/ROW]
[ROW][C]5[/C][C]0.000757899576589295[/C][C]0.00151579915317859[/C][C]0.99924210042341[/C][/ROW]
[ROW][C]6[/C][C]5.48154011273894e-05[/C][C]0.000109630802254779[/C][C]0.999945184598873[/C][/ROW]
[ROW][C]7[/C][C]3.65997501458079e-06[/C][C]7.31995002916159e-06[/C][C]0.999996340024985[/C][/ROW]
[ROW][C]8[/C][C]2.3021512987223e-07[/C][C]4.6043025974446e-07[/C][C]0.99999976978487[/C][/ROW]
[ROW][C]9[/C][C]1.40367935983326e-08[/C][C]2.80735871966651e-08[/C][C]0.999999985963206[/C][/ROW]
[ROW][C]10[/C][C]8.23592113884243e-10[/C][C]1.64718422776849e-09[/C][C]0.999999999176408[/C][/ROW]
[ROW][C]11[/C][C]4.73273301894511e-11[/C][C]9.46546603789021e-11[/C][C]0.999999999952673[/C][/ROW]
[ROW][C]12[/C][C]1.00998494466102e-10[/C][C]2.01996988932204e-10[/C][C]0.999999999899001[/C][/ROW]
[ROW][C]13[/C][C]7.98259204079453e-12[/C][C]1.59651840815891e-11[/C][C]0.999999999992017[/C][/ROW]
[ROW][C]14[/C][C]6.30363953199072e-13[/C][C]1.26072790639814e-12[/C][C]0.99999999999937[/C][/ROW]
[ROW][C]15[/C][C]9.22790855053638e-13[/C][C]1.84558171010728e-12[/C][C]0.999999999999077[/C][/ROW]
[ROW][C]16[/C][C]9.73763390151574e-14[/C][C]1.94752678030315e-13[/C][C]0.999999999999903[/C][/ROW]
[ROW][C]17[/C][C]1.04334106269684e-14[/C][C]2.08668212539367e-14[/C][C]0.99999999999999[/C][/ROW]
[ROW][C]18[/C][C]1.24760415456600e-15[/C][C]2.49520830913200e-15[/C][C]0.999999999999999[/C][/ROW]
[ROW][C]19[/C][C]1.7539477491751e-16[/C][C]3.5078954983502e-16[/C][C]1[/C][/ROW]
[ROW][C]20[/C][C]5.11781616206576e-16[/C][C]1.02356323241315e-15[/C][C]1[/C][/ROW]
[ROW][C]21[/C][C]1.22529335474876e-15[/C][C]2.45058670949753e-15[/C][C]0.999999999999999[/C][/ROW]
[ROW][C]22[/C][C]1.54652612553001e-15[/C][C]3.09305225106003e-15[/C][C]0.999999999999998[/C][/ROW]
[ROW][C]23[/C][C]2.03165768310201e-15[/C][C]4.06331536620402e-15[/C][C]0.999999999999998[/C][/ROW]
[ROW][C]24[/C][C]6.92821281494951e-14[/C][C]1.38564256298990e-13[/C][C]0.99999999999993[/C][/ROW]
[ROW][C]25[/C][C]8.40182026105028e-13[/C][C]1.68036405221006e-12[/C][C]0.99999999999916[/C][/ROW]
[ROW][C]26[/C][C]9.64661829547985e-11[/C][C]1.92932365909597e-10[/C][C]0.999999999903534[/C][/ROW]
[ROW][C]27[/C][C]4.44974039352286e-09[/C][C]8.89948078704571e-09[/C][C]0.99999999555026[/C][/ROW]
[ROW][C]28[/C][C]1.51872924364754e-06[/C][C]3.03745848729509e-06[/C][C]0.999998481270756[/C][/ROW]
[ROW][C]29[/C][C]7.35501388822122e-05[/C][C]0.000147100277764424[/C][C]0.999926449861118[/C][/ROW]
[ROW][C]30[/C][C]0.00267243076432913[/C][C]0.00534486152865826[/C][C]0.99732756923567[/C][/ROW]
[ROW][C]31[/C][C]0.0616298397293141[/C][C]0.123259679458628[/C][C]0.938370160270686[/C][/ROW]
[ROW][C]32[/C][C]0.308399502339851[/C][C]0.616799004679703[/C][C]0.691600497660149[/C][/ROW]
[ROW][C]33[/C][C]0.72400842941845[/C][C]0.551983141163099[/C][C]0.275991570581549[/C][/ROW]
[ROW][C]34[/C][C]0.883086267636722[/C][C]0.233827464726556[/C][C]0.116913732363278[/C][/ROW]
[ROW][C]35[/C][C]0.952393924402325[/C][C]0.0952121511953504[/C][C]0.0476060755976752[/C][/ROW]
[ROW][C]36[/C][C]0.978250003301514[/C][C]0.0434999933969715[/C][C]0.0217499966984858[/C][/ROW]
[ROW][C]37[/C][C]0.986960790434543[/C][C]0.0260784191309145[/C][C]0.0130392095654573[/C][/ROW]
[ROW][C]38[/C][C]0.990584078418638[/C][C]0.0188318431627230[/C][C]0.00941592158136149[/C][/ROW]
[ROW][C]39[/C][C]0.993074985960336[/C][C]0.0138500280793280[/C][C]0.00692501403966398[/C][/ROW]
[ROW][C]40[/C][C]0.994871418752642[/C][C]0.0102571624947152[/C][C]0.00512858124735758[/C][/ROW]
[ROW][C]41[/C][C]0.995394851593016[/C][C]0.00921029681396709[/C][C]0.00460514840698354[/C][/ROW]
[ROW][C]42[/C][C]0.995294626151579[/C][C]0.0094107476968423[/C][C]0.00470537384842115[/C][/ROW]
[ROW][C]43[/C][C]0.99460405391765[/C][C]0.0107918921646996[/C][C]0.00539594608234978[/C][/ROW]
[ROW][C]44[/C][C]0.993995086368038[/C][C]0.0120098272639234[/C][C]0.00600491363196171[/C][/ROW]
[ROW][C]45[/C][C]0.996534316530321[/C][C]0.00693136693935751[/C][C]0.00346568346967876[/C][/ROW]
[ROW][C]46[/C][C]0.998051424449078[/C][C]0.0038971511018439[/C][C]0.00194857555092195[/C][/ROW]
[ROW][C]47[/C][C]0.99876664668019[/C][C]0.00246670663961779[/C][C]0.00123335331980889[/C][/ROW]
[ROW][C]48[/C][C]0.998876514905209[/C][C]0.00224697018958256[/C][C]0.00112348509479128[/C][/ROW]
[ROW][C]49[/C][C]0.998716105534015[/C][C]0.00256778893196917[/C][C]0.00128389446598459[/C][/ROW]
[ROW][C]50[/C][C]0.99919015630697[/C][C]0.00161968738605823[/C][C]0.000809843693029114[/C][/ROW]
[ROW][C]51[/C][C]0.999340745156208[/C][C]0.00131850968758305[/C][C]0.000659254843791524[/C][/ROW]
[ROW][C]52[/C][C]0.999854000822555[/C][C]0.000291998354890791[/C][C]0.000145999177445395[/C][/ROW]
[ROW][C]53[/C][C]0.99979725615065[/C][C]0.000405487698701371[/C][C]0.000202743849350686[/C][/ROW]
[ROW][C]54[/C][C]0.999563000834986[/C][C]0.000873998330027715[/C][C]0.000436999165013857[/C][/ROW]
[ROW][C]55[/C][C]0.997736957456245[/C][C]0.00452608508750992[/C][C]0.00226304254375496[/C][/ROW]
[/TABLE]
Source: https://freestatistics.org/blog/index.php?pk=60136&T=5

Globally Unique Identifier (entire table): ba.freestatistics.org/blog/index.php?pk=60136&T=5

As an alternative you can also use a QR Code:  

The GUIDs for individual cells are displayed in the table below:

Goldfeld-Quandt test for Heteroskedasticity
p-valuesAlternative Hypothesis
breakpoint indexgreater2-sidedless
50.0007578995765892950.001515799153178590.99924210042341
65.48154011273894e-050.0001096308022547790.999945184598873
73.65997501458079e-067.31995002916159e-060.999996340024985
82.3021512987223e-074.6043025974446e-070.99999976978487
91.40367935983326e-082.80735871966651e-080.999999985963206
108.23592113884243e-101.64718422776849e-090.999999999176408
114.73273301894511e-119.46546603789021e-110.999999999952673
121.00998494466102e-102.01996988932204e-100.999999999899001
137.98259204079453e-121.59651840815891e-110.999999999992017
146.30363953199072e-131.26072790639814e-120.99999999999937
159.22790855053638e-131.84558171010728e-120.999999999999077
169.73763390151574e-141.94752678030315e-130.999999999999903
171.04334106269684e-142.08668212539367e-140.99999999999999
181.24760415456600e-152.49520830913200e-150.999999999999999
191.7539477491751e-163.5078954983502e-161
205.11781616206576e-161.02356323241315e-151
211.22529335474876e-152.45058670949753e-150.999999999999999
221.54652612553001e-153.09305225106003e-150.999999999999998
232.03165768310201e-154.06331536620402e-150.999999999999998
246.92821281494951e-141.38564256298990e-130.99999999999993
258.40182026105028e-131.68036405221006e-120.99999999999916
269.64661829547985e-111.92932365909597e-100.999999999903534
274.44974039352286e-098.89948078704571e-090.99999999555026
281.51872924364754e-063.03745848729509e-060.999998481270756
297.35501388822122e-050.0001471002777644240.999926449861118
300.002672430764329130.005344861528658260.99732756923567
310.06162983972931410.1232596794586280.938370160270686
320.3083995023398510.6167990046797030.691600497660149
330.724008429418450.5519831411630990.275991570581549
340.8830862676367220.2338274647265560.116913732363278
350.9523939244023250.09521215119535040.0476060755976752
360.9782500033015140.04349999339697150.0217499966984858
370.9869607904345430.02607841913091450.0130392095654573
380.9905840784186380.01883184316272300.00941592158136149
390.9930749859603360.01385002807932800.00692501403966398
400.9948714187526420.01025716249471520.00512858124735758
410.9953948515930160.009210296813967090.00460514840698354
420.9952946261515790.00941074769684230.00470537384842115
430.994604053917650.01079189216469960.00539594608234978
440.9939950863680380.01200982726392340.00600491363196171
450.9965343165303210.006931366939357510.00346568346967876
460.9980514244490780.00389715110184390.00194857555092195
470.998766646680190.002466706639617790.00123335331980889
480.9988765149052090.002246970189582560.00112348509479128
490.9987161055340150.002567788931969170.00128389446598459
500.999190156306970.001619687386058230.000809843693029114
510.9993407451562080.001318509687583050.000659254843791524
520.9998540008225550.0002919983548907910.000145999177445395
530.999797256150650.0004054876987013710.000202743849350686
540.9995630008349860.0008739983300277150.000436999165013857
550.9977369574562450.004526085087509920.00226304254375496


Meta Analysis of Goldfeld-Quandt test for Heteroskedasticity
Description# significant tests% significant testsOK/NOK
1% type I error level390.764705882352941NOK
5% type I error level460.901960784313726NOK
10% type I error level470.92156862745098NOK

\begin{tabular}{lllllllll}
\hline
Meta Analysis of Goldfeld-Quandt test for Heteroskedasticity \tabularnewline
Description & # significant tests & % significant tests & OK/NOK \tabularnewline
1% type I error level & 39 & 0.764705882352941 & NOK \tabularnewline
5% type I error level & 46 & 0.901960784313726 & NOK \tabularnewline
10% type I error level & 47 & 0.92156862745098 & NOK \tabularnewline
\hline
\end{tabular}
%Source: https://freestatistics.org/blog/index.php?pk=60136&T=6

[TABLE]
[ROW][C]Meta Analysis of Goldfeld-Quandt test for Heteroskedasticity[/C][/ROW]
[ROW][C]Description[/C][C]# significant tests[/C][C]% significant tests[/C][C]OK/NOK[/C][/ROW]
[ROW][C]1% type I error level[/C][C]39[/C][C]0.764705882352941[/C][C]NOK[/C][/ROW]
[ROW][C]5% type I error level[/C][C]46[/C][C]0.901960784313726[/C][C]NOK[/C][/ROW]
[ROW][C]10% type I error level[/C][C]47[/C][C]0.92156862745098[/C][C]NOK[/C][/ROW]
[/TABLE]
Source: https://freestatistics.org/blog/index.php?pk=60136&T=6

Globally Unique Identifier (entire table): ba.freestatistics.org/blog/index.php?pk=60136&T=6

As an alternative you can also use a QR Code:  

The GUIDs for individual cells are displayed in the table below:

Meta Analysis of Goldfeld-Quandt test for Heteroskedasticity
Description# significant tests% significant testsOK/NOK
1% type I error level390.764705882352941NOK
5% type I error level460.901960784313726NOK
10% type I error level470.92156862745098NOK


Parameters (Session):
par1 = 1 ; par2 = Do not include Seasonal Dummies ; par3 = No Linear Trend ;
Parameters (R input):
par1 = 1 ; par2 = Do not include Seasonal Dummies ; par3 = No Linear Trend ;
R code (references can be found in the software module):
library(lattice)
library(lmtest)
n25 <- 25 #minimum number of obs. for Goldfeld-Quandt test
par1 <- as.numeric(par1)
x <- t(y)
k <- length(x[1,])
n <- length(x[,1])
x1 <- cbind(x[,par1], x[,1:k!=par1])
mycolnames <- c(colnames(x)[par1], colnames(x)[1:k!=par1])
colnames(x1) <- mycolnames #colnames(x)[par1]
x <- x1
if (par3 == 'First Differences'){
x2 <- array(0, dim=c(n-1,k), dimnames=list(1:(n-1), paste('(1-B)',colnames(x),sep='')))
for (i in 1:n-1) {
for (j in 1:k) {
x2[i,j] <- x[i+1,j] - x[i,j]
}
}
x <- x2
}
if (par2 == 'Include Monthly Dummies'){
x2 <- array(0, dim=c(n,11), dimnames=list(1:n, paste('M', seq(1:11), sep ='')))
for (i in 1:11){
x2[seq(i,n,12),i] <- 1
}
x <- cbind(x, x2)
}
if (par2 == 'Include Quarterly Dummies'){
x2 <- array(0, dim=c(n,3), dimnames=list(1:n, paste('Q', seq(1:3), sep ='')))
for (i in 1:3){
x2[seq(i,n,4),i] <- 1
}
x <- cbind(x, x2)
}
k <- length(x[1,])
if (par3 == 'Linear Trend'){
x <- cbind(x, c(1:n))
colnames(x)[k+1] <- 't'
}
x
k <- length(x[1,])
df <- as.data.frame(x)
(mylm <- lm(df))
(mysum <- summary(mylm))
if (n > n25) {
kp3 <- k + 3
nmkm3 <- n - k - 3
gqarr <- array(NA, dim=c(nmkm3-kp3+1,3))
numgqtests <- 0
numsignificant1 <- 0
numsignificant5 <- 0
numsignificant10 <- 0
for (mypoint in kp3:nmkm3) {
j <- 0
numgqtests <- numgqtests + 1
for (myalt in c('greater', 'two.sided', 'less')) {
j <- j + 1
gqarr[mypoint-kp3+1,j] <- gqtest(mylm, point=mypoint, alternative=myalt)$p.value
}
if (gqarr[mypoint-kp3+1,2] < 0.01) numsignificant1 <- numsignificant1 + 1
if (gqarr[mypoint-kp3+1,2] < 0.05) numsignificant5 <- numsignificant5 + 1
if (gqarr[mypoint-kp3+1,2] < 0.10) numsignificant10 <- numsignificant10 + 1
}
gqarr
}
bitmap(file='test0.png')
plot(x[,1], type='l', main='Actuals and Interpolation', ylab='value of Actuals and Interpolation (dots)', xlab='time or index')
points(x[,1]-mysum$resid)
grid()
dev.off()
bitmap(file='test1.png')
plot(mysum$resid, type='b', pch=19, main='Residuals', ylab='value of Residuals', xlab='time or index')
grid()
dev.off()
bitmap(file='test2.png')
hist(mysum$resid, main='Residual Histogram', xlab='values of Residuals')
grid()
dev.off()
bitmap(file='test3.png')
densityplot(~mysum$resid,col='black',main='Residual Density Plot', xlab='values of Residuals')
dev.off()
bitmap(file='test4.png')
qqnorm(mysum$resid, main='Residual Normal Q-Q Plot')
qqline(mysum$resid)
grid()
dev.off()
(myerror <- as.ts(mysum$resid))
bitmap(file='test5.png')
dum <- cbind(lag(myerror,k=1),myerror)
dum
dum1 <- dum[2:length(myerror),]
dum1
z <- as.data.frame(dum1)
z
plot(z,main=paste('Residual Lag plot, lowess, and regression line'), ylab='values of Residuals', xlab='lagged values of Residuals')
lines(lowess(z))
abline(lm(z))
grid()
dev.off()
bitmap(file='test6.png')
acf(mysum$resid, lag.max=length(mysum$resid)/2, main='Residual Autocorrelation Function')
grid()
dev.off()
bitmap(file='test7.png')
pacf(mysum$resid, lag.max=length(mysum$resid)/2, main='Residual Partial Autocorrelation Function')
grid()
dev.off()
bitmap(file='test8.png')
opar <- par(mfrow = c(2,2), oma = c(0, 0, 1.1, 0))
plot(mylm, las = 1, sub='Residual Diagnostics')
par(opar)
dev.off()
if (n > n25) {
bitmap(file='test9.png')
plot(kp3:nmkm3,gqarr[,2], main='Goldfeld-Quandt test',ylab='2-sided p-value',xlab='breakpoint')
grid()
dev.off()
}
load(file='createtable')
a<-table.start()
a<-table.row.start(a)
a<-table.element(a, 'Multiple Linear Regression - Estimated Regression Equation', 1, TRUE)
a<-table.row.end(a)
myeq <- colnames(x)[1]
myeq <- paste(myeq, '[t] = ', sep='')
for (i in 1:k){
if (mysum$coefficients[i,1] > 0) myeq <- paste(myeq, '+', '')
myeq <- paste(myeq, mysum$coefficients[i,1], sep=' ')
if (rownames(mysum$coefficients)[i] != '(Intercept)') {
myeq <- paste(myeq, rownames(mysum$coefficients)[i], sep='')
if (rownames(mysum$coefficients)[i] != 't') myeq <- paste(myeq, '[t]', sep='')
}
}
myeq <- paste(myeq, ' + e[t]')
a<-table.row.start(a)
a<-table.element(a, myeq)
a<-table.row.end(a)
a<-table.end(a)
table.save(a,file='mytable1.tab')
a<-table.start()
a<-table.row.start(a)
a<-table.element(a,hyperlink('ols1.htm','Multiple Linear Regression - Ordinary Least Squares',''), 6, TRUE)
a<-table.row.end(a)
a<-table.row.start(a)
a<-table.element(a,'Variable',header=TRUE)
a<-table.element(a,'Parameter',header=TRUE)
a<-table.element(a,'S.D.',header=TRUE)
a<-table.element(a,'T-STAT
H0: parameter = 0',header=TRUE)
a<-table.element(a,'2-tail p-value',header=TRUE)
a<-table.element(a,'1-tail p-value',header=TRUE)
a<-table.row.end(a)
for (i in 1:k){
a<-table.row.start(a)
a<-table.element(a,rownames(mysum$coefficients)[i],header=TRUE)
a<-table.element(a,mysum$coefficients[i,1])
a<-table.element(a, round(mysum$coefficients[i,2],6))
a<-table.element(a, round(mysum$coefficients[i,3],4))
a<-table.element(a, round(mysum$coefficients[i,4],6))
a<-table.element(a, round(mysum$coefficients[i,4]/2,6))
a<-table.row.end(a)
}
a<-table.end(a)
table.save(a,file='mytable2.tab')
a<-table.start()
a<-table.row.start(a)
a<-table.element(a, 'Multiple Linear Regression - Regression Statistics', 2, TRUE)
a<-table.row.end(a)
a<-table.row.start(a)
a<-table.element(a, 'Multiple R',1,TRUE)
a<-table.element(a, sqrt(mysum$r.squared))
a<-table.row.end(a)
a<-table.row.start(a)
a<-table.element(a, 'R-squared',1,TRUE)
a<-table.element(a, mysum$r.squared)
a<-table.row.end(a)
a<-table.row.start(a)
a<-table.element(a, 'Adjusted R-squared',1,TRUE)
a<-table.element(a, mysum$adj.r.squared)
a<-table.row.end(a)
a<-table.row.start(a)
a<-table.element(a, 'F-TEST (value)',1,TRUE)
a<-table.element(a, mysum$fstatistic[1])
a<-table.row.end(a)
a<-table.row.start(a)
a<-table.element(a, 'F-TEST (DF numerator)',1,TRUE)
a<-table.element(a, mysum$fstatistic[2])
a<-table.row.end(a)
a<-table.row.start(a)
a<-table.element(a, 'F-TEST (DF denominator)',1,TRUE)
a<-table.element(a, mysum$fstatistic[3])
a<-table.row.end(a)
a<-table.row.start(a)
a<-table.element(a, 'p-value',1,TRUE)
a<-table.element(a, 1-pf(mysum$fstatistic[1],mysum$fstatistic[2],mysum$fstatistic[3]))
a<-table.row.end(a)
a<-table.row.start(a)
a<-table.element(a, 'Multiple Linear Regression - Residual Statistics', 2, TRUE)
a<-table.row.end(a)
a<-table.row.start(a)
a<-table.element(a, 'Residual Standard Deviation',1,TRUE)
a<-table.element(a, mysum$sigma)
a<-table.row.end(a)
a<-table.row.start(a)
a<-table.element(a, 'Sum Squared Residuals',1,TRUE)
a<-table.element(a, sum(myerror*myerror))
a<-table.row.end(a)
a<-table.end(a)
table.save(a,file='mytable3.tab')
a<-table.start()
a<-table.row.start(a)
a<-table.element(a, 'Multiple Linear Regression - Actuals, Interpolation, and Residuals', 4, TRUE)
a<-table.row.end(a)
a<-table.row.start(a)
a<-table.element(a, 'Time or Index', 1, TRUE)
a<-table.element(a, 'Actuals', 1, TRUE)
a<-table.element(a, 'Interpolation
Forecast', 1, TRUE)
a<-table.element(a, 'Residuals
Prediction Error', 1, TRUE)
a<-table.row.end(a)
for (i in 1:n) {
a<-table.row.start(a)
a<-table.element(a,i, 1, TRUE)
a<-table.element(a,x[i])
a<-table.element(a,x[i]-mysum$resid[i])
a<-table.element(a,mysum$resid[i])
a<-table.row.end(a)
}
a<-table.end(a)
table.save(a,file='mytable4.tab')
if (n > n25) {
a<-table.start()
a<-table.row.start(a)
a<-table.element(a,'Goldfeld-Quandt test for Heteroskedasticity',4,TRUE)
a<-table.row.end(a)
a<-table.row.start(a)
a<-table.element(a,'p-values',header=TRUE)
a<-table.element(a,'Alternative Hypothesis',3,header=TRUE)
a<-table.row.end(a)
a<-table.row.start(a)
a<-table.element(a,'breakpoint index',header=TRUE)
a<-table.element(a,'greater',header=TRUE)
a<-table.element(a,'2-sided',header=TRUE)
a<-table.element(a,'less',header=TRUE)
a<-table.row.end(a)
for (mypoint in kp3:nmkm3) {
a<-table.row.start(a)
a<-table.element(a,mypoint,header=TRUE)
a<-table.element(a,gqarr[mypoint-kp3+1,1])
a<-table.element(a,gqarr[mypoint-kp3+1,2])
a<-table.element(a,gqarr[mypoint-kp3+1,3])
a<-table.row.end(a)
}
a<-table.end(a)
table.save(a,file='mytable5.tab')
a<-table.start()
a<-table.row.start(a)
a<-table.element(a,'Meta Analysis of Goldfeld-Quandt test for Heteroskedasticity',4,TRUE)
a<-table.row.end(a)
a<-table.row.start(a)
a<-table.element(a,'Description',header=TRUE)
a<-table.element(a,'# significant tests',header=TRUE)
a<-table.element(a,'% significant tests',header=TRUE)
a<-table.element(a,'OK/NOK',header=TRUE)
a<-table.row.end(a)
a<-table.row.start(a)
a<-table.element(a,'1% type I error level',header=TRUE)
a<-table.element(a,numsignificant1)
a<-table.element(a,numsignificant1/numgqtests)
if (numsignificant1/numgqtests < 0.01) dum <- 'OK' else dum <- 'NOK'
a<-table.element(a,dum)
a<-table.row.end(a)
a<-table.row.start(a)
a<-table.element(a,'5% type I error level',header=TRUE)
a<-table.element(a,numsignificant5)
a<-table.element(a,numsignificant5/numgqtests)
if (numsignificant5/numgqtests < 0.05) dum <- 'OK' else dum <- 'NOK'
a<-table.element(a,dum)
a<-table.row.end(a)
a<-table.row.start(a)
a<-table.element(a,'10% type I error level',header=TRUE)
a<-table.element(a,numsignificant10)
a<-table.element(a,numsignificant10/numgqtests)
if (numsignificant10/numgqtests < 0.1) dum <- 'OK' else dum <- 'NOK'
a<-table.element(a,dum)
a<-table.row.end(a)
a<-table.end(a)
table.save(a,file='mytable6.tab')
}