Free Statistics

of Irreproducible Research!

Author's title

Author*The author of this computation has been verified*
R Software Modulerwasp_autocorrelation.wasp
Title produced by software(Partial) Autocorrelation Function
Date of computationThu, 26 Nov 2009 15:47:12 -0700
Cite this page as followsStatistical Computations at FreeStatistics.org, Office for Research Development and Education, URL https://freestatistics.org/blog/index.php?v=date/2009/Nov/26/t1259275695200hb16yoqjgtls.htm/, Retrieved Sun, 28 Apr 2024 22:36:36 +0000
Statistical Computations at FreeStatistics.org, Office for Research Development and Education, URL https://freestatistics.org/blog/index.php?pk=60444, Retrieved Sun, 28 Apr 2024 22:36:36 +0000
QR Codes:

Original text written by user:
IsPrivate?No (this computation is public)
User-defined keywords
Estimated Impact96
Family? (F = Feedback message, R = changed R code, M = changed R Module, P = changed Parameters, D = changed Data)
-       [(Partial) Autocorrelation Function] [ACF 3] [2009-11-26 22:47:12] [e458b4e05bf28a297f8af8d9f96e59d6] [Current]
Feedback Forum

Post a new message
Dataseries X:
96.2
96.8
109.9
88
91.1
106.4
68.6
100.1
108
106
108.6
91.5
99.2
98
96.6
102.8
96.9
110
70.5
101.9
109.6
107.8
113
93.8
108
102.8
116.3
89.2
106.7
112.1
74.2
108.8
111.5
118.8
118.9
97.6
116.4
107.9
121.2
97.9
113.4
117.6
79.6
115.9
115.7
129.1
123.3
96.7
121.2
118.2
102.1
125.4
116.7
121.3
85.3
114.2
124.4
131
118.3
99.6


Summary of computational transaction
Raw Inputview raw input (R code)
Raw Outputview raw output of R engine
Computing time1 seconds
R Server'Gwilym Jenkins' @ 72.249.127.135

\begin{tabular}{lllllllll}
\hline
Summary of computational transaction \tabularnewline
Raw Input & view raw input (R code)  \tabularnewline
Raw Output & view raw output of R engine  \tabularnewline
Computing time & 1 seconds \tabularnewline
R Server & 'Gwilym Jenkins' @ 72.249.127.135 \tabularnewline
\hline
\end{tabular}
%Source: https://freestatistics.org/blog/index.php?pk=60444&T=0

[TABLE]
[ROW][C]Summary of computational transaction[/C][/ROW]
[ROW][C]Raw Input[/C][C]view raw input (R code) [/C][/ROW]
[ROW][C]Raw Output[/C][C]view raw output of R engine [/C][/ROW]
[ROW][C]Computing time[/C][C]1 seconds[/C][/ROW]
[ROW][C]R Server[/C][C]'Gwilym Jenkins' @ 72.249.127.135[/C][/ROW]
[/TABLE]
Source: https://freestatistics.org/blog/index.php?pk=60444&T=0

Globally Unique Identifier (entire table): ba.freestatistics.org/blog/index.php?pk=60444&T=0

As an alternative you can also use a QR Code:  

The GUIDs for individual cells are displayed in the table below:

Summary of computational transaction
Raw Inputview raw input (R code)
Raw Outputview raw output of R engine
Computing time1 seconds
R Server'Gwilym Jenkins' @ 72.249.127.135


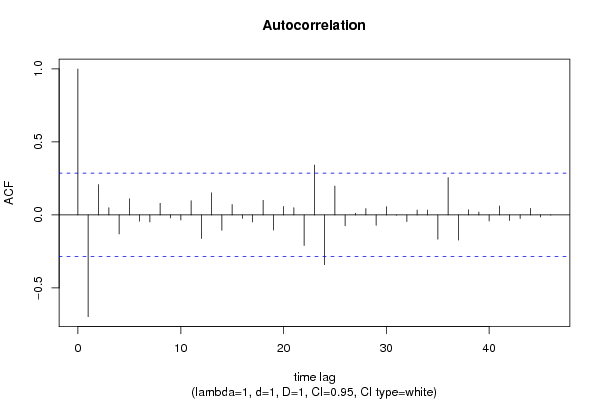
Autocorrelation Function
Time lag kACF(k)T-STATP-value
1-0.696595-4.77569e-06
20.2079941.42590.080248
30.0495840.33990.367713
4-0.129831-0.89010.188979
50.1108740.76010.225491
6-0.042897-0.29410.384993
7-0.047601-0.32630.372809
80.0799210.54790.293173
9-0.020553-0.14090.444275
10-0.035021-0.24010.405651
110.097370.66750.253848
12-0.161893-1.10990.136348
130.1513651.03770.152359
14-0.104907-0.71920.237788
150.0711810.4880.313911
16-0.022803-0.15630.438221
17-0.047804-0.32770.372286
180.1001120.68630.247938
19-0.103431-0.70910.240886
200.0580540.3980.346218
210.0501490.34380.366262
22-0.209157-1.43390.07911
230.3420262.34480.011656
24-0.340388-2.33360.011973
250.1979751.35720.090592
26-0.07452-0.51090.305911
270.0122720.08410.466653
280.0441390.30260.381765
29-0.071387-0.48940.313416
300.0563340.38620.350543
31-0.001883-0.01290.494877
32-0.045532-0.31220.378154
330.0332010.22760.410466
340.0333660.22870.410031
35-0.165938-1.13760.130524
360.2563141.75720.042698
37-0.172312-1.18130.121711
380.0353780.24250.404709
390.0199830.1370.44581
40-0.041148-0.28210.389555
410.0618350.42390.33678
42-0.038248-0.26220.397151
43-0.024941-0.1710.432483
440.0450460.30880.379412
45-0.013766-0.09440.462605
46-0.001914-0.01310.494792
47NANANA
48NANANA
49NANANA
50NANANA
51NANANA
52NANANA
53NANANA
54NANANA
55NANANA
56NANANA
57NANANA
58NANANA
59NANANA
60NANANA

\begin{tabular}{lllllllll}
\hline
Autocorrelation Function \tabularnewline
Time lag k & ACF(k) & T-STAT & P-value \tabularnewline
1 & -0.696595 & -4.7756 & 9e-06 \tabularnewline
2 & 0.207994 & 1.4259 & 0.080248 \tabularnewline
3 & 0.049584 & 0.3399 & 0.367713 \tabularnewline
4 & -0.129831 & -0.8901 & 0.188979 \tabularnewline
5 & 0.110874 & 0.7601 & 0.225491 \tabularnewline
6 & -0.042897 & -0.2941 & 0.384993 \tabularnewline
7 & -0.047601 & -0.3263 & 0.372809 \tabularnewline
8 & 0.079921 & 0.5479 & 0.293173 \tabularnewline
9 & -0.020553 & -0.1409 & 0.444275 \tabularnewline
10 & -0.035021 & -0.2401 & 0.405651 \tabularnewline
11 & 0.09737 & 0.6675 & 0.253848 \tabularnewline
12 & -0.161893 & -1.1099 & 0.136348 \tabularnewline
13 & 0.151365 & 1.0377 & 0.152359 \tabularnewline
14 & -0.104907 & -0.7192 & 0.237788 \tabularnewline
15 & 0.071181 & 0.488 & 0.313911 \tabularnewline
16 & -0.022803 & -0.1563 & 0.438221 \tabularnewline
17 & -0.047804 & -0.3277 & 0.372286 \tabularnewline
18 & 0.100112 & 0.6863 & 0.247938 \tabularnewline
19 & -0.103431 & -0.7091 & 0.240886 \tabularnewline
20 & 0.058054 & 0.398 & 0.346218 \tabularnewline
21 & 0.050149 & 0.3438 & 0.366262 \tabularnewline
22 & -0.209157 & -1.4339 & 0.07911 \tabularnewline
23 & 0.342026 & 2.3448 & 0.011656 \tabularnewline
24 & -0.340388 & -2.3336 & 0.011973 \tabularnewline
25 & 0.197975 & 1.3572 & 0.090592 \tabularnewline
26 & -0.07452 & -0.5109 & 0.305911 \tabularnewline
27 & 0.012272 & 0.0841 & 0.466653 \tabularnewline
28 & 0.044139 & 0.3026 & 0.381765 \tabularnewline
29 & -0.071387 & -0.4894 & 0.313416 \tabularnewline
30 & 0.056334 & 0.3862 & 0.350543 \tabularnewline
31 & -0.001883 & -0.0129 & 0.494877 \tabularnewline
32 & -0.045532 & -0.3122 & 0.378154 \tabularnewline
33 & 0.033201 & 0.2276 & 0.410466 \tabularnewline
34 & 0.033366 & 0.2287 & 0.410031 \tabularnewline
35 & -0.165938 & -1.1376 & 0.130524 \tabularnewline
36 & 0.256314 & 1.7572 & 0.042698 \tabularnewline
37 & -0.172312 & -1.1813 & 0.121711 \tabularnewline
38 & 0.035378 & 0.2425 & 0.404709 \tabularnewline
39 & 0.019983 & 0.137 & 0.44581 \tabularnewline
40 & -0.041148 & -0.2821 & 0.389555 \tabularnewline
41 & 0.061835 & 0.4239 & 0.33678 \tabularnewline
42 & -0.038248 & -0.2622 & 0.397151 \tabularnewline
43 & -0.024941 & -0.171 & 0.432483 \tabularnewline
44 & 0.045046 & 0.3088 & 0.379412 \tabularnewline
45 & -0.013766 & -0.0944 & 0.462605 \tabularnewline
46 & -0.001914 & -0.0131 & 0.494792 \tabularnewline
47 & NA & NA & NA \tabularnewline
48 & NA & NA & NA \tabularnewline
49 & NA & NA & NA \tabularnewline
50 & NA & NA & NA \tabularnewline
51 & NA & NA & NA \tabularnewline
52 & NA & NA & NA \tabularnewline
53 & NA & NA & NA \tabularnewline
54 & NA & NA & NA \tabularnewline
55 & NA & NA & NA \tabularnewline
56 & NA & NA & NA \tabularnewline
57 & NA & NA & NA \tabularnewline
58 & NA & NA & NA \tabularnewline
59 & NA & NA & NA \tabularnewline
60 & NA & NA & NA \tabularnewline
\hline
\end{tabular}
%Source: https://freestatistics.org/blog/index.php?pk=60444&T=1

[TABLE]
[ROW][C]Autocorrelation Function[/C][/ROW]
[ROW][C]Time lag k[/C][C]ACF(k)[/C][C]T-STAT[/C][C]P-value[/C][/ROW]
[ROW][C]1[/C][C]-0.696595[/C][C]-4.7756[/C][C]9e-06[/C][/ROW]
[ROW][C]2[/C][C]0.207994[/C][C]1.4259[/C][C]0.080248[/C][/ROW]
[ROW][C]3[/C][C]0.049584[/C][C]0.3399[/C][C]0.367713[/C][/ROW]
[ROW][C]4[/C][C]-0.129831[/C][C]-0.8901[/C][C]0.188979[/C][/ROW]
[ROW][C]5[/C][C]0.110874[/C][C]0.7601[/C][C]0.225491[/C][/ROW]
[ROW][C]6[/C][C]-0.042897[/C][C]-0.2941[/C][C]0.384993[/C][/ROW]
[ROW][C]7[/C][C]-0.047601[/C][C]-0.3263[/C][C]0.372809[/C][/ROW]
[ROW][C]8[/C][C]0.079921[/C][C]0.5479[/C][C]0.293173[/C][/ROW]
[ROW][C]9[/C][C]-0.020553[/C][C]-0.1409[/C][C]0.444275[/C][/ROW]
[ROW][C]10[/C][C]-0.035021[/C][C]-0.2401[/C][C]0.405651[/C][/ROW]
[ROW][C]11[/C][C]0.09737[/C][C]0.6675[/C][C]0.253848[/C][/ROW]
[ROW][C]12[/C][C]-0.161893[/C][C]-1.1099[/C][C]0.136348[/C][/ROW]
[ROW][C]13[/C][C]0.151365[/C][C]1.0377[/C][C]0.152359[/C][/ROW]
[ROW][C]14[/C][C]-0.104907[/C][C]-0.7192[/C][C]0.237788[/C][/ROW]
[ROW][C]15[/C][C]0.071181[/C][C]0.488[/C][C]0.313911[/C][/ROW]
[ROW][C]16[/C][C]-0.022803[/C][C]-0.1563[/C][C]0.438221[/C][/ROW]
[ROW][C]17[/C][C]-0.047804[/C][C]-0.3277[/C][C]0.372286[/C][/ROW]
[ROW][C]18[/C][C]0.100112[/C][C]0.6863[/C][C]0.247938[/C][/ROW]
[ROW][C]19[/C][C]-0.103431[/C][C]-0.7091[/C][C]0.240886[/C][/ROW]
[ROW][C]20[/C][C]0.058054[/C][C]0.398[/C][C]0.346218[/C][/ROW]
[ROW][C]21[/C][C]0.050149[/C][C]0.3438[/C][C]0.366262[/C][/ROW]
[ROW][C]22[/C][C]-0.209157[/C][C]-1.4339[/C][C]0.07911[/C][/ROW]
[ROW][C]23[/C][C]0.342026[/C][C]2.3448[/C][C]0.011656[/C][/ROW]
[ROW][C]24[/C][C]-0.340388[/C][C]-2.3336[/C][C]0.011973[/C][/ROW]
[ROW][C]25[/C][C]0.197975[/C][C]1.3572[/C][C]0.090592[/C][/ROW]
[ROW][C]26[/C][C]-0.07452[/C][C]-0.5109[/C][C]0.305911[/C][/ROW]
[ROW][C]27[/C][C]0.012272[/C][C]0.0841[/C][C]0.466653[/C][/ROW]
[ROW][C]28[/C][C]0.044139[/C][C]0.3026[/C][C]0.381765[/C][/ROW]
[ROW][C]29[/C][C]-0.071387[/C][C]-0.4894[/C][C]0.313416[/C][/ROW]
[ROW][C]30[/C][C]0.056334[/C][C]0.3862[/C][C]0.350543[/C][/ROW]
[ROW][C]31[/C][C]-0.001883[/C][C]-0.0129[/C][C]0.494877[/C][/ROW]
[ROW][C]32[/C][C]-0.045532[/C][C]-0.3122[/C][C]0.378154[/C][/ROW]
[ROW][C]33[/C][C]0.033201[/C][C]0.2276[/C][C]0.410466[/C][/ROW]
[ROW][C]34[/C][C]0.033366[/C][C]0.2287[/C][C]0.410031[/C][/ROW]
[ROW][C]35[/C][C]-0.165938[/C][C]-1.1376[/C][C]0.130524[/C][/ROW]
[ROW][C]36[/C][C]0.256314[/C][C]1.7572[/C][C]0.042698[/C][/ROW]
[ROW][C]37[/C][C]-0.172312[/C][C]-1.1813[/C][C]0.121711[/C][/ROW]
[ROW][C]38[/C][C]0.035378[/C][C]0.2425[/C][C]0.404709[/C][/ROW]
[ROW][C]39[/C][C]0.019983[/C][C]0.137[/C][C]0.44581[/C][/ROW]
[ROW][C]40[/C][C]-0.041148[/C][C]-0.2821[/C][C]0.389555[/C][/ROW]
[ROW][C]41[/C][C]0.061835[/C][C]0.4239[/C][C]0.33678[/C][/ROW]
[ROW][C]42[/C][C]-0.038248[/C][C]-0.2622[/C][C]0.397151[/C][/ROW]
[ROW][C]43[/C][C]-0.024941[/C][C]-0.171[/C][C]0.432483[/C][/ROW]
[ROW][C]44[/C][C]0.045046[/C][C]0.3088[/C][C]0.379412[/C][/ROW]
[ROW][C]45[/C][C]-0.013766[/C][C]-0.0944[/C][C]0.462605[/C][/ROW]
[ROW][C]46[/C][C]-0.001914[/C][C]-0.0131[/C][C]0.494792[/C][/ROW]
[ROW][C]47[/C][C]NA[/C][C]NA[/C][C]NA[/C][/ROW]
[ROW][C]48[/C][C]NA[/C][C]NA[/C][C]NA[/C][/ROW]
[ROW][C]49[/C][C]NA[/C][C]NA[/C][C]NA[/C][/ROW]
[ROW][C]50[/C][C]NA[/C][C]NA[/C][C]NA[/C][/ROW]
[ROW][C]51[/C][C]NA[/C][C]NA[/C][C]NA[/C][/ROW]
[ROW][C]52[/C][C]NA[/C][C]NA[/C][C]NA[/C][/ROW]
[ROW][C]53[/C][C]NA[/C][C]NA[/C][C]NA[/C][/ROW]
[ROW][C]54[/C][C]NA[/C][C]NA[/C][C]NA[/C][/ROW]
[ROW][C]55[/C][C]NA[/C][C]NA[/C][C]NA[/C][/ROW]
[ROW][C]56[/C][C]NA[/C][C]NA[/C][C]NA[/C][/ROW]
[ROW][C]57[/C][C]NA[/C][C]NA[/C][C]NA[/C][/ROW]
[ROW][C]58[/C][C]NA[/C][C]NA[/C][C]NA[/C][/ROW]
[ROW][C]59[/C][C]NA[/C][C]NA[/C][C]NA[/C][/ROW]
[ROW][C]60[/C][C]NA[/C][C]NA[/C][C]NA[/C][/ROW]
[/TABLE]
Source: https://freestatistics.org/blog/index.php?pk=60444&T=1

Globally Unique Identifier (entire table): ba.freestatistics.org/blog/index.php?pk=60444&T=1

As an alternative you can also use a QR Code:  

The GUIDs for individual cells are displayed in the table below:

Autocorrelation Function
Time lag kACF(k)T-STATP-value
1-0.696595-4.77569e-06
20.2079941.42590.080248
30.0495840.33990.367713
4-0.129831-0.89010.188979
50.1108740.76010.225491
6-0.042897-0.29410.384993
7-0.047601-0.32630.372809
80.0799210.54790.293173
9-0.020553-0.14090.444275
10-0.035021-0.24010.405651
110.097370.66750.253848
12-0.161893-1.10990.136348
130.1513651.03770.152359
14-0.104907-0.71920.237788
150.0711810.4880.313911
16-0.022803-0.15630.438221
17-0.047804-0.32770.372286
180.1001120.68630.247938
19-0.103431-0.70910.240886
200.0580540.3980.346218
210.0501490.34380.366262
22-0.209157-1.43390.07911
230.3420262.34480.011656
24-0.340388-2.33360.011973
250.1979751.35720.090592
26-0.07452-0.51090.305911
270.0122720.08410.466653
280.0441390.30260.381765
29-0.071387-0.48940.313416
300.0563340.38620.350543
31-0.001883-0.01290.494877
32-0.045532-0.31220.378154
330.0332010.22760.410466
340.0333660.22870.410031
35-0.165938-1.13760.130524
360.2563141.75720.042698
37-0.172312-1.18130.121711
380.0353780.24250.404709
390.0199830.1370.44581
40-0.041148-0.28210.389555
410.0618350.42390.33678
42-0.038248-0.26220.397151
43-0.024941-0.1710.432483
440.0450460.30880.379412
45-0.013766-0.09440.462605
46-0.001914-0.01310.494792
47NANANA
48NANANA
49NANANA
50NANANA
51NANANA
52NANANA
53NANANA
54NANANA
55NANANA
56NANANA
57NANANA
58NANANA
59NANANA
60NANANA


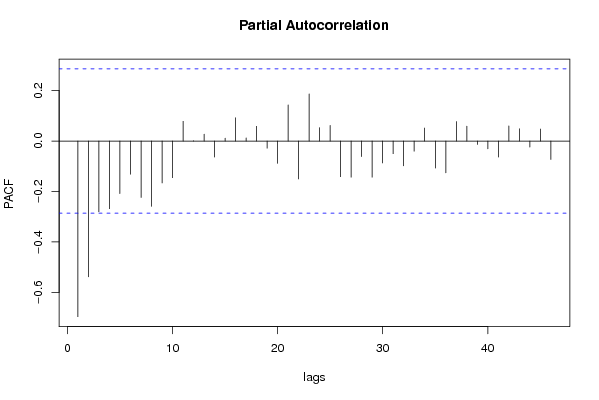
Partial Autocorrelation Function
Time lag kPACF(k)T-STATP-value
1-0.696595-4.77569e-06
2-0.538606-3.69250.000289
3-0.280991-1.92640.030058
4-0.268156-1.83840.036165
5-0.208201-1.42740.080044
6-0.131522-0.90170.185916
7-0.223773-1.53410.065854
8-0.259092-1.77620.041083
9-0.166016-1.13810.130414
10-0.145281-0.9960.162175
110.0780420.5350.297576
120.0008590.00590.497664
130.0273380.18740.426068
14-0.063411-0.43470.332875
150.0113020.07750.469283
160.0922860.63270.265004
170.0123250.08450.466512
180.0581940.3990.345865
19-0.028229-0.19350.423691
20-0.088411-0.60610.273677
210.1431770.98160.165668
22-0.150511-1.03190.153711
230.1868121.28070.103289
240.0530470.36370.358868
250.0618320.42390.336787
26-0.141655-0.97110.168226
27-0.143496-0.98380.165136
28-0.061554-0.4220.337478
29-0.143693-0.98510.164807
30-0.086751-0.59470.277437
31-0.050106-0.34350.366374
32-0.09824-0.67350.251965
33-0.04052-0.27780.391197
340.0514890.3530.362836
35-0.107073-0.73410.233281
36-0.126279-0.86570.195519
370.0770030.52790.300024
380.0590960.40510.343606
39-0.013333-0.09140.46378
40-0.03072-0.21060.417053
41-0.063386-0.43460.332937
420.0600670.41180.341179
430.0483740.33160.370819
44-0.024002-0.16450.435003
450.0474970.32560.373076
46-0.073221-0.5020.309013
47NANANA
48NANANA
49NANANA
50NANANA
51NANANA
52NANANA
53NANANA
54NANANA
55NANANA
56NANANA
57NANANA
58NANANA
59NANANA
60NANANA

\begin{tabular}{lllllllll}
\hline
Partial Autocorrelation Function \tabularnewline
Time lag k & PACF(k) & T-STAT & P-value \tabularnewline
1 & -0.696595 & -4.7756 & 9e-06 \tabularnewline
2 & -0.538606 & -3.6925 & 0.000289 \tabularnewline
3 & -0.280991 & -1.9264 & 0.030058 \tabularnewline
4 & -0.268156 & -1.8384 & 0.036165 \tabularnewline
5 & -0.208201 & -1.4274 & 0.080044 \tabularnewline
6 & -0.131522 & -0.9017 & 0.185916 \tabularnewline
7 & -0.223773 & -1.5341 & 0.065854 \tabularnewline
8 & -0.259092 & -1.7762 & 0.041083 \tabularnewline
9 & -0.166016 & -1.1381 & 0.130414 \tabularnewline
10 & -0.145281 & -0.996 & 0.162175 \tabularnewline
11 & 0.078042 & 0.535 & 0.297576 \tabularnewline
12 & 0.000859 & 0.0059 & 0.497664 \tabularnewline
13 & 0.027338 & 0.1874 & 0.426068 \tabularnewline
14 & -0.063411 & -0.4347 & 0.332875 \tabularnewline
15 & 0.011302 & 0.0775 & 0.469283 \tabularnewline
16 & 0.092286 & 0.6327 & 0.265004 \tabularnewline
17 & 0.012325 & 0.0845 & 0.466512 \tabularnewline
18 & 0.058194 & 0.399 & 0.345865 \tabularnewline
19 & -0.028229 & -0.1935 & 0.423691 \tabularnewline
20 & -0.088411 & -0.6061 & 0.273677 \tabularnewline
21 & 0.143177 & 0.9816 & 0.165668 \tabularnewline
22 & -0.150511 & -1.0319 & 0.153711 \tabularnewline
23 & 0.186812 & 1.2807 & 0.103289 \tabularnewline
24 & 0.053047 & 0.3637 & 0.358868 \tabularnewline
25 & 0.061832 & 0.4239 & 0.336787 \tabularnewline
26 & -0.141655 & -0.9711 & 0.168226 \tabularnewline
27 & -0.143496 & -0.9838 & 0.165136 \tabularnewline
28 & -0.061554 & -0.422 & 0.337478 \tabularnewline
29 & -0.143693 & -0.9851 & 0.164807 \tabularnewline
30 & -0.086751 & -0.5947 & 0.277437 \tabularnewline
31 & -0.050106 & -0.3435 & 0.366374 \tabularnewline
32 & -0.09824 & -0.6735 & 0.251965 \tabularnewline
33 & -0.04052 & -0.2778 & 0.391197 \tabularnewline
34 & 0.051489 & 0.353 & 0.362836 \tabularnewline
35 & -0.107073 & -0.7341 & 0.233281 \tabularnewline
36 & -0.126279 & -0.8657 & 0.195519 \tabularnewline
37 & 0.077003 & 0.5279 & 0.300024 \tabularnewline
38 & 0.059096 & 0.4051 & 0.343606 \tabularnewline
39 & -0.013333 & -0.0914 & 0.46378 \tabularnewline
40 & -0.03072 & -0.2106 & 0.417053 \tabularnewline
41 & -0.063386 & -0.4346 & 0.332937 \tabularnewline
42 & 0.060067 & 0.4118 & 0.341179 \tabularnewline
43 & 0.048374 & 0.3316 & 0.370819 \tabularnewline
44 & -0.024002 & -0.1645 & 0.435003 \tabularnewline
45 & 0.047497 & 0.3256 & 0.373076 \tabularnewline
46 & -0.073221 & -0.502 & 0.309013 \tabularnewline
47 & NA & NA & NA \tabularnewline
48 & NA & NA & NA \tabularnewline
49 & NA & NA & NA \tabularnewline
50 & NA & NA & NA \tabularnewline
51 & NA & NA & NA \tabularnewline
52 & NA & NA & NA \tabularnewline
53 & NA & NA & NA \tabularnewline
54 & NA & NA & NA \tabularnewline
55 & NA & NA & NA \tabularnewline
56 & NA & NA & NA \tabularnewline
57 & NA & NA & NA \tabularnewline
58 & NA & NA & NA \tabularnewline
59 & NA & NA & NA \tabularnewline
60 & NA & NA & NA \tabularnewline
\hline
\end{tabular}
%Source: https://freestatistics.org/blog/index.php?pk=60444&T=2

[TABLE]
[ROW][C]Partial Autocorrelation Function[/C][/ROW]
[ROW][C]Time lag k[/C][C]PACF(k)[/C][C]T-STAT[/C][C]P-value[/C][/ROW]
[ROW][C]1[/C][C]-0.696595[/C][C]-4.7756[/C][C]9e-06[/C][/ROW]
[ROW][C]2[/C][C]-0.538606[/C][C]-3.6925[/C][C]0.000289[/C][/ROW]
[ROW][C]3[/C][C]-0.280991[/C][C]-1.9264[/C][C]0.030058[/C][/ROW]
[ROW][C]4[/C][C]-0.268156[/C][C]-1.8384[/C][C]0.036165[/C][/ROW]
[ROW][C]5[/C][C]-0.208201[/C][C]-1.4274[/C][C]0.080044[/C][/ROW]
[ROW][C]6[/C][C]-0.131522[/C][C]-0.9017[/C][C]0.185916[/C][/ROW]
[ROW][C]7[/C][C]-0.223773[/C][C]-1.5341[/C][C]0.065854[/C][/ROW]
[ROW][C]8[/C][C]-0.259092[/C][C]-1.7762[/C][C]0.041083[/C][/ROW]
[ROW][C]9[/C][C]-0.166016[/C][C]-1.1381[/C][C]0.130414[/C][/ROW]
[ROW][C]10[/C][C]-0.145281[/C][C]-0.996[/C][C]0.162175[/C][/ROW]
[ROW][C]11[/C][C]0.078042[/C][C]0.535[/C][C]0.297576[/C][/ROW]
[ROW][C]12[/C][C]0.000859[/C][C]0.0059[/C][C]0.497664[/C][/ROW]
[ROW][C]13[/C][C]0.027338[/C][C]0.1874[/C][C]0.426068[/C][/ROW]
[ROW][C]14[/C][C]-0.063411[/C][C]-0.4347[/C][C]0.332875[/C][/ROW]
[ROW][C]15[/C][C]0.011302[/C][C]0.0775[/C][C]0.469283[/C][/ROW]
[ROW][C]16[/C][C]0.092286[/C][C]0.6327[/C][C]0.265004[/C][/ROW]
[ROW][C]17[/C][C]0.012325[/C][C]0.0845[/C][C]0.466512[/C][/ROW]
[ROW][C]18[/C][C]0.058194[/C][C]0.399[/C][C]0.345865[/C][/ROW]
[ROW][C]19[/C][C]-0.028229[/C][C]-0.1935[/C][C]0.423691[/C][/ROW]
[ROW][C]20[/C][C]-0.088411[/C][C]-0.6061[/C][C]0.273677[/C][/ROW]
[ROW][C]21[/C][C]0.143177[/C][C]0.9816[/C][C]0.165668[/C][/ROW]
[ROW][C]22[/C][C]-0.150511[/C][C]-1.0319[/C][C]0.153711[/C][/ROW]
[ROW][C]23[/C][C]0.186812[/C][C]1.2807[/C][C]0.103289[/C][/ROW]
[ROW][C]24[/C][C]0.053047[/C][C]0.3637[/C][C]0.358868[/C][/ROW]
[ROW][C]25[/C][C]0.061832[/C][C]0.4239[/C][C]0.336787[/C][/ROW]
[ROW][C]26[/C][C]-0.141655[/C][C]-0.9711[/C][C]0.168226[/C][/ROW]
[ROW][C]27[/C][C]-0.143496[/C][C]-0.9838[/C][C]0.165136[/C][/ROW]
[ROW][C]28[/C][C]-0.061554[/C][C]-0.422[/C][C]0.337478[/C][/ROW]
[ROW][C]29[/C][C]-0.143693[/C][C]-0.9851[/C][C]0.164807[/C][/ROW]
[ROW][C]30[/C][C]-0.086751[/C][C]-0.5947[/C][C]0.277437[/C][/ROW]
[ROW][C]31[/C][C]-0.050106[/C][C]-0.3435[/C][C]0.366374[/C][/ROW]
[ROW][C]32[/C][C]-0.09824[/C][C]-0.6735[/C][C]0.251965[/C][/ROW]
[ROW][C]33[/C][C]-0.04052[/C][C]-0.2778[/C][C]0.391197[/C][/ROW]
[ROW][C]34[/C][C]0.051489[/C][C]0.353[/C][C]0.362836[/C][/ROW]
[ROW][C]35[/C][C]-0.107073[/C][C]-0.7341[/C][C]0.233281[/C][/ROW]
[ROW][C]36[/C][C]-0.126279[/C][C]-0.8657[/C][C]0.195519[/C][/ROW]
[ROW][C]37[/C][C]0.077003[/C][C]0.5279[/C][C]0.300024[/C][/ROW]
[ROW][C]38[/C][C]0.059096[/C][C]0.4051[/C][C]0.343606[/C][/ROW]
[ROW][C]39[/C][C]-0.013333[/C][C]-0.0914[/C][C]0.46378[/C][/ROW]
[ROW][C]40[/C][C]-0.03072[/C][C]-0.2106[/C][C]0.417053[/C][/ROW]
[ROW][C]41[/C][C]-0.063386[/C][C]-0.4346[/C][C]0.332937[/C][/ROW]
[ROW][C]42[/C][C]0.060067[/C][C]0.4118[/C][C]0.341179[/C][/ROW]
[ROW][C]43[/C][C]0.048374[/C][C]0.3316[/C][C]0.370819[/C][/ROW]
[ROW][C]44[/C][C]-0.024002[/C][C]-0.1645[/C][C]0.435003[/C][/ROW]
[ROW][C]45[/C][C]0.047497[/C][C]0.3256[/C][C]0.373076[/C][/ROW]
[ROW][C]46[/C][C]-0.073221[/C][C]-0.502[/C][C]0.309013[/C][/ROW]
[ROW][C]47[/C][C]NA[/C][C]NA[/C][C]NA[/C][/ROW]
[ROW][C]48[/C][C]NA[/C][C]NA[/C][C]NA[/C][/ROW]
[ROW][C]49[/C][C]NA[/C][C]NA[/C][C]NA[/C][/ROW]
[ROW][C]50[/C][C]NA[/C][C]NA[/C][C]NA[/C][/ROW]
[ROW][C]51[/C][C]NA[/C][C]NA[/C][C]NA[/C][/ROW]
[ROW][C]52[/C][C]NA[/C][C]NA[/C][C]NA[/C][/ROW]
[ROW][C]53[/C][C]NA[/C][C]NA[/C][C]NA[/C][/ROW]
[ROW][C]54[/C][C]NA[/C][C]NA[/C][C]NA[/C][/ROW]
[ROW][C]55[/C][C]NA[/C][C]NA[/C][C]NA[/C][/ROW]
[ROW][C]56[/C][C]NA[/C][C]NA[/C][C]NA[/C][/ROW]
[ROW][C]57[/C][C]NA[/C][C]NA[/C][C]NA[/C][/ROW]
[ROW][C]58[/C][C]NA[/C][C]NA[/C][C]NA[/C][/ROW]
[ROW][C]59[/C][C]NA[/C][C]NA[/C][C]NA[/C][/ROW]
[ROW][C]60[/C][C]NA[/C][C]NA[/C][C]NA[/C][/ROW]
[/TABLE]
Source: https://freestatistics.org/blog/index.php?pk=60444&T=2

Globally Unique Identifier (entire table): ba.freestatistics.org/blog/index.php?pk=60444&T=2

As an alternative you can also use a QR Code:  

The GUIDs for individual cells are displayed in the table below:

Partial Autocorrelation Function
Time lag kPACF(k)T-STATP-value
1-0.696595-4.77569e-06
2-0.538606-3.69250.000289
3-0.280991-1.92640.030058
4-0.268156-1.83840.036165
5-0.208201-1.42740.080044
6-0.131522-0.90170.185916
7-0.223773-1.53410.065854
8-0.259092-1.77620.041083
9-0.166016-1.13810.130414
10-0.145281-0.9960.162175
110.0780420.5350.297576
120.0008590.00590.497664
130.0273380.18740.426068
14-0.063411-0.43470.332875
150.0113020.07750.469283
160.0922860.63270.265004
170.0123250.08450.466512
180.0581940.3990.345865
19-0.028229-0.19350.423691
20-0.088411-0.60610.273677
210.1431770.98160.165668
22-0.150511-1.03190.153711
230.1868121.28070.103289
240.0530470.36370.358868
250.0618320.42390.336787
26-0.141655-0.97110.168226
27-0.143496-0.98380.165136
28-0.061554-0.4220.337478
29-0.143693-0.98510.164807
30-0.086751-0.59470.277437
31-0.050106-0.34350.366374
32-0.09824-0.67350.251965
33-0.04052-0.27780.391197
340.0514890.3530.362836
35-0.107073-0.73410.233281
36-0.126279-0.86570.195519
370.0770030.52790.300024
380.0590960.40510.343606
39-0.013333-0.09140.46378
40-0.03072-0.21060.417053
41-0.063386-0.43460.332937
420.0600670.41180.341179
430.0483740.33160.370819
44-0.024002-0.16450.435003
450.0474970.32560.373076
46-0.073221-0.5020.309013
47NANANA
48NANANA
49NANANA
50NANANA
51NANANA
52NANANA
53NANANA
54NANANA
55NANANA
56NANANA
57NANANA
58NANANA
59NANANA
60NANANA


Parameters (Session):
par1 = 60 ; par2 = 1 ; par3 = 1 ; par4 = 1 ; par5 = 12 ; par6 = White Noise ; par7 = 0.95 ;
Parameters (R input):
par1 = 60 ; par2 = 1 ; par3 = 1 ; par4 = 1 ; par5 = 12 ; par6 = White Noise ; par7 = 0.95 ;
R code (references can be found in the software module):
if (par1 == 'Default') {
par1 = 10*log10(length(x))
} else {
par1 <- as.numeric(par1)
}
par2 <- as.numeric(par2)
par3 <- as.numeric(par3)
par4 <- as.numeric(par4)
par5 <- as.numeric(par5)
if (par6 == 'White Noise') par6 <- 'white' else par6 <- 'ma'
par7 <- as.numeric(par7)
if (par2 == 0) {
x <- log(x)
} else {
x <- (x ^ par2 - 1) / par2
}
if (par3 > 0) x <- diff(x,lag=1,difference=par3)
if (par4 > 0) x <- diff(x,lag=par5,difference=par4)
bitmap(file='pic1.png')
racf <- acf(x, par1, main='Autocorrelation', xlab='time lag', ylab='ACF', ci.type=par6, ci=par7, sub=paste('(lambda=',par2,', d=',par3,', D=',par4,', CI=', par7, ', CI type=',par6,')',sep=''))
dev.off()
bitmap(file='pic2.png')
rpacf <- pacf(x,par1,main='Partial Autocorrelation',xlab='lags',ylab='PACF')
dev.off()
(myacf <- c(racf$acf))
(mypacf <- c(rpacf$acf))
lengthx <- length(x)
sqrtn <- sqrt(lengthx)
load(file='createtable')
a<-table.start()
a<-table.row.start(a)
a<-table.element(a,'Autocorrelation Function',4,TRUE)
a<-table.row.end(a)
a<-table.row.start(a)
a<-table.element(a,'Time lag k',header=TRUE)
a<-table.element(a,hyperlink('basics.htm','ACF(k)','click here for more information about the Autocorrelation Function'),header=TRUE)
a<-table.element(a,'T-STAT',header=TRUE)
a<-table.element(a,'P-value',header=TRUE)
a<-table.row.end(a)
for (i in 2:(par1+1)) {
a<-table.row.start(a)
a<-table.element(a,i-1,header=TRUE)
a<-table.element(a,round(myacf[i],6))
mytstat <- myacf[i]*sqrtn
a<-table.element(a,round(mytstat,4))
a<-table.element(a,round(1-pt(abs(mytstat),lengthx),6))
a<-table.row.end(a)
}
a<-table.end(a)
table.save(a,file='mytable.tab')
a<-table.start()
a<-table.row.start(a)
a<-table.element(a,'Partial Autocorrelation Function',4,TRUE)
a<-table.row.end(a)
a<-table.row.start(a)
a<-table.element(a,'Time lag k',header=TRUE)
a<-table.element(a,hyperlink('basics.htm','PACF(k)','click here for more information about the Partial Autocorrelation Function'),header=TRUE)
a<-table.element(a,'T-STAT',header=TRUE)
a<-table.element(a,'P-value',header=TRUE)
a<-table.row.end(a)
for (i in 1:par1) {
a<-table.row.start(a)
a<-table.element(a,i,header=TRUE)
a<-table.element(a,round(mypacf[i],6))
mytstat <- mypacf[i]*sqrtn
a<-table.element(a,round(mytstat,4))
a<-table.element(a,round(1-pt(abs(mytstat),lengthx),6))
a<-table.row.end(a)
}
a<-table.end(a)
table.save(a,file='mytable1.tab')