Free Statistics

of Irreproducible Research!

Author's title

Author*The author of this computation has been verified*
R Software Modulerwasp_autocorrelation.wasp
Title produced by software(Partial) Autocorrelation Function
Date of computationFri, 27 Nov 2009 01:19:55 -0700
Cite this page as followsStatistical Computations at FreeStatistics.org, Office for Research Development and Education, URL https://freestatistics.org/blog/index.php?v=date/2009/Nov/27/t1259310417zshm8a2o005gmsm.htm/, Retrieved Sun, 28 Apr 2024 22:12:35 +0000
Statistical Computations at FreeStatistics.org, Office for Research Development and Education, URL https://freestatistics.org/blog/index.php?pk=60464, Retrieved Sun, 28 Apr 2024 22:12:35 +0000
QR Codes:

Original text written by user:
IsPrivate?No (this computation is public)
User-defined keywordsIntegration
Estimated Impact184
Family? (F = Feedback message, R = changed R code, M = changed R Module, P = changed Parameters, D = changed Data)
-       [(Partial) Autocorrelation Function] [Identifying Integ...] [2009-11-27 08:19:55] [64e929ed9a52e44aa31e1ff8e49d1c0b] [Current]
Feedback Forum

Post a new message
Dataseries X:
699.8 
871.2 
842.6 
809.2 
847.1 
857 
839.9 
967.4 
1037.2 
1062.3 
899.3 
1129.6 
845.7 
1173.9 
1073.8 
1024.7 
912.9 
1055 
936.4 
920.6 
1059.3 
1164.1 
823.9 
1076.6 
833.5 
996 
852.8 
758.5 
760.4 
826.8 
941.7 
1097.8 
802.8 
839.7 
791 
1063.1 
1138.4 
888.6 
931.1 
863.2 
936.2 
701.7 
873.8 
696.8 
658.1 
706.7 
458.5 
685.7 
660.1 
774.9 
787.4 
486.9 
310.8 
619.5 
550.2 
463.4 
630.4 
729 
485.6 
453.7


Summary of computational transaction
Raw Inputview raw input (R code)
Raw Outputview raw output of R engine
Computing time1 seconds
R Server'Gwilym Jenkins' @ 72.249.127.135

\begin{tabular}{lllllllll}
\hline
Summary of computational transaction \tabularnewline
Raw Input & view raw input (R code)  \tabularnewline
Raw Output & view raw output of R engine  \tabularnewline
Computing time & 1 seconds \tabularnewline
R Server & 'Gwilym Jenkins' @ 72.249.127.135 \tabularnewline
\hline
\end{tabular}
%Source: https://freestatistics.org/blog/index.php?pk=60464&T=0

[TABLE]
[ROW][C]Summary of computational transaction[/C][/ROW]
[ROW][C]Raw Input[/C][C]view raw input (R code) [/C][/ROW]
[ROW][C]Raw Output[/C][C]view raw output of R engine [/C][/ROW]
[ROW][C]Computing time[/C][C]1 seconds[/C][/ROW]
[ROW][C]R Server[/C][C]'Gwilym Jenkins' @ 72.249.127.135[/C][/ROW]
[/TABLE]
Source: https://freestatistics.org/blog/index.php?pk=60464&T=0

Globally Unique Identifier (entire table): ba.freestatistics.org/blog/index.php?pk=60464&T=0

As an alternative you can also use a QR Code:  

The GUIDs for individual cells are displayed in the table below:

Summary of computational transaction
Raw Inputview raw input (R code)
Raw Outputview raw output of R engine
Computing time1 seconds
R Server'Gwilym Jenkins' @ 72.249.127.135


Autocorrelation Function
Time lag kACF(k)T-STATP-value
10.6201694.80385e-06
20.5750294.45421.9e-05
30.5269654.08196.7e-05
40.5452764.22374.1e-05
50.4788383.70910.000228
60.4793813.71330.000225
70.4051643.13840.001317
80.303292.34930.01106
90.2075281.60750.056597
100.2433721.88520.032127
110.152261.17940.121447
120.2109641.63410.053735
130.1114990.86370.195606
140.1013270.78490.217808
150.0312610.24210.404746
16-0.039396-0.30520.38065
17-0.020912-0.1620.435931
18-0.002485-0.01930.492352
19-0.04227-0.32740.372245
20-0.088323-0.68410.248258
21-0.120519-0.93350.177143
22-0.030877-0.23920.405895
23-0.125701-0.97370.167064
24-0.056006-0.43380.332987
25-0.052866-0.40950.341815
26-0.077855-0.60310.274369
27-0.0727-0.56310.287722
28-0.134664-1.04310.150543
29-0.124571-0.96490.169228
30-0.173333-1.34260.092225
31-0.220427-1.70740.046457
32-0.235212-1.82190.036725
33-0.270197-2.09290.020296
34-0.265169-2.0540.022171
35-0.31159-2.41360.009434
36-0.268349-2.07860.020968

\begin{tabular}{lllllllll}
\hline
Autocorrelation Function \tabularnewline
Time lag k & ACF(k) & T-STAT & P-value \tabularnewline
1 & 0.620169 & 4.8038 & 5e-06 \tabularnewline
2 & 0.575029 & 4.4542 & 1.9e-05 \tabularnewline
3 & 0.526965 & 4.0819 & 6.7e-05 \tabularnewline
4 & 0.545276 & 4.2237 & 4.1e-05 \tabularnewline
5 & 0.478838 & 3.7091 & 0.000228 \tabularnewline
6 & 0.479381 & 3.7133 & 0.000225 \tabularnewline
7 & 0.405164 & 3.1384 & 0.001317 \tabularnewline
8 & 0.30329 & 2.3493 & 0.01106 \tabularnewline
9 & 0.207528 & 1.6075 & 0.056597 \tabularnewline
10 & 0.243372 & 1.8852 & 0.032127 \tabularnewline
11 & 0.15226 & 1.1794 & 0.121447 \tabularnewline
12 & 0.210964 & 1.6341 & 0.053735 \tabularnewline
13 & 0.111499 & 0.8637 & 0.195606 \tabularnewline
14 & 0.101327 & 0.7849 & 0.217808 \tabularnewline
15 & 0.031261 & 0.2421 & 0.404746 \tabularnewline
16 & -0.039396 & -0.3052 & 0.38065 \tabularnewline
17 & -0.020912 & -0.162 & 0.435931 \tabularnewline
18 & -0.002485 & -0.0193 & 0.492352 \tabularnewline
19 & -0.04227 & -0.3274 & 0.372245 \tabularnewline
20 & -0.088323 & -0.6841 & 0.248258 \tabularnewline
21 & -0.120519 & -0.9335 & 0.177143 \tabularnewline
22 & -0.030877 & -0.2392 & 0.405895 \tabularnewline
23 & -0.125701 & -0.9737 & 0.167064 \tabularnewline
24 & -0.056006 & -0.4338 & 0.332987 \tabularnewline
25 & -0.052866 & -0.4095 & 0.341815 \tabularnewline
26 & -0.077855 & -0.6031 & 0.274369 \tabularnewline
27 & -0.0727 & -0.5631 & 0.287722 \tabularnewline
28 & -0.134664 & -1.0431 & 0.150543 \tabularnewline
29 & -0.124571 & -0.9649 & 0.169228 \tabularnewline
30 & -0.173333 & -1.3426 & 0.092225 \tabularnewline
31 & -0.220427 & -1.7074 & 0.046457 \tabularnewline
32 & -0.235212 & -1.8219 & 0.036725 \tabularnewline
33 & -0.270197 & -2.0929 & 0.020296 \tabularnewline
34 & -0.265169 & -2.054 & 0.022171 \tabularnewline
35 & -0.31159 & -2.4136 & 0.009434 \tabularnewline
36 & -0.268349 & -2.0786 & 0.020968 \tabularnewline
\hline
\end{tabular}
%Source: https://freestatistics.org/blog/index.php?pk=60464&T=1

[TABLE]
[ROW][C]Autocorrelation Function[/C][/ROW]
[ROW][C]Time lag k[/C][C]ACF(k)[/C][C]T-STAT[/C][C]P-value[/C][/ROW]
[ROW][C]1[/C][C]0.620169[/C][C]4.8038[/C][C]5e-06[/C][/ROW]
[ROW][C]2[/C][C]0.575029[/C][C]4.4542[/C][C]1.9e-05[/C][/ROW]
[ROW][C]3[/C][C]0.526965[/C][C]4.0819[/C][C]6.7e-05[/C][/ROW]
[ROW][C]4[/C][C]0.545276[/C][C]4.2237[/C][C]4.1e-05[/C][/ROW]
[ROW][C]5[/C][C]0.478838[/C][C]3.7091[/C][C]0.000228[/C][/ROW]
[ROW][C]6[/C][C]0.479381[/C][C]3.7133[/C][C]0.000225[/C][/ROW]
[ROW][C]7[/C][C]0.405164[/C][C]3.1384[/C][C]0.001317[/C][/ROW]
[ROW][C]8[/C][C]0.30329[/C][C]2.3493[/C][C]0.01106[/C][/ROW]
[ROW][C]9[/C][C]0.207528[/C][C]1.6075[/C][C]0.056597[/C][/ROW]
[ROW][C]10[/C][C]0.243372[/C][C]1.8852[/C][C]0.032127[/C][/ROW]
[ROW][C]11[/C][C]0.15226[/C][C]1.1794[/C][C]0.121447[/C][/ROW]
[ROW][C]12[/C][C]0.210964[/C][C]1.6341[/C][C]0.053735[/C][/ROW]
[ROW][C]13[/C][C]0.111499[/C][C]0.8637[/C][C]0.195606[/C][/ROW]
[ROW][C]14[/C][C]0.101327[/C][C]0.7849[/C][C]0.217808[/C][/ROW]
[ROW][C]15[/C][C]0.031261[/C][C]0.2421[/C][C]0.404746[/C][/ROW]
[ROW][C]16[/C][C]-0.039396[/C][C]-0.3052[/C][C]0.38065[/C][/ROW]
[ROW][C]17[/C][C]-0.020912[/C][C]-0.162[/C][C]0.435931[/C][/ROW]
[ROW][C]18[/C][C]-0.002485[/C][C]-0.0193[/C][C]0.492352[/C][/ROW]
[ROW][C]19[/C][C]-0.04227[/C][C]-0.3274[/C][C]0.372245[/C][/ROW]
[ROW][C]20[/C][C]-0.088323[/C][C]-0.6841[/C][C]0.248258[/C][/ROW]
[ROW][C]21[/C][C]-0.120519[/C][C]-0.9335[/C][C]0.177143[/C][/ROW]
[ROW][C]22[/C][C]-0.030877[/C][C]-0.2392[/C][C]0.405895[/C][/ROW]
[ROW][C]23[/C][C]-0.125701[/C][C]-0.9737[/C][C]0.167064[/C][/ROW]
[ROW][C]24[/C][C]-0.056006[/C][C]-0.4338[/C][C]0.332987[/C][/ROW]
[ROW][C]25[/C][C]-0.052866[/C][C]-0.4095[/C][C]0.341815[/C][/ROW]
[ROW][C]26[/C][C]-0.077855[/C][C]-0.6031[/C][C]0.274369[/C][/ROW]
[ROW][C]27[/C][C]-0.0727[/C][C]-0.5631[/C][C]0.287722[/C][/ROW]
[ROW][C]28[/C][C]-0.134664[/C][C]-1.0431[/C][C]0.150543[/C][/ROW]
[ROW][C]29[/C][C]-0.124571[/C][C]-0.9649[/C][C]0.169228[/C][/ROW]
[ROW][C]30[/C][C]-0.173333[/C][C]-1.3426[/C][C]0.092225[/C][/ROW]
[ROW][C]31[/C][C]-0.220427[/C][C]-1.7074[/C][C]0.046457[/C][/ROW]
[ROW][C]32[/C][C]-0.235212[/C][C]-1.8219[/C][C]0.036725[/C][/ROW]
[ROW][C]33[/C][C]-0.270197[/C][C]-2.0929[/C][C]0.020296[/C][/ROW]
[ROW][C]34[/C][C]-0.265169[/C][C]-2.054[/C][C]0.022171[/C][/ROW]
[ROW][C]35[/C][C]-0.31159[/C][C]-2.4136[/C][C]0.009434[/C][/ROW]
[ROW][C]36[/C][C]-0.268349[/C][C]-2.0786[/C][C]0.020968[/C][/ROW]
[/TABLE]
Source: https://freestatistics.org/blog/index.php?pk=60464&T=1

Globally Unique Identifier (entire table): ba.freestatistics.org/blog/index.php?pk=60464&T=1

As an alternative you can also use a QR Code:  

The GUIDs for individual cells are displayed in the table below:

Autocorrelation Function
Time lag kACF(k)T-STATP-value
10.6201694.80385e-06
20.5750294.45421.9e-05
30.5269654.08196.7e-05
40.5452764.22374.1e-05
50.4788383.70910.000228
60.4793813.71330.000225
70.4051643.13840.001317
80.303292.34930.01106
90.2075281.60750.056597
100.2433721.88520.032127
110.152261.17940.121447
120.2109641.63410.053735
130.1114990.86370.195606
140.1013270.78490.217808
150.0312610.24210.404746
16-0.039396-0.30520.38065
17-0.020912-0.1620.435931
18-0.002485-0.01930.492352
19-0.04227-0.32740.372245
20-0.088323-0.68410.248258
21-0.120519-0.93350.177143
22-0.030877-0.23920.405895
23-0.125701-0.97370.167064
24-0.056006-0.43380.332987
25-0.052866-0.40950.341815
26-0.077855-0.60310.274369
27-0.0727-0.56310.287722
28-0.134664-1.04310.150543
29-0.124571-0.96490.169228
30-0.173333-1.34260.092225
31-0.220427-1.70740.046457
32-0.235212-1.82190.036725
33-0.270197-2.09290.020296
34-0.265169-2.0540.022171
35-0.31159-2.41360.009434
36-0.268349-2.07860.020968


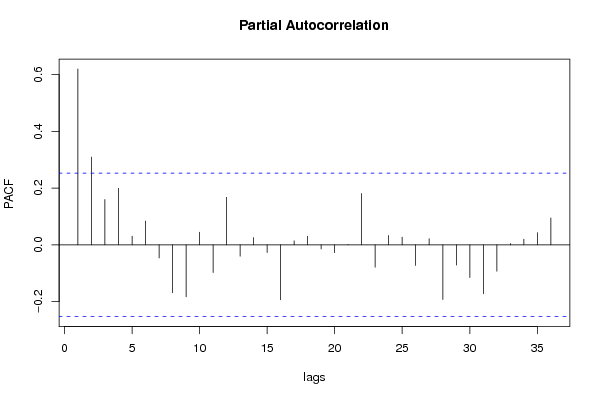
Partial Autocorrelation Function
Time lag kPACF(k)T-STATP-value
10.6201694.80385e-06
20.309432.39680.009835
30.1595751.23610.110627
40.1991821.54290.064062
50.0306050.23710.406707
60.0838090.64920.25935
7-0.046234-0.35810.360751
8-0.168912-1.30840.097866
9-0.183127-1.41850.08061
100.0445910.34540.3655
11-0.097475-0.7550.22659
120.1674461.2970.099794
13-0.039861-0.30880.379285
140.025960.20110.420655
15-0.02691-0.20840.417793
16-0.193505-1.49890.069574
170.0142140.11010.456348
180.0307040.23780.406411
19-0.014355-0.11120.455918
20-0.027522-0.21320.415953
210.0011390.00880.496495
220.1814511.40550.082513
23-0.078503-0.60810.272713
240.033320.25810.398607
250.0272790.21130.416683
26-0.072726-0.56330.287653
270.0218660.16940.433036
28-0.192376-1.49010.070713
29-0.071122-0.55090.291872
30-0.11519-0.89230.18791
31-0.172321-1.33480.093493
32-0.092901-0.71960.237279
330.0051040.03950.484296
340.0198460.15370.43917
350.0429290.33250.370326
360.0948640.73480.232658

\begin{tabular}{lllllllll}
\hline
Partial Autocorrelation Function \tabularnewline
Time lag k & PACF(k) & T-STAT & P-value \tabularnewline
1 & 0.620169 & 4.8038 & 5e-06 \tabularnewline
2 & 0.30943 & 2.3968 & 0.009835 \tabularnewline
3 & 0.159575 & 1.2361 & 0.110627 \tabularnewline
4 & 0.199182 & 1.5429 & 0.064062 \tabularnewline
5 & 0.030605 & 0.2371 & 0.406707 \tabularnewline
6 & 0.083809 & 0.6492 & 0.25935 \tabularnewline
7 & -0.046234 & -0.3581 & 0.360751 \tabularnewline
8 & -0.168912 & -1.3084 & 0.097866 \tabularnewline
9 & -0.183127 & -1.4185 & 0.08061 \tabularnewline
10 & 0.044591 & 0.3454 & 0.3655 \tabularnewline
11 & -0.097475 & -0.755 & 0.22659 \tabularnewline
12 & 0.167446 & 1.297 & 0.099794 \tabularnewline
13 & -0.039861 & -0.3088 & 0.379285 \tabularnewline
14 & 0.02596 & 0.2011 & 0.420655 \tabularnewline
15 & -0.02691 & -0.2084 & 0.417793 \tabularnewline
16 & -0.193505 & -1.4989 & 0.069574 \tabularnewline
17 & 0.014214 & 0.1101 & 0.456348 \tabularnewline
18 & 0.030704 & 0.2378 & 0.406411 \tabularnewline
19 & -0.014355 & -0.1112 & 0.455918 \tabularnewline
20 & -0.027522 & -0.2132 & 0.415953 \tabularnewline
21 & 0.001139 & 0.0088 & 0.496495 \tabularnewline
22 & 0.181451 & 1.4055 & 0.082513 \tabularnewline
23 & -0.078503 & -0.6081 & 0.272713 \tabularnewline
24 & 0.03332 & 0.2581 & 0.398607 \tabularnewline
25 & 0.027279 & 0.2113 & 0.416683 \tabularnewline
26 & -0.072726 & -0.5633 & 0.287653 \tabularnewline
27 & 0.021866 & 0.1694 & 0.433036 \tabularnewline
28 & -0.192376 & -1.4901 & 0.070713 \tabularnewline
29 & -0.071122 & -0.5509 & 0.291872 \tabularnewline
30 & -0.11519 & -0.8923 & 0.18791 \tabularnewline
31 & -0.172321 & -1.3348 & 0.093493 \tabularnewline
32 & -0.092901 & -0.7196 & 0.237279 \tabularnewline
33 & 0.005104 & 0.0395 & 0.484296 \tabularnewline
34 & 0.019846 & 0.1537 & 0.43917 \tabularnewline
35 & 0.042929 & 0.3325 & 0.370326 \tabularnewline
36 & 0.094864 & 0.7348 & 0.232658 \tabularnewline
\hline
\end{tabular}
%Source: https://freestatistics.org/blog/index.php?pk=60464&T=2

[TABLE]
[ROW][C]Partial Autocorrelation Function[/C][/ROW]
[ROW][C]Time lag k[/C][C]PACF(k)[/C][C]T-STAT[/C][C]P-value[/C][/ROW]
[ROW][C]1[/C][C]0.620169[/C][C]4.8038[/C][C]5e-06[/C][/ROW]
[ROW][C]2[/C][C]0.30943[/C][C]2.3968[/C][C]0.009835[/C][/ROW]
[ROW][C]3[/C][C]0.159575[/C][C]1.2361[/C][C]0.110627[/C][/ROW]
[ROW][C]4[/C][C]0.199182[/C][C]1.5429[/C][C]0.064062[/C][/ROW]
[ROW][C]5[/C][C]0.030605[/C][C]0.2371[/C][C]0.406707[/C][/ROW]
[ROW][C]6[/C][C]0.083809[/C][C]0.6492[/C][C]0.25935[/C][/ROW]
[ROW][C]7[/C][C]-0.046234[/C][C]-0.3581[/C][C]0.360751[/C][/ROW]
[ROW][C]8[/C][C]-0.168912[/C][C]-1.3084[/C][C]0.097866[/C][/ROW]
[ROW][C]9[/C][C]-0.183127[/C][C]-1.4185[/C][C]0.08061[/C][/ROW]
[ROW][C]10[/C][C]0.044591[/C][C]0.3454[/C][C]0.3655[/C][/ROW]
[ROW][C]11[/C][C]-0.097475[/C][C]-0.755[/C][C]0.22659[/C][/ROW]
[ROW][C]12[/C][C]0.167446[/C][C]1.297[/C][C]0.099794[/C][/ROW]
[ROW][C]13[/C][C]-0.039861[/C][C]-0.3088[/C][C]0.379285[/C][/ROW]
[ROW][C]14[/C][C]0.02596[/C][C]0.2011[/C][C]0.420655[/C][/ROW]
[ROW][C]15[/C][C]-0.02691[/C][C]-0.2084[/C][C]0.417793[/C][/ROW]
[ROW][C]16[/C][C]-0.193505[/C][C]-1.4989[/C][C]0.069574[/C][/ROW]
[ROW][C]17[/C][C]0.014214[/C][C]0.1101[/C][C]0.456348[/C][/ROW]
[ROW][C]18[/C][C]0.030704[/C][C]0.2378[/C][C]0.406411[/C][/ROW]
[ROW][C]19[/C][C]-0.014355[/C][C]-0.1112[/C][C]0.455918[/C][/ROW]
[ROW][C]20[/C][C]-0.027522[/C][C]-0.2132[/C][C]0.415953[/C][/ROW]
[ROW][C]21[/C][C]0.001139[/C][C]0.0088[/C][C]0.496495[/C][/ROW]
[ROW][C]22[/C][C]0.181451[/C][C]1.4055[/C][C]0.082513[/C][/ROW]
[ROW][C]23[/C][C]-0.078503[/C][C]-0.6081[/C][C]0.272713[/C][/ROW]
[ROW][C]24[/C][C]0.03332[/C][C]0.2581[/C][C]0.398607[/C][/ROW]
[ROW][C]25[/C][C]0.027279[/C][C]0.2113[/C][C]0.416683[/C][/ROW]
[ROW][C]26[/C][C]-0.072726[/C][C]-0.5633[/C][C]0.287653[/C][/ROW]
[ROW][C]27[/C][C]0.021866[/C][C]0.1694[/C][C]0.433036[/C][/ROW]
[ROW][C]28[/C][C]-0.192376[/C][C]-1.4901[/C][C]0.070713[/C][/ROW]
[ROW][C]29[/C][C]-0.071122[/C][C]-0.5509[/C][C]0.291872[/C][/ROW]
[ROW][C]30[/C][C]-0.11519[/C][C]-0.8923[/C][C]0.18791[/C][/ROW]
[ROW][C]31[/C][C]-0.172321[/C][C]-1.3348[/C][C]0.093493[/C][/ROW]
[ROW][C]32[/C][C]-0.092901[/C][C]-0.7196[/C][C]0.237279[/C][/ROW]
[ROW][C]33[/C][C]0.005104[/C][C]0.0395[/C][C]0.484296[/C][/ROW]
[ROW][C]34[/C][C]0.019846[/C][C]0.1537[/C][C]0.43917[/C][/ROW]
[ROW][C]35[/C][C]0.042929[/C][C]0.3325[/C][C]0.370326[/C][/ROW]
[ROW][C]36[/C][C]0.094864[/C][C]0.7348[/C][C]0.232658[/C][/ROW]
[/TABLE]
Source: https://freestatistics.org/blog/index.php?pk=60464&T=2

Globally Unique Identifier (entire table): ba.freestatistics.org/blog/index.php?pk=60464&T=2

As an alternative you can also use a QR Code:  

The GUIDs for individual cells are displayed in the table below:

Partial Autocorrelation Function
Time lag kPACF(k)T-STATP-value
10.6201694.80385e-06
20.309432.39680.009835
30.1595751.23610.110627
40.1991821.54290.064062
50.0306050.23710.406707
60.0838090.64920.25935
7-0.046234-0.35810.360751
8-0.168912-1.30840.097866
9-0.183127-1.41850.08061
100.0445910.34540.3655
11-0.097475-0.7550.22659
120.1674461.2970.099794
13-0.039861-0.30880.379285
140.025960.20110.420655
15-0.02691-0.20840.417793
16-0.193505-1.49890.069574
170.0142140.11010.456348
180.0307040.23780.406411
19-0.014355-0.11120.455918
20-0.027522-0.21320.415953
210.0011390.00880.496495
220.1814511.40550.082513
23-0.078503-0.60810.272713
240.033320.25810.398607
250.0272790.21130.416683
26-0.072726-0.56330.287653
270.0218660.16940.433036
28-0.192376-1.49010.070713
29-0.071122-0.55090.291872
30-0.11519-0.89230.18791
31-0.172321-1.33480.093493
32-0.092901-0.71960.237279
330.0051040.03950.484296
340.0198460.15370.43917
350.0429290.33250.370326
360.0948640.73480.232658


Parameters (Session):
par1 = 36 ; par2 = 1 ; par3 = 0 ; par4 = 0 ; par5 = 12 ; par6 = White Noise ; par7 = 0.95 ;
Parameters (R input):
par1 = 36 ; par2 = 1 ; par3 = 0 ; par4 = 0 ; par5 = 12 ; par6 = White Noise ; par7 = 0.95 ;
R code (references can be found in the software module):
if (par1 == 'Default') {
par1 = 10*log10(length(x))
} else {
par1 <- as.numeric(par1)
}
par2 <- as.numeric(par2)
par3 <- as.numeric(par3)
par4 <- as.numeric(par4)
par5 <- as.numeric(par5)
if (par6 == 'White Noise') par6 <- 'white' else par6 <- 'ma'
par7 <- as.numeric(par7)
if (par2 == 0) {
x <- log(x)
} else {
x <- (x ^ par2 - 1) / par2
}
if (par3 > 0) x <- diff(x,lag=1,difference=par3)
if (par4 > 0) x <- diff(x,lag=par5,difference=par4)
bitmap(file='pic1.png')
racf <- acf(x, par1, main='Autocorrelation', xlab='time lag', ylab='ACF', ci.type=par6, ci=par7, sub=paste('(lambda=',par2,', d=',par3,', D=',par4,', CI=', par7, ', CI type=',par6,')',sep=''))
dev.off()
bitmap(file='pic2.png')
rpacf <- pacf(x,par1,main='Partial Autocorrelation',xlab='lags',ylab='PACF')
dev.off()
(myacf <- c(racf$acf))
(mypacf <- c(rpacf$acf))
lengthx <- length(x)
sqrtn <- sqrt(lengthx)
load(file='createtable')
a<-table.start()
a<-table.row.start(a)
a<-table.element(a,'Autocorrelation Function',4,TRUE)
a<-table.row.end(a)
a<-table.row.start(a)
a<-table.element(a,'Time lag k',header=TRUE)
a<-table.element(a,hyperlink('basics.htm','ACF(k)','click here for more information about the Autocorrelation Function'),header=TRUE)
a<-table.element(a,'T-STAT',header=TRUE)
a<-table.element(a,'P-value',header=TRUE)
a<-table.row.end(a)
for (i in 2:(par1+1)) {
a<-table.row.start(a)
a<-table.element(a,i-1,header=TRUE)
a<-table.element(a,round(myacf[i],6))
mytstat <- myacf[i]*sqrtn
a<-table.element(a,round(mytstat,4))
a<-table.element(a,round(1-pt(abs(mytstat),lengthx),6))
a<-table.row.end(a)
}
a<-table.end(a)
table.save(a,file='mytable.tab')
a<-table.start()
a<-table.row.start(a)
a<-table.element(a,'Partial Autocorrelation Function',4,TRUE)
a<-table.row.end(a)
a<-table.row.start(a)
a<-table.element(a,'Time lag k',header=TRUE)
a<-table.element(a,hyperlink('basics.htm','PACF(k)','click here for more information about the Partial Autocorrelation Function'),header=TRUE)
a<-table.element(a,'T-STAT',header=TRUE)
a<-table.element(a,'P-value',header=TRUE)
a<-table.row.end(a)
for (i in 1:par1) {
a<-table.row.start(a)
a<-table.element(a,i,header=TRUE)
a<-table.element(a,round(mypacf[i],6))
mytstat <- mypacf[i]*sqrtn
a<-table.element(a,round(mytstat,4))
a<-table.element(a,round(1-pt(abs(mytstat),lengthx),6))
a<-table.row.end(a)
}
a<-table.end(a)
table.save(a,file='mytable1.tab')