Free Statistics

of Irreproducible Research!

Author's title

Author*The author of this computation has been verified*
R Software Modulerwasp_autocorrelation.wasp
Title produced by software(Partial) Autocorrelation Function
Date of computationFri, 27 Nov 2009 01:38:40 -0700
Cite this page as followsStatistical Computations at FreeStatistics.org, Office for Research Development and Education, URL https://freestatistics.org/blog/index.php?v=date/2009/Nov/27/t1259311173yxhixt3q5mklvup.htm/, Retrieved Sun, 28 Apr 2024 20:44:27 +0000
Statistical Computations at FreeStatistics.org, Office for Research Development and Education, URL https://freestatistics.org/blog/index.php?pk=60476, Retrieved Sun, 28 Apr 2024 20:44:27 +0000
QR Codes:

Original text written by user:
IsPrivate?No (this computation is public)
User-defined keywordsIntegration
Estimated Impact179
Family? (F = Feedback message, R = changed R code, M = changed R Module, P = changed Parameters, D = changed Data)
-       [(Partial) Autocorrelation Function] [Identifying Integ...] [2009-11-27 08:38:40] [64e929ed9a52e44aa31e1ff8e49d1c0b] [Current]
Feedback Forum

Post a new message
Dataseries X:
699.8
871.2
842.6
809.2
847.1
857
839.9
967.4
1037.2
1062.3
899.3
1129.6
845.7
1173.9
1073.8
1024.7
912.9
1055
936.4
920.6
1059.3
1164.1
823.9
1076.6
833.5
996
852.8
758.5
760.4
826.8
941.7
1097.8
802.8
839.7
791
1063.1
1138.4
888.6
931.1
863.2
936.2
701.7
873.8
696.8
658.1
706.7
458.5
685.7
660.1
774.9
787.4
486.9
310.8
619.5
550.2
463.4
630.4
729
485.6
453.7


Summary of computational transaction
Raw Inputview raw input (R code)
Raw Outputview raw output of R engine
Computing time2 seconds
R Server'Gwilym Jenkins' @ 72.249.127.135

\begin{tabular}{lllllllll}
\hline
Summary of computational transaction \tabularnewline
Raw Input & view raw input (R code)  \tabularnewline
Raw Output & view raw output of R engine  \tabularnewline
Computing time & 2 seconds \tabularnewline
R Server & 'Gwilym Jenkins' @ 72.249.127.135 \tabularnewline
\hline
\end{tabular}
%Source: https://freestatistics.org/blog/index.php?pk=60476&T=0

[TABLE]
[ROW][C]Summary of computational transaction[/C][/ROW]
[ROW][C]Raw Input[/C][C]view raw input (R code) [/C][/ROW]
[ROW][C]Raw Output[/C][C]view raw output of R engine [/C][/ROW]
[ROW][C]Computing time[/C][C]2 seconds[/C][/ROW]
[ROW][C]R Server[/C][C]'Gwilym Jenkins' @ 72.249.127.135[/C][/ROW]
[/TABLE]
Source: https://freestatistics.org/blog/index.php?pk=60476&T=0

Globally Unique Identifier (entire table): ba.freestatistics.org/blog/index.php?pk=60476&T=0

As an alternative you can also use a QR Code:  

The GUIDs for individual cells are displayed in the table below:

Summary of computational transaction
Raw Inputview raw input (R code)
Raw Outputview raw output of R engine
Computing time2 seconds
R Server'Gwilym Jenkins' @ 72.249.127.135


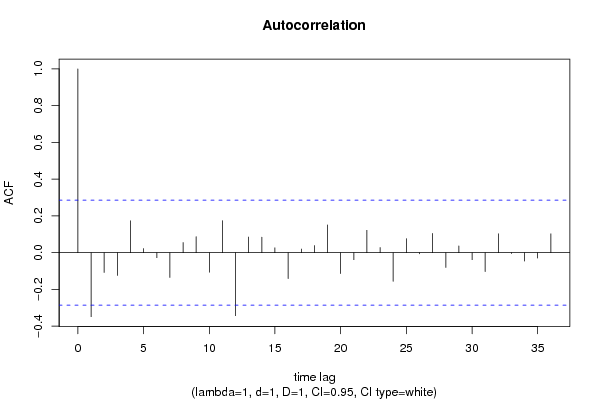
Autocorrelation Function
Time lag kACF(k)T-STATP-value
1-0.347995-2.38570.010563
2-0.107332-0.73580.232746
3-0.123734-0.84830.200291
40.1738281.19170.11968
50.0227820.15620.438277
6-0.026844-0.1840.42739
7-0.13448-0.9220.180631
80.0549620.37680.354009
90.0872990.59850.276193
10-0.10618-0.72790.235132
110.1743921.19560.118931
12-0.342498-2.3480.011566
130.084790.58130.281911
140.0843350.57820.282955
150.0266440.18270.427924
16-0.140404-0.96260.170348
170.0201790.13830.445281
180.0388870.26660.395474
190.1510731.03570.15282
20-0.11355-0.77850.220099
21-0.038316-0.26270.396971
220.1218550.83540.203861
230.028060.19240.424141
24-0.155472-1.06590.145965
250.0760630.52150.302248
26-0.005932-0.04070.483866
270.104960.71960.237677
28-0.080241-0.55010.292427
290.0371280.25450.400094
30-0.037709-0.25850.398567
31-0.102834-0.7050.242146
320.1024950.70270.242863
33-0.004888-0.03350.486704
34-0.045483-0.31180.378281
35-0.029347-0.20120.420709
360.1026320.70360.242574

\begin{tabular}{lllllllll}
\hline
Autocorrelation Function \tabularnewline
Time lag k & ACF(k) & T-STAT & P-value \tabularnewline
1 & -0.347995 & -2.3857 & 0.010563 \tabularnewline
2 & -0.107332 & -0.7358 & 0.232746 \tabularnewline
3 & -0.123734 & -0.8483 & 0.200291 \tabularnewline
4 & 0.173828 & 1.1917 & 0.11968 \tabularnewline
5 & 0.022782 & 0.1562 & 0.438277 \tabularnewline
6 & -0.026844 & -0.184 & 0.42739 \tabularnewline
7 & -0.13448 & -0.922 & 0.180631 \tabularnewline
8 & 0.054962 & 0.3768 & 0.354009 \tabularnewline
9 & 0.087299 & 0.5985 & 0.276193 \tabularnewline
10 & -0.10618 & -0.7279 & 0.235132 \tabularnewline
11 & 0.174392 & 1.1956 & 0.118931 \tabularnewline
12 & -0.342498 & -2.348 & 0.011566 \tabularnewline
13 & 0.08479 & 0.5813 & 0.281911 \tabularnewline
14 & 0.084335 & 0.5782 & 0.282955 \tabularnewline
15 & 0.026644 & 0.1827 & 0.427924 \tabularnewline
16 & -0.140404 & -0.9626 & 0.170348 \tabularnewline
17 & 0.020179 & 0.1383 & 0.445281 \tabularnewline
18 & 0.038887 & 0.2666 & 0.395474 \tabularnewline
19 & 0.151073 & 1.0357 & 0.15282 \tabularnewline
20 & -0.11355 & -0.7785 & 0.220099 \tabularnewline
21 & -0.038316 & -0.2627 & 0.396971 \tabularnewline
22 & 0.121855 & 0.8354 & 0.203861 \tabularnewline
23 & 0.02806 & 0.1924 & 0.424141 \tabularnewline
24 & -0.155472 & -1.0659 & 0.145965 \tabularnewline
25 & 0.076063 & 0.5215 & 0.302248 \tabularnewline
26 & -0.005932 & -0.0407 & 0.483866 \tabularnewline
27 & 0.10496 & 0.7196 & 0.237677 \tabularnewline
28 & -0.080241 & -0.5501 & 0.292427 \tabularnewline
29 & 0.037128 & 0.2545 & 0.400094 \tabularnewline
30 & -0.037709 & -0.2585 & 0.398567 \tabularnewline
31 & -0.102834 & -0.705 & 0.242146 \tabularnewline
32 & 0.102495 & 0.7027 & 0.242863 \tabularnewline
33 & -0.004888 & -0.0335 & 0.486704 \tabularnewline
34 & -0.045483 & -0.3118 & 0.378281 \tabularnewline
35 & -0.029347 & -0.2012 & 0.420709 \tabularnewline
36 & 0.102632 & 0.7036 & 0.242574 \tabularnewline
\hline
\end{tabular}
%Source: https://freestatistics.org/blog/index.php?pk=60476&T=1

[TABLE]
[ROW][C]Autocorrelation Function[/C][/ROW]
[ROW][C]Time lag k[/C][C]ACF(k)[/C][C]T-STAT[/C][C]P-value[/C][/ROW]
[ROW][C]1[/C][C]-0.347995[/C][C]-2.3857[/C][C]0.010563[/C][/ROW]
[ROW][C]2[/C][C]-0.107332[/C][C]-0.7358[/C][C]0.232746[/C][/ROW]
[ROW][C]3[/C][C]-0.123734[/C][C]-0.8483[/C][C]0.200291[/C][/ROW]
[ROW][C]4[/C][C]0.173828[/C][C]1.1917[/C][C]0.11968[/C][/ROW]
[ROW][C]5[/C][C]0.022782[/C][C]0.1562[/C][C]0.438277[/C][/ROW]
[ROW][C]6[/C][C]-0.026844[/C][C]-0.184[/C][C]0.42739[/C][/ROW]
[ROW][C]7[/C][C]-0.13448[/C][C]-0.922[/C][C]0.180631[/C][/ROW]
[ROW][C]8[/C][C]0.054962[/C][C]0.3768[/C][C]0.354009[/C][/ROW]
[ROW][C]9[/C][C]0.087299[/C][C]0.5985[/C][C]0.276193[/C][/ROW]
[ROW][C]10[/C][C]-0.10618[/C][C]-0.7279[/C][C]0.235132[/C][/ROW]
[ROW][C]11[/C][C]0.174392[/C][C]1.1956[/C][C]0.118931[/C][/ROW]
[ROW][C]12[/C][C]-0.342498[/C][C]-2.348[/C][C]0.011566[/C][/ROW]
[ROW][C]13[/C][C]0.08479[/C][C]0.5813[/C][C]0.281911[/C][/ROW]
[ROW][C]14[/C][C]0.084335[/C][C]0.5782[/C][C]0.282955[/C][/ROW]
[ROW][C]15[/C][C]0.026644[/C][C]0.1827[/C][C]0.427924[/C][/ROW]
[ROW][C]16[/C][C]-0.140404[/C][C]-0.9626[/C][C]0.170348[/C][/ROW]
[ROW][C]17[/C][C]0.020179[/C][C]0.1383[/C][C]0.445281[/C][/ROW]
[ROW][C]18[/C][C]0.038887[/C][C]0.2666[/C][C]0.395474[/C][/ROW]
[ROW][C]19[/C][C]0.151073[/C][C]1.0357[/C][C]0.15282[/C][/ROW]
[ROW][C]20[/C][C]-0.11355[/C][C]-0.7785[/C][C]0.220099[/C][/ROW]
[ROW][C]21[/C][C]-0.038316[/C][C]-0.2627[/C][C]0.396971[/C][/ROW]
[ROW][C]22[/C][C]0.121855[/C][C]0.8354[/C][C]0.203861[/C][/ROW]
[ROW][C]23[/C][C]0.02806[/C][C]0.1924[/C][C]0.424141[/C][/ROW]
[ROW][C]24[/C][C]-0.155472[/C][C]-1.0659[/C][C]0.145965[/C][/ROW]
[ROW][C]25[/C][C]0.076063[/C][C]0.5215[/C][C]0.302248[/C][/ROW]
[ROW][C]26[/C][C]-0.005932[/C][C]-0.0407[/C][C]0.483866[/C][/ROW]
[ROW][C]27[/C][C]0.10496[/C][C]0.7196[/C][C]0.237677[/C][/ROW]
[ROW][C]28[/C][C]-0.080241[/C][C]-0.5501[/C][C]0.292427[/C][/ROW]
[ROW][C]29[/C][C]0.037128[/C][C]0.2545[/C][C]0.400094[/C][/ROW]
[ROW][C]30[/C][C]-0.037709[/C][C]-0.2585[/C][C]0.398567[/C][/ROW]
[ROW][C]31[/C][C]-0.102834[/C][C]-0.705[/C][C]0.242146[/C][/ROW]
[ROW][C]32[/C][C]0.102495[/C][C]0.7027[/C][C]0.242863[/C][/ROW]
[ROW][C]33[/C][C]-0.004888[/C][C]-0.0335[/C][C]0.486704[/C][/ROW]
[ROW][C]34[/C][C]-0.045483[/C][C]-0.3118[/C][C]0.378281[/C][/ROW]
[ROW][C]35[/C][C]-0.029347[/C][C]-0.2012[/C][C]0.420709[/C][/ROW]
[ROW][C]36[/C][C]0.102632[/C][C]0.7036[/C][C]0.242574[/C][/ROW]
[/TABLE]
Source: https://freestatistics.org/blog/index.php?pk=60476&T=1

Globally Unique Identifier (entire table): ba.freestatistics.org/blog/index.php?pk=60476&T=1

As an alternative you can also use a QR Code:  

The GUIDs for individual cells are displayed in the table below:

Autocorrelation Function
Time lag kACF(k)T-STATP-value
1-0.347995-2.38570.010563
2-0.107332-0.73580.232746
3-0.123734-0.84830.200291
40.1738281.19170.11968
50.0227820.15620.438277
6-0.026844-0.1840.42739
7-0.13448-0.9220.180631
80.0549620.37680.354009
90.0872990.59850.276193
10-0.10618-0.72790.235132
110.1743921.19560.118931
12-0.342498-2.3480.011566
130.084790.58130.281911
140.0843350.57820.282955
150.0266440.18270.427924
16-0.140404-0.96260.170348
170.0201790.13830.445281
180.0388870.26660.395474
190.1510731.03570.15282
20-0.11355-0.77850.220099
21-0.038316-0.26270.396971
220.1218550.83540.203861
230.028060.19240.424141
24-0.155472-1.06590.145965
250.0760630.52150.302248
26-0.005932-0.04070.483866
270.104960.71960.237677
28-0.080241-0.55010.292427
290.0371280.25450.400094
30-0.037709-0.25850.398567
31-0.102834-0.7050.242146
320.1024950.70270.242863
33-0.004888-0.03350.486704
34-0.045483-0.31180.378281
35-0.029347-0.20120.420709
360.1026320.70360.242574


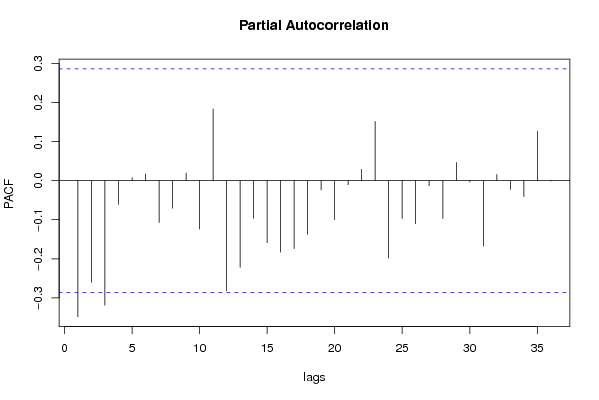
Partial Autocorrelation Function
Time lag kPACF(k)T-STATP-value
1-0.347995-2.38570.010563
2-0.259907-1.78180.040619
3-0.318768-2.18540.01694
4-0.060441-0.41440.340246
50.0077370.0530.478961
60.0168790.11570.454186
7-0.107061-0.7340.233305
8-0.070386-0.48250.315829
90.0190730.13080.448262
10-0.123768-0.84850.200227
110.1832381.25620.107623
12-0.282422-1.93620.029436
13-0.221661-1.51960.067651
14-0.096028-0.65830.256767
15-0.15866-1.08770.141133
16-0.182568-1.25160.10845
17-0.173731-1.1910.11981
18-0.137564-0.94310.175228
19-0.023763-0.16290.435643
20-0.09961-0.68290.249014
21-0.010208-0.070.472254
220.0289440.19840.421782
230.151471.03840.152192
24-0.198099-1.35810.090459
25-0.096961-0.66470.254735
26-0.110029-0.75430.227209
27-0.01289-0.08840.46498
28-0.097033-0.66520.254579
290.0464520.31850.375773
30-0.003708-0.02540.489913
31-0.167168-1.1460.128788
320.0160410.110.45645
33-0.022508-0.15430.439014
34-0.040613-0.27840.390952
350.1264050.86660.195286
36-0.001109-0.00760.496984

\begin{tabular}{lllllllll}
\hline
Partial Autocorrelation Function \tabularnewline
Time lag k & PACF(k) & T-STAT & P-value \tabularnewline
1 & -0.347995 & -2.3857 & 0.010563 \tabularnewline
2 & -0.259907 & -1.7818 & 0.040619 \tabularnewline
3 & -0.318768 & -2.1854 & 0.01694 \tabularnewline
4 & -0.060441 & -0.4144 & 0.340246 \tabularnewline
5 & 0.007737 & 0.053 & 0.478961 \tabularnewline
6 & 0.016879 & 0.1157 & 0.454186 \tabularnewline
7 & -0.107061 & -0.734 & 0.233305 \tabularnewline
8 & -0.070386 & -0.4825 & 0.315829 \tabularnewline
9 & 0.019073 & 0.1308 & 0.448262 \tabularnewline
10 & -0.123768 & -0.8485 & 0.200227 \tabularnewline
11 & 0.183238 & 1.2562 & 0.107623 \tabularnewline
12 & -0.282422 & -1.9362 & 0.029436 \tabularnewline
13 & -0.221661 & -1.5196 & 0.067651 \tabularnewline
14 & -0.096028 & -0.6583 & 0.256767 \tabularnewline
15 & -0.15866 & -1.0877 & 0.141133 \tabularnewline
16 & -0.182568 & -1.2516 & 0.10845 \tabularnewline
17 & -0.173731 & -1.191 & 0.11981 \tabularnewline
18 & -0.137564 & -0.9431 & 0.175228 \tabularnewline
19 & -0.023763 & -0.1629 & 0.435643 \tabularnewline
20 & -0.09961 & -0.6829 & 0.249014 \tabularnewline
21 & -0.010208 & -0.07 & 0.472254 \tabularnewline
22 & 0.028944 & 0.1984 & 0.421782 \tabularnewline
23 & 0.15147 & 1.0384 & 0.152192 \tabularnewline
24 & -0.198099 & -1.3581 & 0.090459 \tabularnewline
25 & -0.096961 & -0.6647 & 0.254735 \tabularnewline
26 & -0.110029 & -0.7543 & 0.227209 \tabularnewline
27 & -0.01289 & -0.0884 & 0.46498 \tabularnewline
28 & -0.097033 & -0.6652 & 0.254579 \tabularnewline
29 & 0.046452 & 0.3185 & 0.375773 \tabularnewline
30 & -0.003708 & -0.0254 & 0.489913 \tabularnewline
31 & -0.167168 & -1.146 & 0.128788 \tabularnewline
32 & 0.016041 & 0.11 & 0.45645 \tabularnewline
33 & -0.022508 & -0.1543 & 0.439014 \tabularnewline
34 & -0.040613 & -0.2784 & 0.390952 \tabularnewline
35 & 0.126405 & 0.8666 & 0.195286 \tabularnewline
36 & -0.001109 & -0.0076 & 0.496984 \tabularnewline
\hline
\end{tabular}
%Source: https://freestatistics.org/blog/index.php?pk=60476&T=2

[TABLE]
[ROW][C]Partial Autocorrelation Function[/C][/ROW]
[ROW][C]Time lag k[/C][C]PACF(k)[/C][C]T-STAT[/C][C]P-value[/C][/ROW]
[ROW][C]1[/C][C]-0.347995[/C][C]-2.3857[/C][C]0.010563[/C][/ROW]
[ROW][C]2[/C][C]-0.259907[/C][C]-1.7818[/C][C]0.040619[/C][/ROW]
[ROW][C]3[/C][C]-0.318768[/C][C]-2.1854[/C][C]0.01694[/C][/ROW]
[ROW][C]4[/C][C]-0.060441[/C][C]-0.4144[/C][C]0.340246[/C][/ROW]
[ROW][C]5[/C][C]0.007737[/C][C]0.053[/C][C]0.478961[/C][/ROW]
[ROW][C]6[/C][C]0.016879[/C][C]0.1157[/C][C]0.454186[/C][/ROW]
[ROW][C]7[/C][C]-0.107061[/C][C]-0.734[/C][C]0.233305[/C][/ROW]
[ROW][C]8[/C][C]-0.070386[/C][C]-0.4825[/C][C]0.315829[/C][/ROW]
[ROW][C]9[/C][C]0.019073[/C][C]0.1308[/C][C]0.448262[/C][/ROW]
[ROW][C]10[/C][C]-0.123768[/C][C]-0.8485[/C][C]0.200227[/C][/ROW]
[ROW][C]11[/C][C]0.183238[/C][C]1.2562[/C][C]0.107623[/C][/ROW]
[ROW][C]12[/C][C]-0.282422[/C][C]-1.9362[/C][C]0.029436[/C][/ROW]
[ROW][C]13[/C][C]-0.221661[/C][C]-1.5196[/C][C]0.067651[/C][/ROW]
[ROW][C]14[/C][C]-0.096028[/C][C]-0.6583[/C][C]0.256767[/C][/ROW]
[ROW][C]15[/C][C]-0.15866[/C][C]-1.0877[/C][C]0.141133[/C][/ROW]
[ROW][C]16[/C][C]-0.182568[/C][C]-1.2516[/C][C]0.10845[/C][/ROW]
[ROW][C]17[/C][C]-0.173731[/C][C]-1.191[/C][C]0.11981[/C][/ROW]
[ROW][C]18[/C][C]-0.137564[/C][C]-0.9431[/C][C]0.175228[/C][/ROW]
[ROW][C]19[/C][C]-0.023763[/C][C]-0.1629[/C][C]0.435643[/C][/ROW]
[ROW][C]20[/C][C]-0.09961[/C][C]-0.6829[/C][C]0.249014[/C][/ROW]
[ROW][C]21[/C][C]-0.010208[/C][C]-0.07[/C][C]0.472254[/C][/ROW]
[ROW][C]22[/C][C]0.028944[/C][C]0.1984[/C][C]0.421782[/C][/ROW]
[ROW][C]23[/C][C]0.15147[/C][C]1.0384[/C][C]0.152192[/C][/ROW]
[ROW][C]24[/C][C]-0.198099[/C][C]-1.3581[/C][C]0.090459[/C][/ROW]
[ROW][C]25[/C][C]-0.096961[/C][C]-0.6647[/C][C]0.254735[/C][/ROW]
[ROW][C]26[/C][C]-0.110029[/C][C]-0.7543[/C][C]0.227209[/C][/ROW]
[ROW][C]27[/C][C]-0.01289[/C][C]-0.0884[/C][C]0.46498[/C][/ROW]
[ROW][C]28[/C][C]-0.097033[/C][C]-0.6652[/C][C]0.254579[/C][/ROW]
[ROW][C]29[/C][C]0.046452[/C][C]0.3185[/C][C]0.375773[/C][/ROW]
[ROW][C]30[/C][C]-0.003708[/C][C]-0.0254[/C][C]0.489913[/C][/ROW]
[ROW][C]31[/C][C]-0.167168[/C][C]-1.146[/C][C]0.128788[/C][/ROW]
[ROW][C]32[/C][C]0.016041[/C][C]0.11[/C][C]0.45645[/C][/ROW]
[ROW][C]33[/C][C]-0.022508[/C][C]-0.1543[/C][C]0.439014[/C][/ROW]
[ROW][C]34[/C][C]-0.040613[/C][C]-0.2784[/C][C]0.390952[/C][/ROW]
[ROW][C]35[/C][C]0.126405[/C][C]0.8666[/C][C]0.195286[/C][/ROW]
[ROW][C]36[/C][C]-0.001109[/C][C]-0.0076[/C][C]0.496984[/C][/ROW]
[/TABLE]
Source: https://freestatistics.org/blog/index.php?pk=60476&T=2

Globally Unique Identifier (entire table): ba.freestatistics.org/blog/index.php?pk=60476&T=2

As an alternative you can also use a QR Code:  

The GUIDs for individual cells are displayed in the table below:

Partial Autocorrelation Function
Time lag kPACF(k)T-STATP-value
1-0.347995-2.38570.010563
2-0.259907-1.78180.040619
3-0.318768-2.18540.01694
4-0.060441-0.41440.340246
50.0077370.0530.478961
60.0168790.11570.454186
7-0.107061-0.7340.233305
8-0.070386-0.48250.315829
90.0190730.13080.448262
10-0.123768-0.84850.200227
110.1832381.25620.107623
12-0.282422-1.93620.029436
13-0.221661-1.51960.067651
14-0.096028-0.65830.256767
15-0.15866-1.08770.141133
16-0.182568-1.25160.10845
17-0.173731-1.1910.11981
18-0.137564-0.94310.175228
19-0.023763-0.16290.435643
20-0.09961-0.68290.249014
21-0.010208-0.070.472254
220.0289440.19840.421782
230.151471.03840.152192
24-0.198099-1.35810.090459
25-0.096961-0.66470.254735
26-0.110029-0.75430.227209
27-0.01289-0.08840.46498
28-0.097033-0.66520.254579
290.0464520.31850.375773
30-0.003708-0.02540.489913
31-0.167168-1.1460.128788
320.0160410.110.45645
33-0.022508-0.15430.439014
34-0.040613-0.27840.390952
350.1264050.86660.195286
36-0.001109-0.00760.496984


Parameters (Session):
par1 = 36 ; par2 = 1 ; par3 = 1 ; par4 = 1 ; par5 = 12 ; par6 = White Noise ; par7 = 0.95 ;
Parameters (R input):
par1 = 36 ; par2 = 1 ; par3 = 1 ; par4 = 1 ; par5 = 12 ; par6 = White Noise ; par7 = 0.95 ;
R code (references can be found in the software module):
if (par1 == 'Default') {
par1 = 10*log10(length(x))
} else {
par1 <- as.numeric(par1)
}
par2 <- as.numeric(par2)
par3 <- as.numeric(par3)
par4 <- as.numeric(par4)
par5 <- as.numeric(par5)
if (par6 == 'White Noise') par6 <- 'white' else par6 <- 'ma'
par7 <- as.numeric(par7)
if (par2 == 0) {
x <- log(x)
} else {
x <- (x ^ par2 - 1) / par2
}
if (par3 > 0) x <- diff(x,lag=1,difference=par3)
if (par4 > 0) x <- diff(x,lag=par5,difference=par4)
bitmap(file='pic1.png')
racf <- acf(x, par1, main='Autocorrelation', xlab='time lag', ylab='ACF', ci.type=par6, ci=par7, sub=paste('(lambda=',par2,', d=',par3,', D=',par4,', CI=', par7, ', CI type=',par6,')',sep=''))
dev.off()
bitmap(file='pic2.png')
rpacf <- pacf(x,par1,main='Partial Autocorrelation',xlab='lags',ylab='PACF')
dev.off()
(myacf <- c(racf$acf))
(mypacf <- c(rpacf$acf))
lengthx <- length(x)
sqrtn <- sqrt(lengthx)
load(file='createtable')
a<-table.start()
a<-table.row.start(a)
a<-table.element(a,'Autocorrelation Function',4,TRUE)
a<-table.row.end(a)
a<-table.row.start(a)
a<-table.element(a,'Time lag k',header=TRUE)
a<-table.element(a,hyperlink('basics.htm','ACF(k)','click here for more information about the Autocorrelation Function'),header=TRUE)
a<-table.element(a,'T-STAT',header=TRUE)
a<-table.element(a,'P-value',header=TRUE)
a<-table.row.end(a)
for (i in 2:(par1+1)) {
a<-table.row.start(a)
a<-table.element(a,i-1,header=TRUE)
a<-table.element(a,round(myacf[i],6))
mytstat <- myacf[i]*sqrtn
a<-table.element(a,round(mytstat,4))
a<-table.element(a,round(1-pt(abs(mytstat),lengthx),6))
a<-table.row.end(a)
}
a<-table.end(a)
table.save(a,file='mytable.tab')
a<-table.start()
a<-table.row.start(a)
a<-table.element(a,'Partial Autocorrelation Function',4,TRUE)
a<-table.row.end(a)
a<-table.row.start(a)
a<-table.element(a,'Time lag k',header=TRUE)
a<-table.element(a,hyperlink('basics.htm','PACF(k)','click here for more information about the Partial Autocorrelation Function'),header=TRUE)
a<-table.element(a,'T-STAT',header=TRUE)
a<-table.element(a,'P-value',header=TRUE)
a<-table.row.end(a)
for (i in 1:par1) {
a<-table.row.start(a)
a<-table.element(a,i,header=TRUE)
a<-table.element(a,round(mypacf[i],6))
mytstat <- mypacf[i]*sqrtn
a<-table.element(a,round(mytstat,4))
a<-table.element(a,round(1-pt(abs(mytstat),lengthx),6))
a<-table.row.end(a)
}
a<-table.end(a)
table.save(a,file='mytable1.tab')