Free Statistics

of Irreproducible Research!

Author's title

Author*Unverified author*
R Software Modulerwasp_centraltendency.wasp
Title produced by softwareCentral Tendency
Date of computationFri, 27 Nov 2009 02:18:20 -0700
Cite this page as followsStatistical Computations at FreeStatistics.org, Office for Research Development and Education, URL https://freestatistics.org/blog/index.php?v=date/2009/Nov/27/t1259313584qv9yl93j8in0can.htm/, Retrieved Mon, 29 Apr 2024 03:26:56 +0000
Statistical Computations at FreeStatistics.org, Office for Research Development and Education, URL https://freestatistics.org/blog/index.php?pk=60492, Retrieved Mon, 29 Apr 2024 03:26:56 +0000
QR Codes:

Original text written by user:
IsPrivate?No (this computation is public)
User-defined keywordsKDGP1W52
Estimated Impact154
Family? (F = Feedback message, R = changed R code, M = changed R Module, P = changed Parameters, D = changed Data)
-       [Central Tendency] [] [2009-11-27 09:18:20] [4e439c7dbc0101c2aa978a927cba4423] [Current]
Feedback Forum

Post a new message
Dataseries X:
929
978
927
982
1002
983
982
897
872
927
1019
928
867
975
986
856
834
798
907
938
876
987
943
912
1022
1044
1007
964
986
978
914
927
847
823
937
916
1024
1033
1196
938
917
816
1099
1138
829
729
914
967
937
944
865
976
954
918
889
892
928
927
838
829
1007
928
967
927
926
927
936
827
929
867
927
983


Summary of computational transaction
Raw Inputview raw input (R code)
Raw Outputview raw output of R engine
Computing time1 seconds
R Server'Gwilym Jenkins' @ 72.249.127.135

\begin{tabular}{lllllllll}
\hline
Summary of computational transaction \tabularnewline
Raw Input & view raw input (R code)  \tabularnewline
Raw Output & view raw output of R engine  \tabularnewline
Computing time & 1 seconds \tabularnewline
R Server & 'Gwilym Jenkins' @ 72.249.127.135 \tabularnewline
\hline
\end{tabular}
%Source: https://freestatistics.org/blog/index.php?pk=60492&T=0

[TABLE]
[ROW][C]Summary of computational transaction[/C][/ROW]
[ROW][C]Raw Input[/C][C]view raw input (R code) [/C][/ROW]
[ROW][C]Raw Output[/C][C]view raw output of R engine [/C][/ROW]
[ROW][C]Computing time[/C][C]1 seconds[/C][/ROW]
[ROW][C]R Server[/C][C]'Gwilym Jenkins' @ 72.249.127.135[/C][/ROW]
[/TABLE]
Source: https://freestatistics.org/blog/index.php?pk=60492&T=0

Globally Unique Identifier (entire table): ba.freestatistics.org/blog/index.php?pk=60492&T=0

As an alternative you can also use a QR Code:  

The GUIDs for individual cells are displayed in the table below:

Summary of computational transaction
Raw Inputview raw input (R code)
Raw Outputview raw output of R engine
Computing time1 seconds
R Server'Gwilym Jenkins' @ 72.249.127.135


Central Tendency - Ungrouped Data
MeasureValueS.E.Value/S.E.
Arithmetic Mean934.9722222222228.94483992457661104.526434246556
Geometric Mean931.970687223687
Harmonic Mean928.987673666957
Quadratic Mean938.005212020582
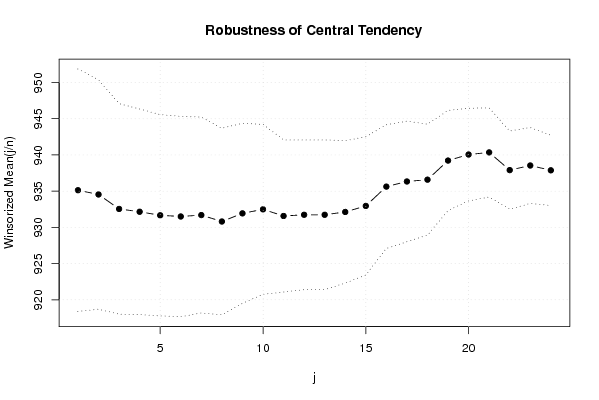
Winsorized Mean ( 1 / 24 )935.1258.37351667428463111.676495834994
Winsorized Mean ( 2 / 24 )934.5416666666677.9189936659118118.012680157771
Winsorized Mean ( 3 / 24 )932.5416666666677.27102040129557128.254579852438
Winsorized Mean ( 4 / 24 )932.1527777777787.09707062610468131.343314289293
Winsorized Mean ( 5 / 24 )931.6666666666676.94703863908177134.109901365081
Winsorized Mean ( 6 / 24 )931.56.91607978730821134.686126916784
Winsorized Mean ( 7 / 24 )931.6944444444446.7624758319346137.774162540394
Winsorized Mean ( 8 / 24 )930.8055555555566.43957829204502144.544489303811
Winsorized Mean ( 9 / 24 )931.9305555555566.2170674262223149.898737083800
Winsorized Mean ( 10 / 24 )932.4861111111115.86480421032887158.996972050465
Winsorized Mean ( 11 / 24 )931.5694444444445.2528711274621177.344812358747
Winsorized Mean ( 12 / 24 )931.7361111111115.16901328867927180.254152789996
Winsorized Mean ( 13 / 24 )931.7361111111115.16901328867927180.254152789996
Winsorized Mean ( 14 / 24 )932.1254.91376884046527189.696550705413
Winsorized Mean ( 15 / 24 )932.9583333333334.77188712043159195.511400372135
Winsorized Mean ( 16 / 24 )935.6254.27252557221817218.986401411812
Winsorized Mean ( 17 / 24 )936.3333333333334.16497618289335224.811209528424
Winsorized Mean ( 18 / 24 )936.5833333333333.82662967625380244.754108071997
Winsorized Mean ( 19 / 24 )939.2222222222223.46038514404934271.421296510118
Winsorized Mean ( 20 / 24 )940.0555555555563.19537817203529294.192269253936
Winsorized Mean ( 21 / 24 )940.3472222222223.07789837718446305.516007023732
Winsorized Mean ( 22 / 24 )937.9027777777782.69789227722746347.642782365511
Winsorized Mean ( 23 / 24 )938.5416666666672.61929292415629358.318711897786
Winsorized Mean ( 24 / 24 )937.8752.42653703124561386.507598245291
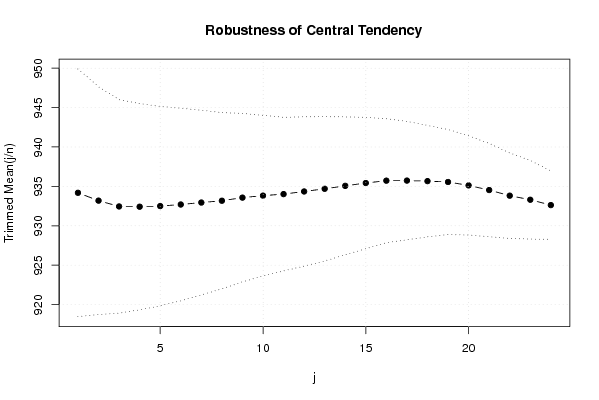
Trimmed Mean ( 1 / 24 )934.1857142857147.8601727641875118.850531955487
Trimmed Mean ( 2 / 24 )933.1911764705887.23150534825343129.045216940339
Trimmed Mean ( 3 / 24 )932.4545454545456.77635343548447137.604178166347
Trimmed Mean ( 4 / 24 )932.4218756.54217107122313142.524838444140
Trimmed Mean ( 5 / 24 )932.56.3257989548128147.412209376419
Trimmed Mean ( 6 / 24 )932.76.11224112134197152.595419827813
Trimmed Mean ( 7 / 24 )932.9482758620695.85984842822839159.210308472796
Trimmed Mean ( 8 / 24 )933.1785714285715.59226664212826166.869470135535
Trimmed Mean ( 9 / 24 )933.5740740740745.34632862865974174.619657510300
Trimmed Mean ( 10 / 24 )933.8269230769235.09766760863725183.187095505146
Trimmed Mean ( 11 / 24 )934.024.87429660022231191.621494670103
Trimmed Mean ( 12 / 24 )934.3541666666674.73747785632031197.22607577366
Trimmed Mean ( 13 / 24 )934.6956521739134.58013665230998204.075931162993
Trimmed Mean ( 14 / 24 )935.0681818181824.37431936442455213.763126081488
Trimmed Mean ( 15 / 24 )935.4285714285714.16850963057969224.403600885645
Trimmed Mean ( 16 / 24 )935.7253.93244027779972237.950212564590
Trimmed Mean ( 17 / 24 )935.7368421052633.75260634140093249.356515705277
Trimmed Mean ( 18 / 24 )935.6666666666673.53508492073746264.680110279069
Trimmed Mean ( 19 / 24 )935.5588235294123.33222562070632280.760947792937
Trimmed Mean ( 20 / 24 )935.1253.14878048590039296.980054401157
Trimmed Mean ( 21 / 24 )934.5333333333332.95939312407717315.785464840785
Trimmed Mean ( 22 / 24 )933.8214285714292.70852737836169344.770902458542
Trimmed Mean ( 23 / 24 )933.3076923076922.49477560623071374.104865374166
Trimmed Mean ( 24 / 24 )932.6252.17013031399272429.755298097333
Median928
Midrange962.5
Midmean - Weighted Average at Xnp934.486486486486
Midmean - Weighted Average at X(n+1)p935.666666666667
Midmean - Empirical Distribution Function934.486486486486
Midmean - Empirical Distribution Function - Averaging935.666666666667
Midmean - Empirical Distribution Function - Interpolation935.666666666667
Midmean - Closest Observation934.486486486486
Midmean - True Basic - Statistics Graphics Toolkit935.666666666667
Midmean - MS Excel (old versions)936.923076923077
Number of observations72

\begin{tabular}{lllllllll}
\hline
Central Tendency - Ungrouped Data \tabularnewline
Measure & Value & S.E. & Value/S.E. \tabularnewline
Arithmetic Mean & 934.972222222222 & 8.94483992457661 & 104.526434246556 \tabularnewline
Geometric Mean & 931.970687223687 &  &  \tabularnewline
Harmonic Mean & 928.987673666957 &  &  \tabularnewline
Quadratic Mean & 938.005212020582 &  &  \tabularnewline
Winsorized Mean ( 1 / 24 ) & 935.125 & 8.37351667428463 & 111.676495834994 \tabularnewline
Winsorized Mean ( 2 / 24 ) & 934.541666666667 & 7.9189936659118 & 118.012680157771 \tabularnewline
Winsorized Mean ( 3 / 24 ) & 932.541666666667 & 7.27102040129557 & 128.254579852438 \tabularnewline
Winsorized Mean ( 4 / 24 ) & 932.152777777778 & 7.09707062610468 & 131.343314289293 \tabularnewline
Winsorized Mean ( 5 / 24 ) & 931.666666666667 & 6.94703863908177 & 134.109901365081 \tabularnewline
Winsorized Mean ( 6 / 24 ) & 931.5 & 6.91607978730821 & 134.686126916784 \tabularnewline
Winsorized Mean ( 7 / 24 ) & 931.694444444444 & 6.7624758319346 & 137.774162540394 \tabularnewline
Winsorized Mean ( 8 / 24 ) & 930.805555555556 & 6.43957829204502 & 144.544489303811 \tabularnewline
Winsorized Mean ( 9 / 24 ) & 931.930555555556 & 6.2170674262223 & 149.898737083800 \tabularnewline
Winsorized Mean ( 10 / 24 ) & 932.486111111111 & 5.86480421032887 & 158.996972050465 \tabularnewline
Winsorized Mean ( 11 / 24 ) & 931.569444444444 & 5.2528711274621 & 177.344812358747 \tabularnewline
Winsorized Mean ( 12 / 24 ) & 931.736111111111 & 5.16901328867927 & 180.254152789996 \tabularnewline
Winsorized Mean ( 13 / 24 ) & 931.736111111111 & 5.16901328867927 & 180.254152789996 \tabularnewline
Winsorized Mean ( 14 / 24 ) & 932.125 & 4.91376884046527 & 189.696550705413 \tabularnewline
Winsorized Mean ( 15 / 24 ) & 932.958333333333 & 4.77188712043159 & 195.511400372135 \tabularnewline
Winsorized Mean ( 16 / 24 ) & 935.625 & 4.27252557221817 & 218.986401411812 \tabularnewline
Winsorized Mean ( 17 / 24 ) & 936.333333333333 & 4.16497618289335 & 224.811209528424 \tabularnewline
Winsorized Mean ( 18 / 24 ) & 936.583333333333 & 3.82662967625380 & 244.754108071997 \tabularnewline
Winsorized Mean ( 19 / 24 ) & 939.222222222222 & 3.46038514404934 & 271.421296510118 \tabularnewline
Winsorized Mean ( 20 / 24 ) & 940.055555555556 & 3.19537817203529 & 294.192269253936 \tabularnewline
Winsorized Mean ( 21 / 24 ) & 940.347222222222 & 3.07789837718446 & 305.516007023732 \tabularnewline
Winsorized Mean ( 22 / 24 ) & 937.902777777778 & 2.69789227722746 & 347.642782365511 \tabularnewline
Winsorized Mean ( 23 / 24 ) & 938.541666666667 & 2.61929292415629 & 358.318711897786 \tabularnewline
Winsorized Mean ( 24 / 24 ) & 937.875 & 2.42653703124561 & 386.507598245291 \tabularnewline
Trimmed Mean ( 1 / 24 ) & 934.185714285714 & 7.8601727641875 & 118.850531955487 \tabularnewline
Trimmed Mean ( 2 / 24 ) & 933.191176470588 & 7.23150534825343 & 129.045216940339 \tabularnewline
Trimmed Mean ( 3 / 24 ) & 932.454545454545 & 6.77635343548447 & 137.604178166347 \tabularnewline
Trimmed Mean ( 4 / 24 ) & 932.421875 & 6.54217107122313 & 142.524838444140 \tabularnewline
Trimmed Mean ( 5 / 24 ) & 932.5 & 6.3257989548128 & 147.412209376419 \tabularnewline
Trimmed Mean ( 6 / 24 ) & 932.7 & 6.11224112134197 & 152.595419827813 \tabularnewline
Trimmed Mean ( 7 / 24 ) & 932.948275862069 & 5.85984842822839 & 159.210308472796 \tabularnewline
Trimmed Mean ( 8 / 24 ) & 933.178571428571 & 5.59226664212826 & 166.869470135535 \tabularnewline
Trimmed Mean ( 9 / 24 ) & 933.574074074074 & 5.34632862865974 & 174.619657510300 \tabularnewline
Trimmed Mean ( 10 / 24 ) & 933.826923076923 & 5.09766760863725 & 183.187095505146 \tabularnewline
Trimmed Mean ( 11 / 24 ) & 934.02 & 4.87429660022231 & 191.621494670103 \tabularnewline
Trimmed Mean ( 12 / 24 ) & 934.354166666667 & 4.73747785632031 & 197.22607577366 \tabularnewline
Trimmed Mean ( 13 / 24 ) & 934.695652173913 & 4.58013665230998 & 204.075931162993 \tabularnewline
Trimmed Mean ( 14 / 24 ) & 935.068181818182 & 4.37431936442455 & 213.763126081488 \tabularnewline
Trimmed Mean ( 15 / 24 ) & 935.428571428571 & 4.16850963057969 & 224.403600885645 \tabularnewline
Trimmed Mean ( 16 / 24 ) & 935.725 & 3.93244027779972 & 237.950212564590 \tabularnewline
Trimmed Mean ( 17 / 24 ) & 935.736842105263 & 3.75260634140093 & 249.356515705277 \tabularnewline
Trimmed Mean ( 18 / 24 ) & 935.666666666667 & 3.53508492073746 & 264.680110279069 \tabularnewline
Trimmed Mean ( 19 / 24 ) & 935.558823529412 & 3.33222562070632 & 280.760947792937 \tabularnewline
Trimmed Mean ( 20 / 24 ) & 935.125 & 3.14878048590039 & 296.980054401157 \tabularnewline
Trimmed Mean ( 21 / 24 ) & 934.533333333333 & 2.95939312407717 & 315.785464840785 \tabularnewline
Trimmed Mean ( 22 / 24 ) & 933.821428571429 & 2.70852737836169 & 344.770902458542 \tabularnewline
Trimmed Mean ( 23 / 24 ) & 933.307692307692 & 2.49477560623071 & 374.104865374166 \tabularnewline
Trimmed Mean ( 24 / 24 ) & 932.625 & 2.17013031399272 & 429.755298097333 \tabularnewline
Median & 928 &  &  \tabularnewline
Midrange & 962.5 &  &  \tabularnewline
Midmean - Weighted Average at Xnp & 934.486486486486 &  &  \tabularnewline
Midmean - Weighted Average at X(n+1)p & 935.666666666667 &  &  \tabularnewline
Midmean - Empirical Distribution Function & 934.486486486486 &  &  \tabularnewline
Midmean - Empirical Distribution Function - Averaging & 935.666666666667 &  &  \tabularnewline
Midmean - Empirical Distribution Function - Interpolation & 935.666666666667 &  &  \tabularnewline
Midmean - Closest Observation & 934.486486486486 &  &  \tabularnewline
Midmean - True Basic - Statistics Graphics Toolkit & 935.666666666667 &  &  \tabularnewline
Midmean - MS Excel (old versions) & 936.923076923077 &  &  \tabularnewline
Number of observations & 72 &  &  \tabularnewline
\hline
\end{tabular}
%Source: https://freestatistics.org/blog/index.php?pk=60492&T=1

[TABLE]
[ROW][C]Central Tendency - Ungrouped Data[/C][/ROW]
[ROW][C]Measure[/C][C]Value[/C][C]S.E.[/C][C]Value/S.E.[/C][/ROW]
[ROW][C]Arithmetic Mean[/C][C]934.972222222222[/C][C]8.94483992457661[/C][C]104.526434246556[/C][/ROW]
[ROW][C]Geometric Mean[/C][C]931.970687223687[/C][C][/C][C][/C][/ROW]
[ROW][C]Harmonic Mean[/C][C]928.987673666957[/C][C][/C][C][/C][/ROW]
[ROW][C]Quadratic Mean[/C][C]938.005212020582[/C][C][/C][C][/C][/ROW]
[ROW][C]Winsorized Mean ( 1 / 24 )[/C][C]935.125[/C][C]8.37351667428463[/C][C]111.676495834994[/C][/ROW]
[ROW][C]Winsorized Mean ( 2 / 24 )[/C][C]934.541666666667[/C][C]7.9189936659118[/C][C]118.012680157771[/C][/ROW]
[ROW][C]Winsorized Mean ( 3 / 24 )[/C][C]932.541666666667[/C][C]7.27102040129557[/C][C]128.254579852438[/C][/ROW]
[ROW][C]Winsorized Mean ( 4 / 24 )[/C][C]932.152777777778[/C][C]7.09707062610468[/C][C]131.343314289293[/C][/ROW]
[ROW][C]Winsorized Mean ( 5 / 24 )[/C][C]931.666666666667[/C][C]6.94703863908177[/C][C]134.109901365081[/C][/ROW]
[ROW][C]Winsorized Mean ( 6 / 24 )[/C][C]931.5[/C][C]6.91607978730821[/C][C]134.686126916784[/C][/ROW]
[ROW][C]Winsorized Mean ( 7 / 24 )[/C][C]931.694444444444[/C][C]6.7624758319346[/C][C]137.774162540394[/C][/ROW]
[ROW][C]Winsorized Mean ( 8 / 24 )[/C][C]930.805555555556[/C][C]6.43957829204502[/C][C]144.544489303811[/C][/ROW]
[ROW][C]Winsorized Mean ( 9 / 24 )[/C][C]931.930555555556[/C][C]6.2170674262223[/C][C]149.898737083800[/C][/ROW]
[ROW][C]Winsorized Mean ( 10 / 24 )[/C][C]932.486111111111[/C][C]5.86480421032887[/C][C]158.996972050465[/C][/ROW]
[ROW][C]Winsorized Mean ( 11 / 24 )[/C][C]931.569444444444[/C][C]5.2528711274621[/C][C]177.344812358747[/C][/ROW]
[ROW][C]Winsorized Mean ( 12 / 24 )[/C][C]931.736111111111[/C][C]5.16901328867927[/C][C]180.254152789996[/C][/ROW]
[ROW][C]Winsorized Mean ( 13 / 24 )[/C][C]931.736111111111[/C][C]5.16901328867927[/C][C]180.254152789996[/C][/ROW]
[ROW][C]Winsorized Mean ( 14 / 24 )[/C][C]932.125[/C][C]4.91376884046527[/C][C]189.696550705413[/C][/ROW]
[ROW][C]Winsorized Mean ( 15 / 24 )[/C][C]932.958333333333[/C][C]4.77188712043159[/C][C]195.511400372135[/C][/ROW]
[ROW][C]Winsorized Mean ( 16 / 24 )[/C][C]935.625[/C][C]4.27252557221817[/C][C]218.986401411812[/C][/ROW]
[ROW][C]Winsorized Mean ( 17 / 24 )[/C][C]936.333333333333[/C][C]4.16497618289335[/C][C]224.811209528424[/C][/ROW]
[ROW][C]Winsorized Mean ( 18 / 24 )[/C][C]936.583333333333[/C][C]3.82662967625380[/C][C]244.754108071997[/C][/ROW]
[ROW][C]Winsorized Mean ( 19 / 24 )[/C][C]939.222222222222[/C][C]3.46038514404934[/C][C]271.421296510118[/C][/ROW]
[ROW][C]Winsorized Mean ( 20 / 24 )[/C][C]940.055555555556[/C][C]3.19537817203529[/C][C]294.192269253936[/C][/ROW]
[ROW][C]Winsorized Mean ( 21 / 24 )[/C][C]940.347222222222[/C][C]3.07789837718446[/C][C]305.516007023732[/C][/ROW]
[ROW][C]Winsorized Mean ( 22 / 24 )[/C][C]937.902777777778[/C][C]2.69789227722746[/C][C]347.642782365511[/C][/ROW]
[ROW][C]Winsorized Mean ( 23 / 24 )[/C][C]938.541666666667[/C][C]2.61929292415629[/C][C]358.318711897786[/C][/ROW]
[ROW][C]Winsorized Mean ( 24 / 24 )[/C][C]937.875[/C][C]2.42653703124561[/C][C]386.507598245291[/C][/ROW]
[ROW][C]Trimmed Mean ( 1 / 24 )[/C][C]934.185714285714[/C][C]7.8601727641875[/C][C]118.850531955487[/C][/ROW]
[ROW][C]Trimmed Mean ( 2 / 24 )[/C][C]933.191176470588[/C][C]7.23150534825343[/C][C]129.045216940339[/C][/ROW]
[ROW][C]Trimmed Mean ( 3 / 24 )[/C][C]932.454545454545[/C][C]6.77635343548447[/C][C]137.604178166347[/C][/ROW]
[ROW][C]Trimmed Mean ( 4 / 24 )[/C][C]932.421875[/C][C]6.54217107122313[/C][C]142.524838444140[/C][/ROW]
[ROW][C]Trimmed Mean ( 5 / 24 )[/C][C]932.5[/C][C]6.3257989548128[/C][C]147.412209376419[/C][/ROW]
[ROW][C]Trimmed Mean ( 6 / 24 )[/C][C]932.7[/C][C]6.11224112134197[/C][C]152.595419827813[/C][/ROW]
[ROW][C]Trimmed Mean ( 7 / 24 )[/C][C]932.948275862069[/C][C]5.85984842822839[/C][C]159.210308472796[/C][/ROW]
[ROW][C]Trimmed Mean ( 8 / 24 )[/C][C]933.178571428571[/C][C]5.59226664212826[/C][C]166.869470135535[/C][/ROW]
[ROW][C]Trimmed Mean ( 9 / 24 )[/C][C]933.574074074074[/C][C]5.34632862865974[/C][C]174.619657510300[/C][/ROW]
[ROW][C]Trimmed Mean ( 10 / 24 )[/C][C]933.826923076923[/C][C]5.09766760863725[/C][C]183.187095505146[/C][/ROW]
[ROW][C]Trimmed Mean ( 11 / 24 )[/C][C]934.02[/C][C]4.87429660022231[/C][C]191.621494670103[/C][/ROW]
[ROW][C]Trimmed Mean ( 12 / 24 )[/C][C]934.354166666667[/C][C]4.73747785632031[/C][C]197.22607577366[/C][/ROW]
[ROW][C]Trimmed Mean ( 13 / 24 )[/C][C]934.695652173913[/C][C]4.58013665230998[/C][C]204.075931162993[/C][/ROW]
[ROW][C]Trimmed Mean ( 14 / 24 )[/C][C]935.068181818182[/C][C]4.37431936442455[/C][C]213.763126081488[/C][/ROW]
[ROW][C]Trimmed Mean ( 15 / 24 )[/C][C]935.428571428571[/C][C]4.16850963057969[/C][C]224.403600885645[/C][/ROW]
[ROW][C]Trimmed Mean ( 16 / 24 )[/C][C]935.725[/C][C]3.93244027779972[/C][C]237.950212564590[/C][/ROW]
[ROW][C]Trimmed Mean ( 17 / 24 )[/C][C]935.736842105263[/C][C]3.75260634140093[/C][C]249.356515705277[/C][/ROW]
[ROW][C]Trimmed Mean ( 18 / 24 )[/C][C]935.666666666667[/C][C]3.53508492073746[/C][C]264.680110279069[/C][/ROW]
[ROW][C]Trimmed Mean ( 19 / 24 )[/C][C]935.558823529412[/C][C]3.33222562070632[/C][C]280.760947792937[/C][/ROW]
[ROW][C]Trimmed Mean ( 20 / 24 )[/C][C]935.125[/C][C]3.14878048590039[/C][C]296.980054401157[/C][/ROW]
[ROW][C]Trimmed Mean ( 21 / 24 )[/C][C]934.533333333333[/C][C]2.95939312407717[/C][C]315.785464840785[/C][/ROW]
[ROW][C]Trimmed Mean ( 22 / 24 )[/C][C]933.821428571429[/C][C]2.70852737836169[/C][C]344.770902458542[/C][/ROW]
[ROW][C]Trimmed Mean ( 23 / 24 )[/C][C]933.307692307692[/C][C]2.49477560623071[/C][C]374.104865374166[/C][/ROW]
[ROW][C]Trimmed Mean ( 24 / 24 )[/C][C]932.625[/C][C]2.17013031399272[/C][C]429.755298097333[/C][/ROW]
[ROW][C]Median[/C][C]928[/C][C][/C][C][/C][/ROW]
[ROW][C]Midrange[/C][C]962.5[/C][C][/C][C][/C][/ROW]
[ROW][C]Midmean - Weighted Average at Xnp[/C][C]934.486486486486[/C][C][/C][C][/C][/ROW]
[ROW][C]Midmean - Weighted Average at X(n+1)p[/C][C]935.666666666667[/C][C][/C][C][/C][/ROW]
[ROW][C]Midmean - Empirical Distribution Function[/C][C]934.486486486486[/C][C][/C][C][/C][/ROW]
[ROW][C]Midmean - Empirical Distribution Function - Averaging[/C][C]935.666666666667[/C][C][/C][C][/C][/ROW]
[ROW][C]Midmean - Empirical Distribution Function - Interpolation[/C][C]935.666666666667[/C][C][/C][C][/C][/ROW]
[ROW][C]Midmean - Closest Observation[/C][C]934.486486486486[/C][C][/C][C][/C][/ROW]
[ROW][C]Midmean - True Basic - Statistics Graphics Toolkit[/C][C]935.666666666667[/C][C][/C][C][/C][/ROW]
[ROW][C]Midmean - MS Excel (old versions)[/C][C]936.923076923077[/C][C][/C][C][/C][/ROW]
[ROW][C]Number of observations[/C][C]72[/C][C][/C][C][/C][/ROW]
[/TABLE]
Source: https://freestatistics.org/blog/index.php?pk=60492&T=1

Globally Unique Identifier (entire table): ba.freestatistics.org/blog/index.php?pk=60492&T=1

As an alternative you can also use a QR Code:  

The GUIDs for individual cells are displayed in the table below:

Central Tendency - Ungrouped Data
MeasureValueS.E.Value/S.E.
Arithmetic Mean934.9722222222228.94483992457661104.526434246556
Geometric Mean931.970687223687
Harmonic Mean928.987673666957
Quadratic Mean938.005212020582
Winsorized Mean ( 1 / 24 )935.1258.37351667428463111.676495834994
Winsorized Mean ( 2 / 24 )934.5416666666677.9189936659118118.012680157771
Winsorized Mean ( 3 / 24 )932.5416666666677.27102040129557128.254579852438
Winsorized Mean ( 4 / 24 )932.1527777777787.09707062610468131.343314289293
Winsorized Mean ( 5 / 24 )931.6666666666676.94703863908177134.109901365081
Winsorized Mean ( 6 / 24 )931.56.91607978730821134.686126916784
Winsorized Mean ( 7 / 24 )931.6944444444446.7624758319346137.774162540394
Winsorized Mean ( 8 / 24 )930.8055555555566.43957829204502144.544489303811
Winsorized Mean ( 9 / 24 )931.9305555555566.2170674262223149.898737083800
Winsorized Mean ( 10 / 24 )932.4861111111115.86480421032887158.996972050465
Winsorized Mean ( 11 / 24 )931.5694444444445.2528711274621177.344812358747
Winsorized Mean ( 12 / 24 )931.7361111111115.16901328867927180.254152789996
Winsorized Mean ( 13 / 24 )931.7361111111115.16901328867927180.254152789996
Winsorized Mean ( 14 / 24 )932.1254.91376884046527189.696550705413
Winsorized Mean ( 15 / 24 )932.9583333333334.77188712043159195.511400372135
Winsorized Mean ( 16 / 24 )935.6254.27252557221817218.986401411812
Winsorized Mean ( 17 / 24 )936.3333333333334.16497618289335224.811209528424
Winsorized Mean ( 18 / 24 )936.5833333333333.82662967625380244.754108071997
Winsorized Mean ( 19 / 24 )939.2222222222223.46038514404934271.421296510118
Winsorized Mean ( 20 / 24 )940.0555555555563.19537817203529294.192269253936
Winsorized Mean ( 21 / 24 )940.3472222222223.07789837718446305.516007023732
Winsorized Mean ( 22 / 24 )937.9027777777782.69789227722746347.642782365511
Winsorized Mean ( 23 / 24 )938.5416666666672.61929292415629358.318711897786
Winsorized Mean ( 24 / 24 )937.8752.42653703124561386.507598245291
Trimmed Mean ( 1 / 24 )934.1857142857147.8601727641875118.850531955487
Trimmed Mean ( 2 / 24 )933.1911764705887.23150534825343129.045216940339
Trimmed Mean ( 3 / 24 )932.4545454545456.77635343548447137.604178166347
Trimmed Mean ( 4 / 24 )932.4218756.54217107122313142.524838444140
Trimmed Mean ( 5 / 24 )932.56.3257989548128147.412209376419
Trimmed Mean ( 6 / 24 )932.76.11224112134197152.595419827813
Trimmed Mean ( 7 / 24 )932.9482758620695.85984842822839159.210308472796
Trimmed Mean ( 8 / 24 )933.1785714285715.59226664212826166.869470135535
Trimmed Mean ( 9 / 24 )933.5740740740745.34632862865974174.619657510300
Trimmed Mean ( 10 / 24 )933.8269230769235.09766760863725183.187095505146
Trimmed Mean ( 11 / 24 )934.024.87429660022231191.621494670103
Trimmed Mean ( 12 / 24 )934.3541666666674.73747785632031197.22607577366
Trimmed Mean ( 13 / 24 )934.6956521739134.58013665230998204.075931162993
Trimmed Mean ( 14 / 24 )935.0681818181824.37431936442455213.763126081488
Trimmed Mean ( 15 / 24 )935.4285714285714.16850963057969224.403600885645
Trimmed Mean ( 16 / 24 )935.7253.93244027779972237.950212564590
Trimmed Mean ( 17 / 24 )935.7368421052633.75260634140093249.356515705277
Trimmed Mean ( 18 / 24 )935.6666666666673.53508492073746264.680110279069
Trimmed Mean ( 19 / 24 )935.5588235294123.33222562070632280.760947792937
Trimmed Mean ( 20 / 24 )935.1253.14878048590039296.980054401157
Trimmed Mean ( 21 / 24 )934.5333333333332.95939312407717315.785464840785
Trimmed Mean ( 22 / 24 )933.8214285714292.70852737836169344.770902458542
Trimmed Mean ( 23 / 24 )933.3076923076922.49477560623071374.104865374166
Trimmed Mean ( 24 / 24 )932.6252.17013031399272429.755298097333
Median928
Midrange962.5
Midmean - Weighted Average at Xnp934.486486486486
Midmean - Weighted Average at X(n+1)p935.666666666667
Midmean - Empirical Distribution Function934.486486486486
Midmean - Empirical Distribution Function - Averaging935.666666666667
Midmean - Empirical Distribution Function - Interpolation935.666666666667
Midmean - Closest Observation934.486486486486
Midmean - True Basic - Statistics Graphics Toolkit935.666666666667
Midmean - MS Excel (old versions)936.923076923077
Number of observations72


Parameters (Session):
Parameters (R input):
R code (references can be found in the software module):
geomean <- function(x) {
return(exp(mean(log(x))))
}
harmean <- function(x) {
return(1/mean(1/x))
}
quamean <- function(x) {
return(sqrt(mean(x*x)))
}
winmean <- function(x) {
x <-sort(x[!is.na(x)])
n<-length(x)
denom <- 3
nodenom <- n/denom
if (nodenom>40) denom <- n/40
sqrtn = sqrt(n)
roundnodenom = floor(nodenom)
win <- array(NA,dim=c(roundnodenom,2))
for (j in 1:roundnodenom) {
win[j,1] <- (j*x[j+1]+sum(x[(j+1):(n-j)])+j*x[n-j])/n
win[j,2] <- sd(c(rep(x[j+1],j),x[(j+1):(n-j)],rep(x[n-j],j)))/sqrtn
}
return(win)
}
trimean <- function(x) {
x <-sort(x[!is.na(x)])
n<-length(x)
denom <- 3
nodenom <- n/denom
if (nodenom>40) denom <- n/40
sqrtn = sqrt(n)
roundnodenom = floor(nodenom)
tri <- array(NA,dim=c(roundnodenom,2))
for (j in 1:roundnodenom) {
tri[j,1] <- mean(x,trim=j/n)
tri[j,2] <- sd(x[(j+1):(n-j)]) / sqrt(n-j*2)
}
return(tri)
}
midrange <- function(x) {
return((max(x)+min(x))/2)
}
q1 <- function(data,n,p,i,f) {
np <- n*p;
i <<- floor(np)
f <<- np - i
qvalue <- (1-f)*data[i] + f*data[i+1]
}
q2 <- function(data,n,p,i,f) {
np <- (n+1)*p
i <<- floor(np)
f <<- np - i
qvalue <- (1-f)*data[i] + f*data[i+1]
}
q3 <- function(data,n,p,i,f) {
np <- n*p
i <<- floor(np)
f <<- np - i
if (f==0) {
qvalue <- data[i]
} else {
qvalue <- data[i+1]
}
}
q4 <- function(data,n,p,i,f) {
np <- n*p
i <<- floor(np)
f <<- np - i
if (f==0) {
qvalue <- (data[i]+data[i+1])/2
} else {
qvalue <- data[i+1]
}
}
q5 <- function(data,n,p,i,f) {
np <- (n-1)*p
i <<- floor(np)
f <<- np - i
if (f==0) {
qvalue <- data[i+1]
} else {
qvalue <- data[i+1] + f*(data[i+2]-data[i+1])
}
}
q6 <- function(data,n,p,i,f) {
np <- n*p+0.5
i <<- floor(np)
f <<- np - i
qvalue <- data[i]
}
q7 <- function(data,n,p,i,f) {
np <- (n+1)*p
i <<- floor(np)
f <<- np - i
if (f==0) {
qvalue <- data[i]
} else {
qvalue <- f*data[i] + (1-f)*data[i+1]
}
}
q8 <- function(data,n,p,i,f) {
np <- (n+1)*p
i <<- floor(np)
f <<- np - i
if (f==0) {
qvalue <- data[i]
} else {
if (f == 0.5) {
qvalue <- (data[i]+data[i+1])/2
} else {
if (f < 0.5) {
qvalue <- data[i]
} else {
qvalue <- data[i+1]
}
}
}
}
midmean <- function(x,def) {
x <-sort(x[!is.na(x)])
n<-length(x)
if (def==1) {
qvalue1 <- q1(x,n,0.25,i,f)
qvalue3 <- q1(x,n,0.75,i,f)
}
if (def==2) {
qvalue1 <- q2(x,n,0.25,i,f)
qvalue3 <- q2(x,n,0.75,i,f)
}
if (def==3) {
qvalue1 <- q3(x,n,0.25,i,f)
qvalue3 <- q3(x,n,0.75,i,f)
}
if (def==4) {
qvalue1 <- q4(x,n,0.25,i,f)
qvalue3 <- q4(x,n,0.75,i,f)
}
if (def==5) {
qvalue1 <- q5(x,n,0.25,i,f)
qvalue3 <- q5(x,n,0.75,i,f)
}
if (def==6) {
qvalue1 <- q6(x,n,0.25,i,f)
qvalue3 <- q6(x,n,0.75,i,f)
}
if (def==7) {
qvalue1 <- q7(x,n,0.25,i,f)
qvalue3 <- q7(x,n,0.75,i,f)
}
if (def==8) {
qvalue1 <- q8(x,n,0.25,i,f)
qvalue3 <- q8(x,n,0.75,i,f)
}
midm <- 0
myn <- 0
roundno4 <- round(n/4)
round3no4 <- round(3*n/4)
for (i in 1:n) {
if ((x[i]>=qvalue1) & (x[i]<=qvalue3)){
midm = midm + x[i]
myn = myn + 1
}
}
midm = midm / myn
return(midm)
}
(arm <- mean(x))
sqrtn <- sqrt(length(x))
(armse <- sd(x) / sqrtn)
(armose <- arm / armse)
(geo <- geomean(x))
(har <- harmean(x))
(qua <- quamean(x))
(win <- winmean(x))
(tri <- trimean(x))
(midr <- midrange(x))
midm <- array(NA,dim=8)
for (j in 1:8) midm[j] <- midmean(x,j)
midm
bitmap(file='test1.png')
lb <- win[,1] - 2*win[,2]
ub <- win[,1] + 2*win[,2]
if ((ylimmin == '') | (ylimmax == '')) plot(win[,1],type='b',main=main, xlab='j', pch=19, ylab='Winsorized Mean(j/n)', ylim=c(min(lb),max(ub))) else plot(win[,1],type='l',main=main, xlab='j', pch=19, ylab='Winsorized Mean(j/n)', ylim=c(ylimmin,ylimmax))
lines(ub,lty=3)
lines(lb,lty=3)
grid()
dev.off()
bitmap(file='test2.png')
lb <- tri[,1] - 2*tri[,2]
ub <- tri[,1] + 2*tri[,2]
if ((ylimmin == '') | (ylimmax == '')) plot(tri[,1],type='b',main=main, xlab='j', pch=19, ylab='Trimmed Mean(j/n)', ylim=c(min(lb),max(ub))) else plot(tri[,1],type='l',main=main, xlab='j', pch=19, ylab='Trimmed Mean(j/n)', ylim=c(ylimmin,ylimmax))
lines(ub,lty=3)
lines(lb,lty=3)
grid()
dev.off()
load(file='createtable')
a<-table.start()
a<-table.row.start(a)
a<-table.element(a,'Central Tendency - Ungrouped Data',4,TRUE)
a<-table.row.end(a)
a<-table.row.start(a)
a<-table.element(a,'Measure',header=TRUE)
a<-table.element(a,'Value',header=TRUE)
a<-table.element(a,'S.E.',header=TRUE)
a<-table.element(a,'Value/S.E.',header=TRUE)
a<-table.row.end(a)
a<-table.row.start(a)
a<-table.element(a,hyperlink('arithmetic_mean.htm', 'Arithmetic Mean', 'click to view the definition of the Arithmetic Mean'),header=TRUE)
a<-table.element(a,arm)
a<-table.element(a,hyperlink('arithmetic_mean_standard_error.htm', armse, 'click to view the definition of the Standard Error of the Arithmetic Mean'))
a<-table.element(a,armose)
a<-table.row.end(a)
a<-table.row.start(a)
a<-table.element(a,hyperlink('geometric_mean.htm', 'Geometric Mean', 'click to view the definition of the Geometric Mean'),header=TRUE)
a<-table.element(a,geo)
a<-table.element(a,'')
a<-table.row.end(a)
a<-table.row.start(a)
a<-table.element(a,hyperlink('harmonic_mean.htm', 'Harmonic Mean', 'click to view the definition of the Harmonic Mean'),header=TRUE)
a<-table.element(a,har)
a<-table.element(a,'')
a<-table.row.end(a)
a<-table.row.start(a)
a<-table.element(a,hyperlink('quadratic_mean.htm', 'Quadratic Mean', 'click to view the definition of the Quadratic Mean'),header=TRUE)
a<-table.element(a,qua)
a<-table.element(a,'')
a<-table.row.end(a)
for (j in 1:length(win[,1])) {
a<-table.row.start(a)
mylabel <- paste('Winsorized Mean (',j)
mylabel <- paste(mylabel,'/')
mylabel <- paste(mylabel,length(win[,1]))
mylabel <- paste(mylabel,')')
a<-table.element(a,hyperlink('winsorized_mean.htm', mylabel, 'click to view the definition of the Winsorized Mean'),header=TRUE)
a<-table.element(a,win[j,1])
a<-table.element(a,win[j,2])
a<-table.element(a,win[j,1]/win[j,2])
a<-table.row.end(a)
}
for (j in 1:length(tri[,1])) {
a<-table.row.start(a)
mylabel <- paste('Trimmed Mean (',j)
mylabel <- paste(mylabel,'/')
mylabel <- paste(mylabel,length(tri[,1]))
mylabel <- paste(mylabel,')')
a<-table.element(a,hyperlink('arithmetic_mean.htm', mylabel, 'click to view the definition of the Trimmed Mean'),header=TRUE)
a<-table.element(a,tri[j,1])
a<-table.element(a,tri[j,2])
a<-table.element(a,tri[j,1]/tri[j,2])
a<-table.row.end(a)
}
a<-table.row.start(a)
a<-table.element(a,hyperlink('median_1.htm', 'Median', 'click to view the definition of the Median'),header=TRUE)
a<-table.element(a,median(x))
a<-table.element(a,'')
a<-table.row.end(a)
a<-table.row.start(a)
a<-table.element(a,hyperlink('midrange.htm', 'Midrange', 'click to view the definition of the Midrange'),header=TRUE)
a<-table.element(a,midr)
a<-table.element(a,'')
a<-table.row.end(a)
a<-table.row.start(a)
mymid <- hyperlink('midmean.htm', 'Midmean', 'click to view the definition of the Midmean')
mylabel <- paste(mymid,hyperlink('method_1.htm','Weighted Average at Xnp',''),sep=' - ')
a<-table.element(a,mylabel,header=TRUE)
a<-table.element(a,midm[1])
a<-table.element(a,'')
a<-table.row.end(a)
a<-table.row.start(a)
mymid <- hyperlink('midmean.htm', 'Midmean', 'click to view the definition of the Midmean')
mylabel <- paste(mymid,hyperlink('method_2.htm','Weighted Average at X(n+1)p',''),sep=' - ')
a<-table.element(a,mylabel,header=TRUE)
a<-table.element(a,midm[2])
a<-table.element(a,'')
a<-table.row.end(a)
a<-table.row.start(a)
mymid <- hyperlink('midmean.htm', 'Midmean', 'click to view the definition of the Midmean')
mylabel <- paste(mymid,hyperlink('method_3.htm','Empirical Distribution Function',''),sep=' - ')
a<-table.element(a,mylabel,header=TRUE)
a<-table.element(a,midm[3])
a<-table.element(a,'')
a<-table.row.end(a)
a<-table.row.start(a)
mymid <- hyperlink('midmean.htm', 'Midmean', 'click to view the definition of the Midmean')
mylabel <- paste(mymid,hyperlink('method_4.htm','Empirical Distribution Function - Averaging',''),sep=' - ')
a<-table.element(a,mylabel,header=TRUE)
a<-table.element(a,midm[4])
a<-table.element(a,'')
a<-table.row.end(a)
a<-table.row.start(a)
mymid <- hyperlink('midmean.htm', 'Midmean', 'click to view the definition of the Midmean')
mylabel <- paste(mymid,hyperlink('method_5.htm','Empirical Distribution Function - Interpolation',''),sep=' - ')
a<-table.element(a,mylabel,header=TRUE)
a<-table.element(a,midm[5])
a<-table.element(a,'')
a<-table.row.end(a)
a<-table.row.start(a)
mymid <- hyperlink('midmean.htm', 'Midmean', 'click to view the definition of the Midmean')
mylabel <- paste(mymid,hyperlink('method_6.htm','Closest Observation',''),sep=' - ')
a<-table.element(a,mylabel,header=TRUE)
a<-table.element(a,midm[6])
a<-table.element(a,'')
a<-table.row.end(a)
a<-table.row.start(a)
mymid <- hyperlink('midmean.htm', 'Midmean', 'click to view the definition of the Midmean')
mylabel <- paste(mymid,hyperlink('method_7.htm','True Basic - Statistics Graphics Toolkit',''),sep=' - ')
a<-table.element(a,mylabel,header=TRUE)
a<-table.element(a,midm[7])
a<-table.element(a,'')
a<-table.row.end(a)
a<-table.row.start(a)
mymid <- hyperlink('midmean.htm', 'Midmean', 'click to view the definition of the Midmean')
mylabel <- paste(mymid,hyperlink('method_8.htm','MS Excel (old versions)',''),sep=' - ')
a<-table.element(a,mylabel,header=TRUE)
a<-table.element(a,midm[8])
a<-table.element(a,'')
a<-table.row.end(a)
a<-table.row.start(a)
a<-table.element(a,'Number of observations',header=TRUE)
a<-table.element(a,length(x))
a<-table.element(a,'')
a<-table.row.end(a)
a<-table.end(a)
table.save(a,file='mytable.tab')