Free Statistics

of Irreproducible Research!

Author's title

Author*The author of this computation has been verified*
R Software Modulerwasp_autocorrelation.wasp
Title produced by software(Partial) Autocorrelation Function
Date of computationFri, 27 Nov 2009 02:57:00 -0700
Cite this page as followsStatistical Computations at FreeStatistics.org, Office for Research Development and Education, URL https://freestatistics.org/blog/index.php?v=date/2009/Nov/27/t12593159402j257x4fa085nuo.htm/, Retrieved Sun, 28 Apr 2024 20:44:24 +0000
Statistical Computations at FreeStatistics.org, Office for Research Development and Education, URL https://freestatistics.org/blog/index.php?pk=60515, Retrieved Sun, 28 Apr 2024 20:44:24 +0000
QR Codes:

Original text written by user:
IsPrivate?No (this computation is public)
User-defined keywords
Estimated Impact124
Family? (F = Feedback message, R = changed R code, M = changed R Module, P = changed Parameters, D = changed Data)
-       [(Partial) Autocorrelation Function] [ws8] [2009-11-27 09:57:00] [b243db81ea3e1f02fb3382887fb0f701] [Current]
Feedback Forum

Post a new message
Dataseries X:
29571
30167
30524
30996
31033
31198
30937
31649
33115
34106
33926
33382
32851
32948
36112
36113
35210
35193
34383
35349
37058
38076
36630
36045
35638
35114
35465
35254
35299
35916
36683
37288
38536
38977
36407
34955
34951
32680
34791
34178
35213
34871
35299
35443
37108
36419
34471
33868
34385
33643
34627
32919
35500
36110
37086
37711
40427
39884
38512
38767


Summary of computational transaction
Raw Inputview raw input (R code)
Raw Outputview raw output of R engine
Computing time1 seconds
R Server'Gwilym Jenkins' @ 72.249.127.135

\begin{tabular}{lllllllll}
\hline
Summary of computational transaction \tabularnewline
Raw Input & view raw input (R code)  \tabularnewline
Raw Output & view raw output of R engine  \tabularnewline
Computing time & 1 seconds \tabularnewline
R Server & 'Gwilym Jenkins' @ 72.249.127.135 \tabularnewline
\hline
\end{tabular}
%Source: https://freestatistics.org/blog/index.php?pk=60515&T=0

[TABLE]
[ROW][C]Summary of computational transaction[/C][/ROW]
[ROW][C]Raw Input[/C][C]view raw input (R code) [/C][/ROW]
[ROW][C]Raw Output[/C][C]view raw output of R engine [/C][/ROW]
[ROW][C]Computing time[/C][C]1 seconds[/C][/ROW]
[ROW][C]R Server[/C][C]'Gwilym Jenkins' @ 72.249.127.135[/C][/ROW]
[/TABLE]
Source: https://freestatistics.org/blog/index.php?pk=60515&T=0

Globally Unique Identifier (entire table): ba.freestatistics.org/blog/index.php?pk=60515&T=0

As an alternative you can also use a QR Code:  

The GUIDs for individual cells are displayed in the table below:

Summary of computational transaction
Raw Inputview raw input (R code)
Raw Outputview raw output of R engine
Computing time1 seconds
R Server'Gwilym Jenkins' @ 72.249.127.135


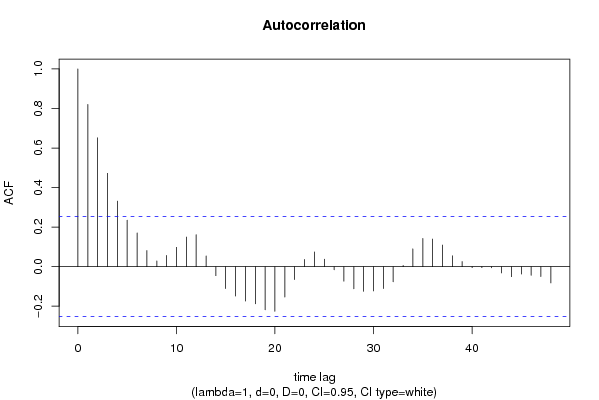
Autocorrelation Function
Time lag kACF(k)T-STATP-value
10.8205296.35580
20.6518535.04922e-06
30.4719063.65540.000271
40.3314192.56720.006382
50.2351121.82120.036784
60.1704111.320.095925
70.0813490.63010.265501
80.0285330.2210.412916
90.0568330.44020.330679
100.0980520.75950.22526
110.1494311.15750.125831
120.1617151.25260.107599
130.054060.41870.338448
14-0.04577-0.35450.362091
15-0.11078-0.85810.197126
16-0.148806-1.15260.126814
17-0.173881-1.34690.091542
18-0.188138-1.45730.075123
19-0.2187-1.6940.047721
20-0.226292-1.75290.042368
21-0.153681-1.19040.119287
22-0.065416-0.50670.307107
230.0364060.2820.389457
240.07440.57630.283284
250.0378030.29280.385336
26-0.016017-0.12410.450839
27-0.073815-0.57180.284808
28-0.112398-0.87060.193713
29-0.124871-0.96720.168651
30-0.122984-0.95260.172299
31-0.110691-0.85740.197316
32-0.076991-0.59640.276585
330.0062330.04830.480828
340.0898610.69610.244538
350.1427121.10540.136691
360.139631.08160.141886
370.1092780.84650.20033
380.0549180.42540.336037
390.0256120.19840.421705
40-0.005301-0.04110.483693
41-0.005083-0.03940.484362
42-0.005925-0.04590.481772
43-0.032034-0.24810.402438
44-0.050634-0.39220.348145
45-0.037888-0.29350.385084
46-0.043661-0.33820.368199
47-0.050436-0.39070.348709
48-0.082747-0.6410.261996

\begin{tabular}{lllllllll}
\hline
Autocorrelation Function \tabularnewline
Time lag k & ACF(k) & T-STAT & P-value \tabularnewline
1 & 0.820529 & 6.3558 & 0 \tabularnewline
2 & 0.651853 & 5.0492 & 2e-06 \tabularnewline
3 & 0.471906 & 3.6554 & 0.000271 \tabularnewline
4 & 0.331419 & 2.5672 & 0.006382 \tabularnewline
5 & 0.235112 & 1.8212 & 0.036784 \tabularnewline
6 & 0.170411 & 1.32 & 0.095925 \tabularnewline
7 & 0.081349 & 0.6301 & 0.265501 \tabularnewline
8 & 0.028533 & 0.221 & 0.412916 \tabularnewline
9 & 0.056833 & 0.4402 & 0.330679 \tabularnewline
10 & 0.098052 & 0.7595 & 0.22526 \tabularnewline
11 & 0.149431 & 1.1575 & 0.125831 \tabularnewline
12 & 0.161715 & 1.2526 & 0.107599 \tabularnewline
13 & 0.05406 & 0.4187 & 0.338448 \tabularnewline
14 & -0.04577 & -0.3545 & 0.362091 \tabularnewline
15 & -0.11078 & -0.8581 & 0.197126 \tabularnewline
16 & -0.148806 & -1.1526 & 0.126814 \tabularnewline
17 & -0.173881 & -1.3469 & 0.091542 \tabularnewline
18 & -0.188138 & -1.4573 & 0.075123 \tabularnewline
19 & -0.2187 & -1.694 & 0.047721 \tabularnewline
20 & -0.226292 & -1.7529 & 0.042368 \tabularnewline
21 & -0.153681 & -1.1904 & 0.119287 \tabularnewline
22 & -0.065416 & -0.5067 & 0.307107 \tabularnewline
23 & 0.036406 & 0.282 & 0.389457 \tabularnewline
24 & 0.0744 & 0.5763 & 0.283284 \tabularnewline
25 & 0.037803 & 0.2928 & 0.385336 \tabularnewline
26 & -0.016017 & -0.1241 & 0.450839 \tabularnewline
27 & -0.073815 & -0.5718 & 0.284808 \tabularnewline
28 & -0.112398 & -0.8706 & 0.193713 \tabularnewline
29 & -0.124871 & -0.9672 & 0.168651 \tabularnewline
30 & -0.122984 & -0.9526 & 0.172299 \tabularnewline
31 & -0.110691 & -0.8574 & 0.197316 \tabularnewline
32 & -0.076991 & -0.5964 & 0.276585 \tabularnewline
33 & 0.006233 & 0.0483 & 0.480828 \tabularnewline
34 & 0.089861 & 0.6961 & 0.244538 \tabularnewline
35 & 0.142712 & 1.1054 & 0.136691 \tabularnewline
36 & 0.13963 & 1.0816 & 0.141886 \tabularnewline
37 & 0.109278 & 0.8465 & 0.20033 \tabularnewline
38 & 0.054918 & 0.4254 & 0.336037 \tabularnewline
39 & 0.025612 & 0.1984 & 0.421705 \tabularnewline
40 & -0.005301 & -0.0411 & 0.483693 \tabularnewline
41 & -0.005083 & -0.0394 & 0.484362 \tabularnewline
42 & -0.005925 & -0.0459 & 0.481772 \tabularnewline
43 & -0.032034 & -0.2481 & 0.402438 \tabularnewline
44 & -0.050634 & -0.3922 & 0.348145 \tabularnewline
45 & -0.037888 & -0.2935 & 0.385084 \tabularnewline
46 & -0.043661 & -0.3382 & 0.368199 \tabularnewline
47 & -0.050436 & -0.3907 & 0.348709 \tabularnewline
48 & -0.082747 & -0.641 & 0.261996 \tabularnewline
\hline
\end{tabular}
%Source: https://freestatistics.org/blog/index.php?pk=60515&T=1

[TABLE]
[ROW][C]Autocorrelation Function[/C][/ROW]
[ROW][C]Time lag k[/C][C]ACF(k)[/C][C]T-STAT[/C][C]P-value[/C][/ROW]
[ROW][C]1[/C][C]0.820529[/C][C]6.3558[/C][C]0[/C][/ROW]
[ROW][C]2[/C][C]0.651853[/C][C]5.0492[/C][C]2e-06[/C][/ROW]
[ROW][C]3[/C][C]0.471906[/C][C]3.6554[/C][C]0.000271[/C][/ROW]
[ROW][C]4[/C][C]0.331419[/C][C]2.5672[/C][C]0.006382[/C][/ROW]
[ROW][C]5[/C][C]0.235112[/C][C]1.8212[/C][C]0.036784[/C][/ROW]
[ROW][C]6[/C][C]0.170411[/C][C]1.32[/C][C]0.095925[/C][/ROW]
[ROW][C]7[/C][C]0.081349[/C][C]0.6301[/C][C]0.265501[/C][/ROW]
[ROW][C]8[/C][C]0.028533[/C][C]0.221[/C][C]0.412916[/C][/ROW]
[ROW][C]9[/C][C]0.056833[/C][C]0.4402[/C][C]0.330679[/C][/ROW]
[ROW][C]10[/C][C]0.098052[/C][C]0.7595[/C][C]0.22526[/C][/ROW]
[ROW][C]11[/C][C]0.149431[/C][C]1.1575[/C][C]0.125831[/C][/ROW]
[ROW][C]12[/C][C]0.161715[/C][C]1.2526[/C][C]0.107599[/C][/ROW]
[ROW][C]13[/C][C]0.05406[/C][C]0.4187[/C][C]0.338448[/C][/ROW]
[ROW][C]14[/C][C]-0.04577[/C][C]-0.3545[/C][C]0.362091[/C][/ROW]
[ROW][C]15[/C][C]-0.11078[/C][C]-0.8581[/C][C]0.197126[/C][/ROW]
[ROW][C]16[/C][C]-0.148806[/C][C]-1.1526[/C][C]0.126814[/C][/ROW]
[ROW][C]17[/C][C]-0.173881[/C][C]-1.3469[/C][C]0.091542[/C][/ROW]
[ROW][C]18[/C][C]-0.188138[/C][C]-1.4573[/C][C]0.075123[/C][/ROW]
[ROW][C]19[/C][C]-0.2187[/C][C]-1.694[/C][C]0.047721[/C][/ROW]
[ROW][C]20[/C][C]-0.226292[/C][C]-1.7529[/C][C]0.042368[/C][/ROW]
[ROW][C]21[/C][C]-0.153681[/C][C]-1.1904[/C][C]0.119287[/C][/ROW]
[ROW][C]22[/C][C]-0.065416[/C][C]-0.5067[/C][C]0.307107[/C][/ROW]
[ROW][C]23[/C][C]0.036406[/C][C]0.282[/C][C]0.389457[/C][/ROW]
[ROW][C]24[/C][C]0.0744[/C][C]0.5763[/C][C]0.283284[/C][/ROW]
[ROW][C]25[/C][C]0.037803[/C][C]0.2928[/C][C]0.385336[/C][/ROW]
[ROW][C]26[/C][C]-0.016017[/C][C]-0.1241[/C][C]0.450839[/C][/ROW]
[ROW][C]27[/C][C]-0.073815[/C][C]-0.5718[/C][C]0.284808[/C][/ROW]
[ROW][C]28[/C][C]-0.112398[/C][C]-0.8706[/C][C]0.193713[/C][/ROW]
[ROW][C]29[/C][C]-0.124871[/C][C]-0.9672[/C][C]0.168651[/C][/ROW]
[ROW][C]30[/C][C]-0.122984[/C][C]-0.9526[/C][C]0.172299[/C][/ROW]
[ROW][C]31[/C][C]-0.110691[/C][C]-0.8574[/C][C]0.197316[/C][/ROW]
[ROW][C]32[/C][C]-0.076991[/C][C]-0.5964[/C][C]0.276585[/C][/ROW]
[ROW][C]33[/C][C]0.006233[/C][C]0.0483[/C][C]0.480828[/C][/ROW]
[ROW][C]34[/C][C]0.089861[/C][C]0.6961[/C][C]0.244538[/C][/ROW]
[ROW][C]35[/C][C]0.142712[/C][C]1.1054[/C][C]0.136691[/C][/ROW]
[ROW][C]36[/C][C]0.13963[/C][C]1.0816[/C][C]0.141886[/C][/ROW]
[ROW][C]37[/C][C]0.109278[/C][C]0.8465[/C][C]0.20033[/C][/ROW]
[ROW][C]38[/C][C]0.054918[/C][C]0.4254[/C][C]0.336037[/C][/ROW]
[ROW][C]39[/C][C]0.025612[/C][C]0.1984[/C][C]0.421705[/C][/ROW]
[ROW][C]40[/C][C]-0.005301[/C][C]-0.0411[/C][C]0.483693[/C][/ROW]
[ROW][C]41[/C][C]-0.005083[/C][C]-0.0394[/C][C]0.484362[/C][/ROW]
[ROW][C]42[/C][C]-0.005925[/C][C]-0.0459[/C][C]0.481772[/C][/ROW]
[ROW][C]43[/C][C]-0.032034[/C][C]-0.2481[/C][C]0.402438[/C][/ROW]
[ROW][C]44[/C][C]-0.050634[/C][C]-0.3922[/C][C]0.348145[/C][/ROW]
[ROW][C]45[/C][C]-0.037888[/C][C]-0.2935[/C][C]0.385084[/C][/ROW]
[ROW][C]46[/C][C]-0.043661[/C][C]-0.3382[/C][C]0.368199[/C][/ROW]
[ROW][C]47[/C][C]-0.050436[/C][C]-0.3907[/C][C]0.348709[/C][/ROW]
[ROW][C]48[/C][C]-0.082747[/C][C]-0.641[/C][C]0.261996[/C][/ROW]
[/TABLE]
Source: https://freestatistics.org/blog/index.php?pk=60515&T=1

Globally Unique Identifier (entire table): ba.freestatistics.org/blog/index.php?pk=60515&T=1

As an alternative you can also use a QR Code:  

The GUIDs for individual cells are displayed in the table below:

Autocorrelation Function
Time lag kACF(k)T-STATP-value
10.8205296.35580
20.6518535.04922e-06
30.4719063.65540.000271
40.3314192.56720.006382
50.2351121.82120.036784
60.1704111.320.095925
70.0813490.63010.265501
80.0285330.2210.412916
90.0568330.44020.330679
100.0980520.75950.22526
110.1494311.15750.125831
120.1617151.25260.107599
130.054060.41870.338448
14-0.04577-0.35450.362091
15-0.11078-0.85810.197126
16-0.148806-1.15260.126814
17-0.173881-1.34690.091542
18-0.188138-1.45730.075123
19-0.2187-1.6940.047721
20-0.226292-1.75290.042368
21-0.153681-1.19040.119287
22-0.065416-0.50670.307107
230.0364060.2820.389457
240.07440.57630.283284
250.0378030.29280.385336
26-0.016017-0.12410.450839
27-0.073815-0.57180.284808
28-0.112398-0.87060.193713
29-0.124871-0.96720.168651
30-0.122984-0.95260.172299
31-0.110691-0.85740.197316
32-0.076991-0.59640.276585
330.0062330.04830.480828
340.0898610.69610.244538
350.1427121.10540.136691
360.139631.08160.141886
370.1092780.84650.20033
380.0549180.42540.336037
390.0256120.19840.421705
40-0.005301-0.04110.483693
41-0.005083-0.03940.484362
42-0.005925-0.04590.481772
43-0.032034-0.24810.402438
44-0.050634-0.39220.348145
45-0.037888-0.29350.385084
46-0.043661-0.33820.368199
47-0.050436-0.39070.348709
48-0.082747-0.6410.261996


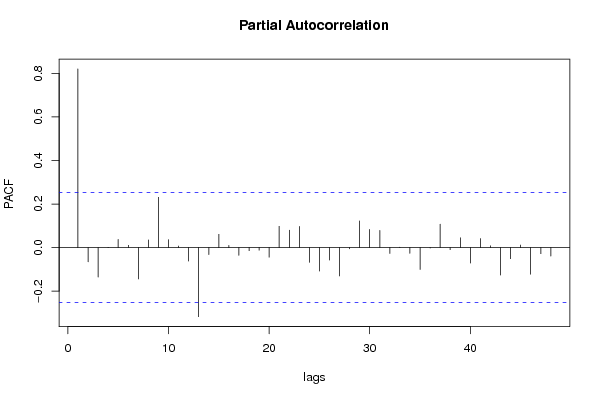
Partial Autocorrelation Function
Time lag kPACF(k)T-STATP-value
10.8205296.35580
2-0.065544-0.50770.306761
3-0.135969-1.05320.148233
4-0.000524-0.00410.498387
50.03730.28890.386818
60.010230.07920.468552
7-0.144068-1.11590.134447
80.0350060.27120.3936
90.2308661.78830.03939
100.0361570.28010.390194
110.0070060.05430.478452
12-0.062187-0.48170.315886
13-0.317634-2.46040.008388
14-0.032301-0.25020.401641
150.0609940.47250.319158
160.0094040.07280.471086
17-0.035801-0.27730.391247
18-0.014639-0.11340.455047
19-0.012154-0.09410.462654
20-0.044685-0.34610.36523
210.0973750.75430.226821
220.0794440.61540.270318
230.0969870.75130.227718
24-0.067733-0.52470.300877
25-0.10799-0.83650.203099
26-0.057497-0.44540.328827
27-0.130562-1.01130.15796
28-0.006019-0.04660.481483
290.1219060.94430.174407
300.0831260.64390.261049
310.0787880.61030.271987
32-0.027272-0.21130.416703
330.0013850.01070.495737
34-0.026579-0.20590.418791
35-0.100713-0.78010.219193
36-0.00241-0.01870.492584
370.1071330.82980.204957
38-0.01016-0.07870.468768
390.044530.34490.365678
40-0.071366-0.55280.291226
410.0410.31760.375952
420.008020.06210.475337
43-0.126797-0.98220.16498
44-0.05147-0.39870.345771
450.0112330.0870.465477
46-0.122581-0.94950.173086
47-0.028195-0.21840.413929
48-0.038978-0.30190.381877

\begin{tabular}{lllllllll}
\hline
Partial Autocorrelation Function \tabularnewline
Time lag k & PACF(k) & T-STAT & P-value \tabularnewline
1 & 0.820529 & 6.3558 & 0 \tabularnewline
2 & -0.065544 & -0.5077 & 0.306761 \tabularnewline
3 & -0.135969 & -1.0532 & 0.148233 \tabularnewline
4 & -0.000524 & -0.0041 & 0.498387 \tabularnewline
5 & 0.0373 & 0.2889 & 0.386818 \tabularnewline
6 & 0.01023 & 0.0792 & 0.468552 \tabularnewline
7 & -0.144068 & -1.1159 & 0.134447 \tabularnewline
8 & 0.035006 & 0.2712 & 0.3936 \tabularnewline
9 & 0.230866 & 1.7883 & 0.03939 \tabularnewline
10 & 0.036157 & 0.2801 & 0.390194 \tabularnewline
11 & 0.007006 & 0.0543 & 0.478452 \tabularnewline
12 & -0.062187 & -0.4817 & 0.315886 \tabularnewline
13 & -0.317634 & -2.4604 & 0.008388 \tabularnewline
14 & -0.032301 & -0.2502 & 0.401641 \tabularnewline
15 & 0.060994 & 0.4725 & 0.319158 \tabularnewline
16 & 0.009404 & 0.0728 & 0.471086 \tabularnewline
17 & -0.035801 & -0.2773 & 0.391247 \tabularnewline
18 & -0.014639 & -0.1134 & 0.455047 \tabularnewline
19 & -0.012154 & -0.0941 & 0.462654 \tabularnewline
20 & -0.044685 & -0.3461 & 0.36523 \tabularnewline
21 & 0.097375 & 0.7543 & 0.226821 \tabularnewline
22 & 0.079444 & 0.6154 & 0.270318 \tabularnewline
23 & 0.096987 & 0.7513 & 0.227718 \tabularnewline
24 & -0.067733 & -0.5247 & 0.300877 \tabularnewline
25 & -0.10799 & -0.8365 & 0.203099 \tabularnewline
26 & -0.057497 & -0.4454 & 0.328827 \tabularnewline
27 & -0.130562 & -1.0113 & 0.15796 \tabularnewline
28 & -0.006019 & -0.0466 & 0.481483 \tabularnewline
29 & 0.121906 & 0.9443 & 0.174407 \tabularnewline
30 & 0.083126 & 0.6439 & 0.261049 \tabularnewline
31 & 0.078788 & 0.6103 & 0.271987 \tabularnewline
32 & -0.027272 & -0.2113 & 0.416703 \tabularnewline
33 & 0.001385 & 0.0107 & 0.495737 \tabularnewline
34 & -0.026579 & -0.2059 & 0.418791 \tabularnewline
35 & -0.100713 & -0.7801 & 0.219193 \tabularnewline
36 & -0.00241 & -0.0187 & 0.492584 \tabularnewline
37 & 0.107133 & 0.8298 & 0.204957 \tabularnewline
38 & -0.01016 & -0.0787 & 0.468768 \tabularnewline
39 & 0.04453 & 0.3449 & 0.365678 \tabularnewline
40 & -0.071366 & -0.5528 & 0.291226 \tabularnewline
41 & 0.041 & 0.3176 & 0.375952 \tabularnewline
42 & 0.00802 & 0.0621 & 0.475337 \tabularnewline
43 & -0.126797 & -0.9822 & 0.16498 \tabularnewline
44 & -0.05147 & -0.3987 & 0.345771 \tabularnewline
45 & 0.011233 & 0.087 & 0.465477 \tabularnewline
46 & -0.122581 & -0.9495 & 0.173086 \tabularnewline
47 & -0.028195 & -0.2184 & 0.413929 \tabularnewline
48 & -0.038978 & -0.3019 & 0.381877 \tabularnewline
\hline
\end{tabular}
%Source: https://freestatistics.org/blog/index.php?pk=60515&T=2

[TABLE]
[ROW][C]Partial Autocorrelation Function[/C][/ROW]
[ROW][C]Time lag k[/C][C]PACF(k)[/C][C]T-STAT[/C][C]P-value[/C][/ROW]
[ROW][C]1[/C][C]0.820529[/C][C]6.3558[/C][C]0[/C][/ROW]
[ROW][C]2[/C][C]-0.065544[/C][C]-0.5077[/C][C]0.306761[/C][/ROW]
[ROW][C]3[/C][C]-0.135969[/C][C]-1.0532[/C][C]0.148233[/C][/ROW]
[ROW][C]4[/C][C]-0.000524[/C][C]-0.0041[/C][C]0.498387[/C][/ROW]
[ROW][C]5[/C][C]0.0373[/C][C]0.2889[/C][C]0.386818[/C][/ROW]
[ROW][C]6[/C][C]0.01023[/C][C]0.0792[/C][C]0.468552[/C][/ROW]
[ROW][C]7[/C][C]-0.144068[/C][C]-1.1159[/C][C]0.134447[/C][/ROW]
[ROW][C]8[/C][C]0.035006[/C][C]0.2712[/C][C]0.3936[/C][/ROW]
[ROW][C]9[/C][C]0.230866[/C][C]1.7883[/C][C]0.03939[/C][/ROW]
[ROW][C]10[/C][C]0.036157[/C][C]0.2801[/C][C]0.390194[/C][/ROW]
[ROW][C]11[/C][C]0.007006[/C][C]0.0543[/C][C]0.478452[/C][/ROW]
[ROW][C]12[/C][C]-0.062187[/C][C]-0.4817[/C][C]0.315886[/C][/ROW]
[ROW][C]13[/C][C]-0.317634[/C][C]-2.4604[/C][C]0.008388[/C][/ROW]
[ROW][C]14[/C][C]-0.032301[/C][C]-0.2502[/C][C]0.401641[/C][/ROW]
[ROW][C]15[/C][C]0.060994[/C][C]0.4725[/C][C]0.319158[/C][/ROW]
[ROW][C]16[/C][C]0.009404[/C][C]0.0728[/C][C]0.471086[/C][/ROW]
[ROW][C]17[/C][C]-0.035801[/C][C]-0.2773[/C][C]0.391247[/C][/ROW]
[ROW][C]18[/C][C]-0.014639[/C][C]-0.1134[/C][C]0.455047[/C][/ROW]
[ROW][C]19[/C][C]-0.012154[/C][C]-0.0941[/C][C]0.462654[/C][/ROW]
[ROW][C]20[/C][C]-0.044685[/C][C]-0.3461[/C][C]0.36523[/C][/ROW]
[ROW][C]21[/C][C]0.097375[/C][C]0.7543[/C][C]0.226821[/C][/ROW]
[ROW][C]22[/C][C]0.079444[/C][C]0.6154[/C][C]0.270318[/C][/ROW]
[ROW][C]23[/C][C]0.096987[/C][C]0.7513[/C][C]0.227718[/C][/ROW]
[ROW][C]24[/C][C]-0.067733[/C][C]-0.5247[/C][C]0.300877[/C][/ROW]
[ROW][C]25[/C][C]-0.10799[/C][C]-0.8365[/C][C]0.203099[/C][/ROW]
[ROW][C]26[/C][C]-0.057497[/C][C]-0.4454[/C][C]0.328827[/C][/ROW]
[ROW][C]27[/C][C]-0.130562[/C][C]-1.0113[/C][C]0.15796[/C][/ROW]
[ROW][C]28[/C][C]-0.006019[/C][C]-0.0466[/C][C]0.481483[/C][/ROW]
[ROW][C]29[/C][C]0.121906[/C][C]0.9443[/C][C]0.174407[/C][/ROW]
[ROW][C]30[/C][C]0.083126[/C][C]0.6439[/C][C]0.261049[/C][/ROW]
[ROW][C]31[/C][C]0.078788[/C][C]0.6103[/C][C]0.271987[/C][/ROW]
[ROW][C]32[/C][C]-0.027272[/C][C]-0.2113[/C][C]0.416703[/C][/ROW]
[ROW][C]33[/C][C]0.001385[/C][C]0.0107[/C][C]0.495737[/C][/ROW]
[ROW][C]34[/C][C]-0.026579[/C][C]-0.2059[/C][C]0.418791[/C][/ROW]
[ROW][C]35[/C][C]-0.100713[/C][C]-0.7801[/C][C]0.219193[/C][/ROW]
[ROW][C]36[/C][C]-0.00241[/C][C]-0.0187[/C][C]0.492584[/C][/ROW]
[ROW][C]37[/C][C]0.107133[/C][C]0.8298[/C][C]0.204957[/C][/ROW]
[ROW][C]38[/C][C]-0.01016[/C][C]-0.0787[/C][C]0.468768[/C][/ROW]
[ROW][C]39[/C][C]0.04453[/C][C]0.3449[/C][C]0.365678[/C][/ROW]
[ROW][C]40[/C][C]-0.071366[/C][C]-0.5528[/C][C]0.291226[/C][/ROW]
[ROW][C]41[/C][C]0.041[/C][C]0.3176[/C][C]0.375952[/C][/ROW]
[ROW][C]42[/C][C]0.00802[/C][C]0.0621[/C][C]0.475337[/C][/ROW]
[ROW][C]43[/C][C]-0.126797[/C][C]-0.9822[/C][C]0.16498[/C][/ROW]
[ROW][C]44[/C][C]-0.05147[/C][C]-0.3987[/C][C]0.345771[/C][/ROW]
[ROW][C]45[/C][C]0.011233[/C][C]0.087[/C][C]0.465477[/C][/ROW]
[ROW][C]46[/C][C]-0.122581[/C][C]-0.9495[/C][C]0.173086[/C][/ROW]
[ROW][C]47[/C][C]-0.028195[/C][C]-0.2184[/C][C]0.413929[/C][/ROW]
[ROW][C]48[/C][C]-0.038978[/C][C]-0.3019[/C][C]0.381877[/C][/ROW]
[/TABLE]
Source: https://freestatistics.org/blog/index.php?pk=60515&T=2

Globally Unique Identifier (entire table): ba.freestatistics.org/blog/index.php?pk=60515&T=2

As an alternative you can also use a QR Code:  

The GUIDs for individual cells are displayed in the table below:

Partial Autocorrelation Function
Time lag kPACF(k)T-STATP-value
10.8205296.35580
2-0.065544-0.50770.306761
3-0.135969-1.05320.148233
4-0.000524-0.00410.498387
50.03730.28890.386818
60.010230.07920.468552
7-0.144068-1.11590.134447
80.0350060.27120.3936
90.2308661.78830.03939
100.0361570.28010.390194
110.0070060.05430.478452
12-0.062187-0.48170.315886
13-0.317634-2.46040.008388
14-0.032301-0.25020.401641
150.0609940.47250.319158
160.0094040.07280.471086
17-0.035801-0.27730.391247
18-0.014639-0.11340.455047
19-0.012154-0.09410.462654
20-0.044685-0.34610.36523
210.0973750.75430.226821
220.0794440.61540.270318
230.0969870.75130.227718
24-0.067733-0.52470.300877
25-0.10799-0.83650.203099
26-0.057497-0.44540.328827
27-0.130562-1.01130.15796
28-0.006019-0.04660.481483
290.1219060.94430.174407
300.0831260.64390.261049
310.0787880.61030.271987
32-0.027272-0.21130.416703
330.0013850.01070.495737
34-0.026579-0.20590.418791
35-0.100713-0.78010.219193
36-0.00241-0.01870.492584
370.1071330.82980.204957
38-0.01016-0.07870.468768
390.044530.34490.365678
40-0.071366-0.55280.291226
410.0410.31760.375952
420.008020.06210.475337
43-0.126797-0.98220.16498
44-0.05147-0.39870.345771
450.0112330.0870.465477
46-0.122581-0.94950.173086
47-0.028195-0.21840.413929
48-0.038978-0.30190.381877


Parameters (Session):
par1 = 48 ; par2 = 1 ; par3 = 0 ; par4 = 0 ; par5 = 12 ; par6 = White Noise ; par7 = 0.95 ;
Parameters (R input):
par1 = 48 ; par2 = 1 ; par3 = 0 ; par4 = 0 ; par5 = 12 ; par6 = White Noise ; par7 = 0.95 ;
R code (references can be found in the software module):
if (par1 == 'Default') {
par1 = 10*log10(length(x))
} else {
par1 <- as.numeric(par1)
}
par2 <- as.numeric(par2)
par3 <- as.numeric(par3)
par4 <- as.numeric(par4)
par5 <- as.numeric(par5)
if (par6 == 'White Noise') par6 <- 'white' else par6 <- 'ma'
par7 <- as.numeric(par7)
if (par2 == 0) {
x <- log(x)
} else {
x <- (x ^ par2 - 1) / par2
}
if (par3 > 0) x <- diff(x,lag=1,difference=par3)
if (par4 > 0) x <- diff(x,lag=par5,difference=par4)
bitmap(file='pic1.png')
racf <- acf(x, par1, main='Autocorrelation', xlab='time lag', ylab='ACF', ci.type=par6, ci=par7, sub=paste('(lambda=',par2,', d=',par3,', D=',par4,', CI=', par7, ', CI type=',par6,')',sep=''))
dev.off()
bitmap(file='pic2.png')
rpacf <- pacf(x,par1,main='Partial Autocorrelation',xlab='lags',ylab='PACF')
dev.off()
(myacf <- c(racf$acf))
(mypacf <- c(rpacf$acf))
lengthx <- length(x)
sqrtn <- sqrt(lengthx)
load(file='createtable')
a<-table.start()
a<-table.row.start(a)
a<-table.element(a,'Autocorrelation Function',4,TRUE)
a<-table.row.end(a)
a<-table.row.start(a)
a<-table.element(a,'Time lag k',header=TRUE)
a<-table.element(a,hyperlink('basics.htm','ACF(k)','click here for more information about the Autocorrelation Function'),header=TRUE)
a<-table.element(a,'T-STAT',header=TRUE)
a<-table.element(a,'P-value',header=TRUE)
a<-table.row.end(a)
for (i in 2:(par1+1)) {
a<-table.row.start(a)
a<-table.element(a,i-1,header=TRUE)
a<-table.element(a,round(myacf[i],6))
mytstat <- myacf[i]*sqrtn
a<-table.element(a,round(mytstat,4))
a<-table.element(a,round(1-pt(abs(mytstat),lengthx),6))
a<-table.row.end(a)
}
a<-table.end(a)
table.save(a,file='mytable.tab')
a<-table.start()
a<-table.row.start(a)
a<-table.element(a,'Partial Autocorrelation Function',4,TRUE)
a<-table.row.end(a)
a<-table.row.start(a)
a<-table.element(a,'Time lag k',header=TRUE)
a<-table.element(a,hyperlink('basics.htm','PACF(k)','click here for more information about the Partial Autocorrelation Function'),header=TRUE)
a<-table.element(a,'T-STAT',header=TRUE)
a<-table.element(a,'P-value',header=TRUE)
a<-table.row.end(a)
for (i in 1:par1) {
a<-table.row.start(a)
a<-table.element(a,i,header=TRUE)
a<-table.element(a,round(mypacf[i],6))
mytstat <- mypacf[i]*sqrtn
a<-table.element(a,round(mytstat,4))
a<-table.element(a,round(1-pt(abs(mytstat),lengthx),6))
a<-table.row.end(a)
}
a<-table.end(a)
table.save(a,file='mytable1.tab')