Free Statistics

of Irreproducible Research!

Author's title

Author*The author of this computation has been verified*
R Software Modulerwasp_autocorrelation.wasp
Title produced by software(Partial) Autocorrelation Function
Date of computationFri, 27 Nov 2009 03:02:23 -0700
Cite this page as followsStatistical Computations at FreeStatistics.org, Office for Research Development and Education, URL https://freestatistics.org/blog/index.php?v=date/2009/Nov/27/t1259316197j15awg311dg26yo.htm/, Retrieved Mon, 29 Apr 2024 05:29:59 +0000
Statistical Computations at FreeStatistics.org, Office for Research Development and Education, URL https://freestatistics.org/blog/index.php?pk=60520, Retrieved Mon, 29 Apr 2024 05:29:59 +0000
QR Codes:

Original text written by user:
IsPrivate?No (this computation is public)
User-defined keywords
Estimated Impact135
Family? (F = Feedback message, R = changed R code, M = changed R Module, P = changed Parameters, D = changed Data)
-       [(Partial) Autocorrelation Function] [ws8 module3] [2009-11-27 10:02:23] [b243db81ea3e1f02fb3382887fb0f701] [Current]
Feedback Forum

Post a new message
Dataseries X:
29571
30167
30524
30996
31033
31198
30937
31649
33115
34106
33926
33382
32851
32948
36112
36113
35210
35193
34383
35349
37058
38076
36630
36045
35638
35114
35465
35254
35299
35916
36683
37288
38536
38977
36407
34955
34951
32680
34791
34178
35213
34871
35299
35443
37108
36419
34471
33868
34385
33643
34627
32919
35500
36110
37086
37711
40427
39884
38512
38767


Summary of computational transaction
Raw Inputview raw input (R code)
Raw Outputview raw output of R engine
Computing time2 seconds
R Server'Gwilym Jenkins' @ 72.249.127.135

\begin{tabular}{lllllllll}
\hline
Summary of computational transaction \tabularnewline
Raw Input & view raw input (R code)  \tabularnewline
Raw Output & view raw output of R engine  \tabularnewline
Computing time & 2 seconds \tabularnewline
R Server & 'Gwilym Jenkins' @ 72.249.127.135 \tabularnewline
\hline
\end{tabular}
%Source: https://freestatistics.org/blog/index.php?pk=60520&T=0

[TABLE]
[ROW][C]Summary of computational transaction[/C][/ROW]
[ROW][C]Raw Input[/C][C]view raw input (R code) [/C][/ROW]
[ROW][C]Raw Output[/C][C]view raw output of R engine [/C][/ROW]
[ROW][C]Computing time[/C][C]2 seconds[/C][/ROW]
[ROW][C]R Server[/C][C]'Gwilym Jenkins' @ 72.249.127.135[/C][/ROW]
[/TABLE]
Source: https://freestatistics.org/blog/index.php?pk=60520&T=0

Globally Unique Identifier (entire table): ba.freestatistics.org/blog/index.php?pk=60520&T=0

As an alternative you can also use a QR Code:  

The GUIDs for individual cells are displayed in the table below:

Summary of computational transaction
Raw Inputview raw input (R code)
Raw Outputview raw output of R engine
Computing time2 seconds
R Server'Gwilym Jenkins' @ 72.249.127.135


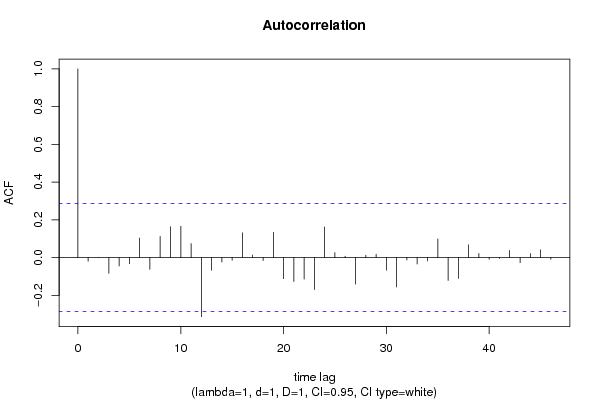
Autocorrelation Function
Time lag kACF(k)T-STATP-value
1-0.019582-0.13420.446891
20.0010040.00690.497268
3-0.083324-0.57120.285279
4-0.044485-0.3050.380867
5-0.032223-0.22090.41306
60.1031230.7070.241536
7-0.062495-0.42840.335142
80.1120260.7680.22316
90.1633581.11990.134218
100.1655541.1350.131069
110.0741220.50820.306862
12-0.313359-2.14830.018438
13-0.067883-0.46540.321904
14-0.023786-0.16310.435582
15-0.014943-0.10240.459421
160.1312920.90010.18633
170.0133630.09160.463698
18-0.016112-0.11050.456259
190.1336950.91660.182025
20-0.111763-0.76620.223692
21-0.12664-0.86820.194848
22-0.113979-0.78140.219242
23-0.169564-1.16250.125456
240.1623821.11320.135635
250.0267630.18350.427606
260.0070730.04850.480765
27-0.140808-0.96530.169659
280.0126570.08680.465611
290.0178960.12270.451438
30-0.066891-0.45860.324324
31-0.156063-1.06990.145061
32-0.013413-0.0920.463563
33-0.034579-0.23710.406818
34-0.017818-0.12220.451649
350.0990010.67870.250323
36-0.121286-0.83150.204948
37-0.110868-0.76010.225503
380.0675230.46290.322781
390.0216450.14840.441334
40-0.009108-0.06240.475237
41-0.005287-0.03620.48562
420.037530.25730.399038
43-0.027029-0.18530.426896
440.0211760.14520.442597
450.0411750.28230.389483
46-0.00907-0.06220.475342
47NANANA
48NANANA

\begin{tabular}{lllllllll}
\hline
Autocorrelation Function \tabularnewline
Time lag k & ACF(k) & T-STAT & P-value \tabularnewline
1 & -0.019582 & -0.1342 & 0.446891 \tabularnewline
2 & 0.001004 & 0.0069 & 0.497268 \tabularnewline
3 & -0.083324 & -0.5712 & 0.285279 \tabularnewline
4 & -0.044485 & -0.305 & 0.380867 \tabularnewline
5 & -0.032223 & -0.2209 & 0.41306 \tabularnewline
6 & 0.103123 & 0.707 & 0.241536 \tabularnewline
7 & -0.062495 & -0.4284 & 0.335142 \tabularnewline
8 & 0.112026 & 0.768 & 0.22316 \tabularnewline
9 & 0.163358 & 1.1199 & 0.134218 \tabularnewline
10 & 0.165554 & 1.135 & 0.131069 \tabularnewline
11 & 0.074122 & 0.5082 & 0.306862 \tabularnewline
12 & -0.313359 & -2.1483 & 0.018438 \tabularnewline
13 & -0.067883 & -0.4654 & 0.321904 \tabularnewline
14 & -0.023786 & -0.1631 & 0.435582 \tabularnewline
15 & -0.014943 & -0.1024 & 0.459421 \tabularnewline
16 & 0.131292 & 0.9001 & 0.18633 \tabularnewline
17 & 0.013363 & 0.0916 & 0.463698 \tabularnewline
18 & -0.016112 & -0.1105 & 0.456259 \tabularnewline
19 & 0.133695 & 0.9166 & 0.182025 \tabularnewline
20 & -0.111763 & -0.7662 & 0.223692 \tabularnewline
21 & -0.12664 & -0.8682 & 0.194848 \tabularnewline
22 & -0.113979 & -0.7814 & 0.219242 \tabularnewline
23 & -0.169564 & -1.1625 & 0.125456 \tabularnewline
24 & 0.162382 & 1.1132 & 0.135635 \tabularnewline
25 & 0.026763 & 0.1835 & 0.427606 \tabularnewline
26 & 0.007073 & 0.0485 & 0.480765 \tabularnewline
27 & -0.140808 & -0.9653 & 0.169659 \tabularnewline
28 & 0.012657 & 0.0868 & 0.465611 \tabularnewline
29 & 0.017896 & 0.1227 & 0.451438 \tabularnewline
30 & -0.066891 & -0.4586 & 0.324324 \tabularnewline
31 & -0.156063 & -1.0699 & 0.145061 \tabularnewline
32 & -0.013413 & -0.092 & 0.463563 \tabularnewline
33 & -0.034579 & -0.2371 & 0.406818 \tabularnewline
34 & -0.017818 & -0.1222 & 0.451649 \tabularnewline
35 & 0.099001 & 0.6787 & 0.250323 \tabularnewline
36 & -0.121286 & -0.8315 & 0.204948 \tabularnewline
37 & -0.110868 & -0.7601 & 0.225503 \tabularnewline
38 & 0.067523 & 0.4629 & 0.322781 \tabularnewline
39 & 0.021645 & 0.1484 & 0.441334 \tabularnewline
40 & -0.009108 & -0.0624 & 0.475237 \tabularnewline
41 & -0.005287 & -0.0362 & 0.48562 \tabularnewline
42 & 0.03753 & 0.2573 & 0.399038 \tabularnewline
43 & -0.027029 & -0.1853 & 0.426896 \tabularnewline
44 & 0.021176 & 0.1452 & 0.442597 \tabularnewline
45 & 0.041175 & 0.2823 & 0.389483 \tabularnewline
46 & -0.00907 & -0.0622 & 0.475342 \tabularnewline
47 & NA & NA & NA \tabularnewline
48 & NA & NA & NA \tabularnewline
\hline
\end{tabular}
%Source: https://freestatistics.org/blog/index.php?pk=60520&T=1

[TABLE]
[ROW][C]Autocorrelation Function[/C][/ROW]
[ROW][C]Time lag k[/C][C]ACF(k)[/C][C]T-STAT[/C][C]P-value[/C][/ROW]
[ROW][C]1[/C][C]-0.019582[/C][C]-0.1342[/C][C]0.446891[/C][/ROW]
[ROW][C]2[/C][C]0.001004[/C][C]0.0069[/C][C]0.497268[/C][/ROW]
[ROW][C]3[/C][C]-0.083324[/C][C]-0.5712[/C][C]0.285279[/C][/ROW]
[ROW][C]4[/C][C]-0.044485[/C][C]-0.305[/C][C]0.380867[/C][/ROW]
[ROW][C]5[/C][C]-0.032223[/C][C]-0.2209[/C][C]0.41306[/C][/ROW]
[ROW][C]6[/C][C]0.103123[/C][C]0.707[/C][C]0.241536[/C][/ROW]
[ROW][C]7[/C][C]-0.062495[/C][C]-0.4284[/C][C]0.335142[/C][/ROW]
[ROW][C]8[/C][C]0.112026[/C][C]0.768[/C][C]0.22316[/C][/ROW]
[ROW][C]9[/C][C]0.163358[/C][C]1.1199[/C][C]0.134218[/C][/ROW]
[ROW][C]10[/C][C]0.165554[/C][C]1.135[/C][C]0.131069[/C][/ROW]
[ROW][C]11[/C][C]0.074122[/C][C]0.5082[/C][C]0.306862[/C][/ROW]
[ROW][C]12[/C][C]-0.313359[/C][C]-2.1483[/C][C]0.018438[/C][/ROW]
[ROW][C]13[/C][C]-0.067883[/C][C]-0.4654[/C][C]0.321904[/C][/ROW]
[ROW][C]14[/C][C]-0.023786[/C][C]-0.1631[/C][C]0.435582[/C][/ROW]
[ROW][C]15[/C][C]-0.014943[/C][C]-0.1024[/C][C]0.459421[/C][/ROW]
[ROW][C]16[/C][C]0.131292[/C][C]0.9001[/C][C]0.18633[/C][/ROW]
[ROW][C]17[/C][C]0.013363[/C][C]0.0916[/C][C]0.463698[/C][/ROW]
[ROW][C]18[/C][C]-0.016112[/C][C]-0.1105[/C][C]0.456259[/C][/ROW]
[ROW][C]19[/C][C]0.133695[/C][C]0.9166[/C][C]0.182025[/C][/ROW]
[ROW][C]20[/C][C]-0.111763[/C][C]-0.7662[/C][C]0.223692[/C][/ROW]
[ROW][C]21[/C][C]-0.12664[/C][C]-0.8682[/C][C]0.194848[/C][/ROW]
[ROW][C]22[/C][C]-0.113979[/C][C]-0.7814[/C][C]0.219242[/C][/ROW]
[ROW][C]23[/C][C]-0.169564[/C][C]-1.1625[/C][C]0.125456[/C][/ROW]
[ROW][C]24[/C][C]0.162382[/C][C]1.1132[/C][C]0.135635[/C][/ROW]
[ROW][C]25[/C][C]0.026763[/C][C]0.1835[/C][C]0.427606[/C][/ROW]
[ROW][C]26[/C][C]0.007073[/C][C]0.0485[/C][C]0.480765[/C][/ROW]
[ROW][C]27[/C][C]-0.140808[/C][C]-0.9653[/C][C]0.169659[/C][/ROW]
[ROW][C]28[/C][C]0.012657[/C][C]0.0868[/C][C]0.465611[/C][/ROW]
[ROW][C]29[/C][C]0.017896[/C][C]0.1227[/C][C]0.451438[/C][/ROW]
[ROW][C]30[/C][C]-0.066891[/C][C]-0.4586[/C][C]0.324324[/C][/ROW]
[ROW][C]31[/C][C]-0.156063[/C][C]-1.0699[/C][C]0.145061[/C][/ROW]
[ROW][C]32[/C][C]-0.013413[/C][C]-0.092[/C][C]0.463563[/C][/ROW]
[ROW][C]33[/C][C]-0.034579[/C][C]-0.2371[/C][C]0.406818[/C][/ROW]
[ROW][C]34[/C][C]-0.017818[/C][C]-0.1222[/C][C]0.451649[/C][/ROW]
[ROW][C]35[/C][C]0.099001[/C][C]0.6787[/C][C]0.250323[/C][/ROW]
[ROW][C]36[/C][C]-0.121286[/C][C]-0.8315[/C][C]0.204948[/C][/ROW]
[ROW][C]37[/C][C]-0.110868[/C][C]-0.7601[/C][C]0.225503[/C][/ROW]
[ROW][C]38[/C][C]0.067523[/C][C]0.4629[/C][C]0.322781[/C][/ROW]
[ROW][C]39[/C][C]0.021645[/C][C]0.1484[/C][C]0.441334[/C][/ROW]
[ROW][C]40[/C][C]-0.009108[/C][C]-0.0624[/C][C]0.475237[/C][/ROW]
[ROW][C]41[/C][C]-0.005287[/C][C]-0.0362[/C][C]0.48562[/C][/ROW]
[ROW][C]42[/C][C]0.03753[/C][C]0.2573[/C][C]0.399038[/C][/ROW]
[ROW][C]43[/C][C]-0.027029[/C][C]-0.1853[/C][C]0.426896[/C][/ROW]
[ROW][C]44[/C][C]0.021176[/C][C]0.1452[/C][C]0.442597[/C][/ROW]
[ROW][C]45[/C][C]0.041175[/C][C]0.2823[/C][C]0.389483[/C][/ROW]
[ROW][C]46[/C][C]-0.00907[/C][C]-0.0622[/C][C]0.475342[/C][/ROW]
[ROW][C]47[/C][C]NA[/C][C]NA[/C][C]NA[/C][/ROW]
[ROW][C]48[/C][C]NA[/C][C]NA[/C][C]NA[/C][/ROW]
[/TABLE]
Source: https://freestatistics.org/blog/index.php?pk=60520&T=1

Globally Unique Identifier (entire table): ba.freestatistics.org/blog/index.php?pk=60520&T=1

As an alternative you can also use a QR Code:  

The GUIDs for individual cells are displayed in the table below:

Autocorrelation Function
Time lag kACF(k)T-STATP-value
1-0.019582-0.13420.446891
20.0010040.00690.497268
3-0.083324-0.57120.285279
4-0.044485-0.3050.380867
5-0.032223-0.22090.41306
60.1031230.7070.241536
7-0.062495-0.42840.335142
80.1120260.7680.22316
90.1633581.11990.134218
100.1655541.1350.131069
110.0741220.50820.306862
12-0.313359-2.14830.018438
13-0.067883-0.46540.321904
14-0.023786-0.16310.435582
15-0.014943-0.10240.459421
160.1312920.90010.18633
170.0133630.09160.463698
18-0.016112-0.11050.456259
190.1336950.91660.182025
20-0.111763-0.76620.223692
21-0.12664-0.86820.194848
22-0.113979-0.78140.219242
23-0.169564-1.16250.125456
240.1623821.11320.135635
250.0267630.18350.427606
260.0070730.04850.480765
27-0.140808-0.96530.169659
280.0126570.08680.465611
290.0178960.12270.451438
30-0.066891-0.45860.324324
31-0.156063-1.06990.145061
32-0.013413-0.0920.463563
33-0.034579-0.23710.406818
34-0.017818-0.12220.451649
350.0990010.67870.250323
36-0.121286-0.83150.204948
37-0.110868-0.76010.225503
380.0675230.46290.322781
390.0216450.14840.441334
40-0.009108-0.06240.475237
41-0.005287-0.03620.48562
420.037530.25730.399038
43-0.027029-0.18530.426896
440.0211760.14520.442597
450.0411750.28230.389483
46-0.00907-0.06220.475342
47NANANA
48NANANA


Partial Autocorrelation Function
Time lag kPACF(k)T-STATP-value
1-0.019582-0.13420.446891
20.0006210.00430.498311
3-0.083324-0.57120.285279
4-0.048094-0.32970.37154
5-0.034547-0.23680.406904
60.0955150.65480.257888
7-0.067078-0.45990.323866
80.1047170.71790.238186
90.1852851.27020.105124
100.183751.25970.106994
110.1197520.8210.207901
12-0.304165-2.08520.021252
13-0.045196-0.30980.379023
14-0.025236-0.1730.431694
15-0.0809-0.55460.290891
160.088830.6090.272732
17-0.045034-0.30870.379444
18-0.003006-0.02060.491822
190.0627650.43030.334473
20-0.122455-0.83950.202717
21-0.048516-0.33260.370454
22-0.036365-0.24930.402107
23-0.113133-0.77560.220936
240.0928930.63680.263658
25-0.063308-0.4340.333132
26-0.018004-0.12340.451147
27-0.219554-1.50520.069484
280.0600950.4120.341111
290.1196450.82020.208109
30-0.108314-0.74260.23072
310.0266110.18240.428013
32-0.049519-0.33950.367879
33-0.044377-0.30420.381146
34-0.121272-0.83140.204977
35-0.058742-0.40270.344492
360.0388030.2660.395693
37-0.107919-0.73990.231533
380.0960990.65880.256612
390.0112010.07680.469558
40-0.000324-0.00220.499118
410.092680.63540.264131
420.0414410.28410.388788
43-0.031138-0.21350.41594
440.0010040.00690.497269
450.0186480.12780.44941
460.0284770.19520.423027
47NANANA
48NANANA

\begin{tabular}{lllllllll}
\hline
Partial Autocorrelation Function \tabularnewline
Time lag k & PACF(k) & T-STAT & P-value \tabularnewline
1 & -0.019582 & -0.1342 & 0.446891 \tabularnewline
2 & 0.000621 & 0.0043 & 0.498311 \tabularnewline
3 & -0.083324 & -0.5712 & 0.285279 \tabularnewline
4 & -0.048094 & -0.3297 & 0.37154 \tabularnewline
5 & -0.034547 & -0.2368 & 0.406904 \tabularnewline
6 & 0.095515 & 0.6548 & 0.257888 \tabularnewline
7 & -0.067078 & -0.4599 & 0.323866 \tabularnewline
8 & 0.104717 & 0.7179 & 0.238186 \tabularnewline
9 & 0.185285 & 1.2702 & 0.105124 \tabularnewline
10 & 0.18375 & 1.2597 & 0.106994 \tabularnewline
11 & 0.119752 & 0.821 & 0.207901 \tabularnewline
12 & -0.304165 & -2.0852 & 0.021252 \tabularnewline
13 & -0.045196 & -0.3098 & 0.379023 \tabularnewline
14 & -0.025236 & -0.173 & 0.431694 \tabularnewline
15 & -0.0809 & -0.5546 & 0.290891 \tabularnewline
16 & 0.08883 & 0.609 & 0.272732 \tabularnewline
17 & -0.045034 & -0.3087 & 0.379444 \tabularnewline
18 & -0.003006 & -0.0206 & 0.491822 \tabularnewline
19 & 0.062765 & 0.4303 & 0.334473 \tabularnewline
20 & -0.122455 & -0.8395 & 0.202717 \tabularnewline
21 & -0.048516 & -0.3326 & 0.370454 \tabularnewline
22 & -0.036365 & -0.2493 & 0.402107 \tabularnewline
23 & -0.113133 & -0.7756 & 0.220936 \tabularnewline
24 & 0.092893 & 0.6368 & 0.263658 \tabularnewline
25 & -0.063308 & -0.434 & 0.333132 \tabularnewline
26 & -0.018004 & -0.1234 & 0.451147 \tabularnewline
27 & -0.219554 & -1.5052 & 0.069484 \tabularnewline
28 & 0.060095 & 0.412 & 0.341111 \tabularnewline
29 & 0.119645 & 0.8202 & 0.208109 \tabularnewline
30 & -0.108314 & -0.7426 & 0.23072 \tabularnewline
31 & 0.026611 & 0.1824 & 0.428013 \tabularnewline
32 & -0.049519 & -0.3395 & 0.367879 \tabularnewline
33 & -0.044377 & -0.3042 & 0.381146 \tabularnewline
34 & -0.121272 & -0.8314 & 0.204977 \tabularnewline
35 & -0.058742 & -0.4027 & 0.344492 \tabularnewline
36 & 0.038803 & 0.266 & 0.395693 \tabularnewline
37 & -0.107919 & -0.7399 & 0.231533 \tabularnewline
38 & 0.096099 & 0.6588 & 0.256612 \tabularnewline
39 & 0.011201 & 0.0768 & 0.469558 \tabularnewline
40 & -0.000324 & -0.0022 & 0.499118 \tabularnewline
41 & 0.09268 & 0.6354 & 0.264131 \tabularnewline
42 & 0.041441 & 0.2841 & 0.388788 \tabularnewline
43 & -0.031138 & -0.2135 & 0.41594 \tabularnewline
44 & 0.001004 & 0.0069 & 0.497269 \tabularnewline
45 & 0.018648 & 0.1278 & 0.44941 \tabularnewline
46 & 0.028477 & 0.1952 & 0.423027 \tabularnewline
47 & NA & NA & NA \tabularnewline
48 & NA & NA & NA \tabularnewline
\hline
\end{tabular}
%Source: https://freestatistics.org/blog/index.php?pk=60520&T=2

[TABLE]
[ROW][C]Partial Autocorrelation Function[/C][/ROW]
[ROW][C]Time lag k[/C][C]PACF(k)[/C][C]T-STAT[/C][C]P-value[/C][/ROW]
[ROW][C]1[/C][C]-0.019582[/C][C]-0.1342[/C][C]0.446891[/C][/ROW]
[ROW][C]2[/C][C]0.000621[/C][C]0.0043[/C][C]0.498311[/C][/ROW]
[ROW][C]3[/C][C]-0.083324[/C][C]-0.5712[/C][C]0.285279[/C][/ROW]
[ROW][C]4[/C][C]-0.048094[/C][C]-0.3297[/C][C]0.37154[/C][/ROW]
[ROW][C]5[/C][C]-0.034547[/C][C]-0.2368[/C][C]0.406904[/C][/ROW]
[ROW][C]6[/C][C]0.095515[/C][C]0.6548[/C][C]0.257888[/C][/ROW]
[ROW][C]7[/C][C]-0.067078[/C][C]-0.4599[/C][C]0.323866[/C][/ROW]
[ROW][C]8[/C][C]0.104717[/C][C]0.7179[/C][C]0.238186[/C][/ROW]
[ROW][C]9[/C][C]0.185285[/C][C]1.2702[/C][C]0.105124[/C][/ROW]
[ROW][C]10[/C][C]0.18375[/C][C]1.2597[/C][C]0.106994[/C][/ROW]
[ROW][C]11[/C][C]0.119752[/C][C]0.821[/C][C]0.207901[/C][/ROW]
[ROW][C]12[/C][C]-0.304165[/C][C]-2.0852[/C][C]0.021252[/C][/ROW]
[ROW][C]13[/C][C]-0.045196[/C][C]-0.3098[/C][C]0.379023[/C][/ROW]
[ROW][C]14[/C][C]-0.025236[/C][C]-0.173[/C][C]0.431694[/C][/ROW]
[ROW][C]15[/C][C]-0.0809[/C][C]-0.5546[/C][C]0.290891[/C][/ROW]
[ROW][C]16[/C][C]0.08883[/C][C]0.609[/C][C]0.272732[/C][/ROW]
[ROW][C]17[/C][C]-0.045034[/C][C]-0.3087[/C][C]0.379444[/C][/ROW]
[ROW][C]18[/C][C]-0.003006[/C][C]-0.0206[/C][C]0.491822[/C][/ROW]
[ROW][C]19[/C][C]0.062765[/C][C]0.4303[/C][C]0.334473[/C][/ROW]
[ROW][C]20[/C][C]-0.122455[/C][C]-0.8395[/C][C]0.202717[/C][/ROW]
[ROW][C]21[/C][C]-0.048516[/C][C]-0.3326[/C][C]0.370454[/C][/ROW]
[ROW][C]22[/C][C]-0.036365[/C][C]-0.2493[/C][C]0.402107[/C][/ROW]
[ROW][C]23[/C][C]-0.113133[/C][C]-0.7756[/C][C]0.220936[/C][/ROW]
[ROW][C]24[/C][C]0.092893[/C][C]0.6368[/C][C]0.263658[/C][/ROW]
[ROW][C]25[/C][C]-0.063308[/C][C]-0.434[/C][C]0.333132[/C][/ROW]
[ROW][C]26[/C][C]-0.018004[/C][C]-0.1234[/C][C]0.451147[/C][/ROW]
[ROW][C]27[/C][C]-0.219554[/C][C]-1.5052[/C][C]0.069484[/C][/ROW]
[ROW][C]28[/C][C]0.060095[/C][C]0.412[/C][C]0.341111[/C][/ROW]
[ROW][C]29[/C][C]0.119645[/C][C]0.8202[/C][C]0.208109[/C][/ROW]
[ROW][C]30[/C][C]-0.108314[/C][C]-0.7426[/C][C]0.23072[/C][/ROW]
[ROW][C]31[/C][C]0.026611[/C][C]0.1824[/C][C]0.428013[/C][/ROW]
[ROW][C]32[/C][C]-0.049519[/C][C]-0.3395[/C][C]0.367879[/C][/ROW]
[ROW][C]33[/C][C]-0.044377[/C][C]-0.3042[/C][C]0.381146[/C][/ROW]
[ROW][C]34[/C][C]-0.121272[/C][C]-0.8314[/C][C]0.204977[/C][/ROW]
[ROW][C]35[/C][C]-0.058742[/C][C]-0.4027[/C][C]0.344492[/C][/ROW]
[ROW][C]36[/C][C]0.038803[/C][C]0.266[/C][C]0.395693[/C][/ROW]
[ROW][C]37[/C][C]-0.107919[/C][C]-0.7399[/C][C]0.231533[/C][/ROW]
[ROW][C]38[/C][C]0.096099[/C][C]0.6588[/C][C]0.256612[/C][/ROW]
[ROW][C]39[/C][C]0.011201[/C][C]0.0768[/C][C]0.469558[/C][/ROW]
[ROW][C]40[/C][C]-0.000324[/C][C]-0.0022[/C][C]0.499118[/C][/ROW]
[ROW][C]41[/C][C]0.09268[/C][C]0.6354[/C][C]0.264131[/C][/ROW]
[ROW][C]42[/C][C]0.041441[/C][C]0.2841[/C][C]0.388788[/C][/ROW]
[ROW][C]43[/C][C]-0.031138[/C][C]-0.2135[/C][C]0.41594[/C][/ROW]
[ROW][C]44[/C][C]0.001004[/C][C]0.0069[/C][C]0.497269[/C][/ROW]
[ROW][C]45[/C][C]0.018648[/C][C]0.1278[/C][C]0.44941[/C][/ROW]
[ROW][C]46[/C][C]0.028477[/C][C]0.1952[/C][C]0.423027[/C][/ROW]
[ROW][C]47[/C][C]NA[/C][C]NA[/C][C]NA[/C][/ROW]
[ROW][C]48[/C][C]NA[/C][C]NA[/C][C]NA[/C][/ROW]
[/TABLE]
Source: https://freestatistics.org/blog/index.php?pk=60520&T=2

Globally Unique Identifier (entire table): ba.freestatistics.org/blog/index.php?pk=60520&T=2

As an alternative you can also use a QR Code:  

The GUIDs for individual cells are displayed in the table below:

Partial Autocorrelation Function
Time lag kPACF(k)T-STATP-value
1-0.019582-0.13420.446891
20.0006210.00430.498311
3-0.083324-0.57120.285279
4-0.048094-0.32970.37154
5-0.034547-0.23680.406904
60.0955150.65480.257888
7-0.067078-0.45990.323866
80.1047170.71790.238186
90.1852851.27020.105124
100.183751.25970.106994
110.1197520.8210.207901
12-0.304165-2.08520.021252
13-0.045196-0.30980.379023
14-0.025236-0.1730.431694
15-0.0809-0.55460.290891
160.088830.6090.272732
17-0.045034-0.30870.379444
18-0.003006-0.02060.491822
190.0627650.43030.334473
20-0.122455-0.83950.202717
21-0.048516-0.33260.370454
22-0.036365-0.24930.402107
23-0.113133-0.77560.220936
240.0928930.63680.263658
25-0.063308-0.4340.333132
26-0.018004-0.12340.451147
27-0.219554-1.50520.069484
280.0600950.4120.341111
290.1196450.82020.208109
30-0.108314-0.74260.23072
310.0266110.18240.428013
32-0.049519-0.33950.367879
33-0.044377-0.30420.381146
34-0.121272-0.83140.204977
35-0.058742-0.40270.344492
360.0388030.2660.395693
37-0.107919-0.73990.231533
380.0960990.65880.256612
390.0112010.07680.469558
40-0.000324-0.00220.499118
410.092680.63540.264131
420.0414410.28410.388788
43-0.031138-0.21350.41594
440.0010040.00690.497269
450.0186480.12780.44941
460.0284770.19520.423027
47NANANA
48NANANA


Parameters (Session):
par1 = 48 ; par2 = 1 ; par3 = 1 ; par4 = 1 ; par5 = 12 ; par6 = White Noise ; par7 = 0.95 ;
Parameters (R input):
par1 = 48 ; par2 = 1 ; par3 = 1 ; par4 = 1 ; par5 = 12 ; par6 = White Noise ; par7 = 0.95 ;
R code (references can be found in the software module):
if (par1 == 'Default') {
par1 = 10*log10(length(x))
} else {
par1 <- as.numeric(par1)
}
par2 <- as.numeric(par2)
par3 <- as.numeric(par3)
par4 <- as.numeric(par4)
par5 <- as.numeric(par5)
if (par6 == 'White Noise') par6 <- 'white' else par6 <- 'ma'
par7 <- as.numeric(par7)
if (par2 == 0) {
x <- log(x)
} else {
x <- (x ^ par2 - 1) / par2
}
if (par3 > 0) x <- diff(x,lag=1,difference=par3)
if (par4 > 0) x <- diff(x,lag=par5,difference=par4)
bitmap(file='pic1.png')
racf <- acf(x, par1, main='Autocorrelation', xlab='time lag', ylab='ACF', ci.type=par6, ci=par7, sub=paste('(lambda=',par2,', d=',par3,', D=',par4,', CI=', par7, ', CI type=',par6,')',sep=''))
dev.off()
bitmap(file='pic2.png')
rpacf <- pacf(x,par1,main='Partial Autocorrelation',xlab='lags',ylab='PACF')
dev.off()
(myacf <- c(racf$acf))
(mypacf <- c(rpacf$acf))
lengthx <- length(x)
sqrtn <- sqrt(lengthx)
load(file='createtable')
a<-table.start()
a<-table.row.start(a)
a<-table.element(a,'Autocorrelation Function',4,TRUE)
a<-table.row.end(a)
a<-table.row.start(a)
a<-table.element(a,'Time lag k',header=TRUE)
a<-table.element(a,hyperlink('basics.htm','ACF(k)','click here for more information about the Autocorrelation Function'),header=TRUE)
a<-table.element(a,'T-STAT',header=TRUE)
a<-table.element(a,'P-value',header=TRUE)
a<-table.row.end(a)
for (i in 2:(par1+1)) {
a<-table.row.start(a)
a<-table.element(a,i-1,header=TRUE)
a<-table.element(a,round(myacf[i],6))
mytstat <- myacf[i]*sqrtn
a<-table.element(a,round(mytstat,4))
a<-table.element(a,round(1-pt(abs(mytstat),lengthx),6))
a<-table.row.end(a)
}
a<-table.end(a)
table.save(a,file='mytable.tab')
a<-table.start()
a<-table.row.start(a)
a<-table.element(a,'Partial Autocorrelation Function',4,TRUE)
a<-table.row.end(a)
a<-table.row.start(a)
a<-table.element(a,'Time lag k',header=TRUE)
a<-table.element(a,hyperlink('basics.htm','PACF(k)','click here for more information about the Partial Autocorrelation Function'),header=TRUE)
a<-table.element(a,'T-STAT',header=TRUE)
a<-table.element(a,'P-value',header=TRUE)
a<-table.row.end(a)
for (i in 1:par1) {
a<-table.row.start(a)
a<-table.element(a,i,header=TRUE)
a<-table.element(a,round(mypacf[i],6))
mytstat <- mypacf[i]*sqrtn
a<-table.element(a,round(mytstat,4))
a<-table.element(a,round(1-pt(abs(mytstat),lengthx),6))
a<-table.row.end(a)
}
a<-table.end(a)
table.save(a,file='mytable1.tab')