Free Statistics

of Irreproducible Research!

Author's title

Author*The author of this computation has been verified*
R Software Modulerwasp_autocorrelation.wasp
Title produced by software(Partial) Autocorrelation Function
Date of computationFri, 27 Nov 2009 03:55:31 -0700
Cite this page as followsStatistical Computations at FreeStatistics.org, Office for Research Development and Education, URL https://freestatistics.org/blog/index.php?v=date/2009/Nov/27/t1259319405k2rvoe593fwqma5.htm/, Retrieved Mon, 29 Apr 2024 06:50:25 +0000
Statistical Computations at FreeStatistics.org, Office for Research Development and Education, URL https://freestatistics.org/blog/index.php?pk=60561, Retrieved Mon, 29 Apr 2024 06:50:25 +0000
QR Codes:

Original text written by user:
IsPrivate?No (this computation is public)
User-defined keywords
Estimated Impact131
Family? (F = Feedback message, R = changed R code, M = changed R Module, P = changed Parameters, D = changed Data)
F       [(Partial) Autocorrelation Function] [WS 8 Identifying ...] [2009-11-27 10:55:31] [2694a35f9be9144abd040893a0238ab5] [Current]
- R PD    [(Partial) Autocorrelation Function] [WS08 - Review ACF1] [2009-12-01 21:35:06] [df6326eec97a6ca984a853b142930499]
Feedback Forum
2009-12-01 21:37:16 [Nick Aerts] [reply
Het aantal timelags dat je instelde was te laag. Ik heb in deze calculator het aantal timelags op 36 gezet: http://www.freestatistics.org/blog/index.php?v=date/2009/Dec/01/t12597033510vncp1tp3h3ici2.htm/.

Zo krijg je een beter zicht op de ACF
2009-12-01 21:43:23 [Nick Aerts] [reply
Mijn vorige boodschap was overbodig. Je zet je fout recht.

Post a new message
Dataseries X:
96.8
114.1
110.3
103.9
101.6
94.6
95.9
104.7
102.8
98.1
113.9
80.9
95.7
113.2
105.9
108.8
102.3
99
100.7
115.5
100.7
109.9
114.6
85.4
100.5
114.8
116.5
112.9
102
106
105.3
118.8
106.1
109.3
117.2
92.5
104.2
112.5
122.4
113.3
100
110.7
112.8
109.8
117.3
109.1
115.9
96
99.8
116.8
115.7
99.4
94.3
91
93.2
103.1
94.1
91.8
102.7
82.6


Summary of computational transaction
Raw Inputview raw input (R code)
Raw Outputview raw output of R engine
Computing time0 seconds
R Server'Gwilym Jenkins' @ 72.249.127.135

\begin{tabular}{lllllllll}
\hline
Summary of computational transaction \tabularnewline
Raw Input & view raw input (R code)  \tabularnewline
Raw Output & view raw output of R engine  \tabularnewline
Computing time & 0 seconds \tabularnewline
R Server & 'Gwilym Jenkins' @ 72.249.127.135 \tabularnewline
\hline
\end{tabular}
%Source: https://freestatistics.org/blog/index.php?pk=60561&T=0

[TABLE]
[ROW][C]Summary of computational transaction[/C][/ROW]
[ROW][C]Raw Input[/C][C]view raw input (R code) [/C][/ROW]
[ROW][C]Raw Output[/C][C]view raw output of R engine [/C][/ROW]
[ROW][C]Computing time[/C][C]0 seconds[/C][/ROW]
[ROW][C]R Server[/C][C]'Gwilym Jenkins' @ 72.249.127.135[/C][/ROW]
[/TABLE]
Source: https://freestatistics.org/blog/index.php?pk=60561&T=0

Globally Unique Identifier (entire table): ba.freestatistics.org/blog/index.php?pk=60561&T=0

As an alternative you can also use a QR Code:  

The GUIDs for individual cells are displayed in the table below:

Summary of computational transaction
Raw Inputview raw input (R code)
Raw Outputview raw output of R engine
Computing time0 seconds
R Server'Gwilym Jenkins' @ 72.249.127.135


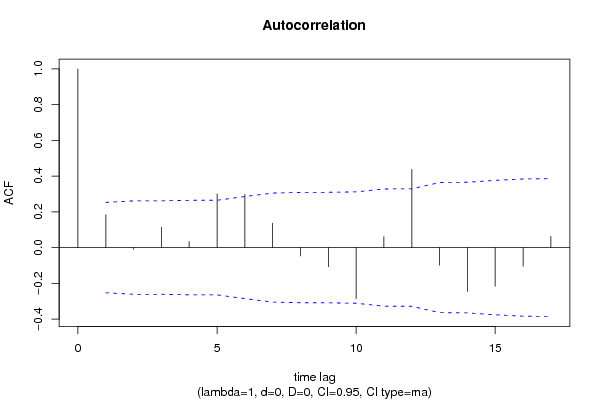
Autocorrelation Function
Time lag kACF(k)T-STATP-value
10.1840741.42580.07955
2-0.00925-0.07160.47156
30.1134440.87870.191526
40.0340110.26340.396553
50.3004072.32690.011681
60.2974632.30410.012347
70.1365231.05750.147261
8-0.047156-0.36530.358097
9-0.107359-0.83160.204467
10-0.286103-2.21610.015243
110.0607250.47040.319896
120.4374473.38840.000623
13-0.098623-0.76390.223952
14-0.245833-1.90420.03084
15-0.21719-1.68230.04885
16-0.104338-0.80820.211085
170.0621070.48110.316104

\begin{tabular}{lllllllll}
\hline
Autocorrelation Function \tabularnewline
Time lag k & ACF(k) & T-STAT & P-value \tabularnewline
1 & 0.184074 & 1.4258 & 0.07955 \tabularnewline
2 & -0.00925 & -0.0716 & 0.47156 \tabularnewline
3 & 0.113444 & 0.8787 & 0.191526 \tabularnewline
4 & 0.034011 & 0.2634 & 0.396553 \tabularnewline
5 & 0.300407 & 2.3269 & 0.011681 \tabularnewline
6 & 0.297463 & 2.3041 & 0.012347 \tabularnewline
7 & 0.136523 & 1.0575 & 0.147261 \tabularnewline
8 & -0.047156 & -0.3653 & 0.358097 \tabularnewline
9 & -0.107359 & -0.8316 & 0.204467 \tabularnewline
10 & -0.286103 & -2.2161 & 0.015243 \tabularnewline
11 & 0.060725 & 0.4704 & 0.319896 \tabularnewline
12 & 0.437447 & 3.3884 & 0.000623 \tabularnewline
13 & -0.098623 & -0.7639 & 0.223952 \tabularnewline
14 & -0.245833 & -1.9042 & 0.03084 \tabularnewline
15 & -0.21719 & -1.6823 & 0.04885 \tabularnewline
16 & -0.104338 & -0.8082 & 0.211085 \tabularnewline
17 & 0.062107 & 0.4811 & 0.316104 \tabularnewline
\hline
\end{tabular}
%Source: https://freestatistics.org/blog/index.php?pk=60561&T=1

[TABLE]
[ROW][C]Autocorrelation Function[/C][/ROW]
[ROW][C]Time lag k[/C][C]ACF(k)[/C][C]T-STAT[/C][C]P-value[/C][/ROW]
[ROW][C]1[/C][C]0.184074[/C][C]1.4258[/C][C]0.07955[/C][/ROW]
[ROW][C]2[/C][C]-0.00925[/C][C]-0.0716[/C][C]0.47156[/C][/ROW]
[ROW][C]3[/C][C]0.113444[/C][C]0.8787[/C][C]0.191526[/C][/ROW]
[ROW][C]4[/C][C]0.034011[/C][C]0.2634[/C][C]0.396553[/C][/ROW]
[ROW][C]5[/C][C]0.300407[/C][C]2.3269[/C][C]0.011681[/C][/ROW]
[ROW][C]6[/C][C]0.297463[/C][C]2.3041[/C][C]0.012347[/C][/ROW]
[ROW][C]7[/C][C]0.136523[/C][C]1.0575[/C][C]0.147261[/C][/ROW]
[ROW][C]8[/C][C]-0.047156[/C][C]-0.3653[/C][C]0.358097[/C][/ROW]
[ROW][C]9[/C][C]-0.107359[/C][C]-0.8316[/C][C]0.204467[/C][/ROW]
[ROW][C]10[/C][C]-0.286103[/C][C]-2.2161[/C][C]0.015243[/C][/ROW]
[ROW][C]11[/C][C]0.060725[/C][C]0.4704[/C][C]0.319896[/C][/ROW]
[ROW][C]12[/C][C]0.437447[/C][C]3.3884[/C][C]0.000623[/C][/ROW]
[ROW][C]13[/C][C]-0.098623[/C][C]-0.7639[/C][C]0.223952[/C][/ROW]
[ROW][C]14[/C][C]-0.245833[/C][C]-1.9042[/C][C]0.03084[/C][/ROW]
[ROW][C]15[/C][C]-0.21719[/C][C]-1.6823[/C][C]0.04885[/C][/ROW]
[ROW][C]16[/C][C]-0.104338[/C][C]-0.8082[/C][C]0.211085[/C][/ROW]
[ROW][C]17[/C][C]0.062107[/C][C]0.4811[/C][C]0.316104[/C][/ROW]
[/TABLE]
Source: https://freestatistics.org/blog/index.php?pk=60561&T=1

Globally Unique Identifier (entire table): ba.freestatistics.org/blog/index.php?pk=60561&T=1

As an alternative you can also use a QR Code:  

The GUIDs for individual cells are displayed in the table below:

Autocorrelation Function
Time lag kACF(k)T-STATP-value
10.1840741.42580.07955
2-0.00925-0.07160.47156
30.1134440.87870.191526
40.0340110.26340.396553
50.3004072.32690.011681
60.2974632.30410.012347
70.1365231.05750.147261
8-0.047156-0.36530.358097
9-0.107359-0.83160.204467
10-0.286103-2.21610.015243
110.0607250.47040.319896
120.4374473.38840.000623
13-0.098623-0.76390.223952
14-0.245833-1.90420.03084
15-0.21719-1.68230.04885
16-0.104338-0.80820.211085
170.0621070.48110.316104


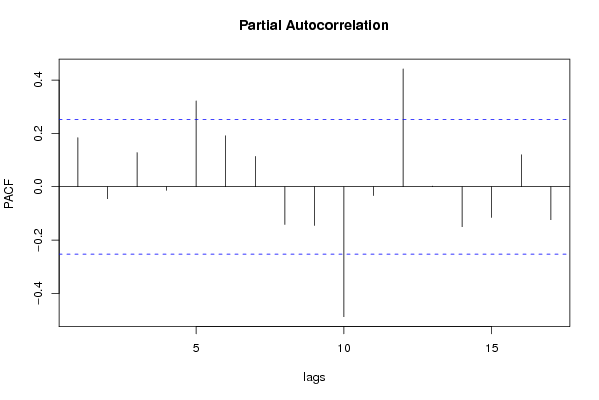
Partial Autocorrelation Function
Time lag kPACF(k)T-STATP-value
10.1840741.42580.07955
2-0.044646-0.34580.365342
30.1280250.99170.162669
4-0.013347-0.10340.459
50.3219112.49350.007712
60.1913431.48210.071769
70.1135370.87950.191332
8-0.141646-1.09720.138473
9-0.144951-1.12280.133001
10-0.4874-3.77540.000184
11-0.033089-0.25630.399295
120.441963.42340.00056
130.0023440.01820.492788
14-0.149667-1.15930.12546
15-0.115099-0.89160.188098
160.1198650.92850.178442
17-0.123541-0.95690.171217

\begin{tabular}{lllllllll}
\hline
Partial Autocorrelation Function \tabularnewline
Time lag k & PACF(k) & T-STAT & P-value \tabularnewline
1 & 0.184074 & 1.4258 & 0.07955 \tabularnewline
2 & -0.044646 & -0.3458 & 0.365342 \tabularnewline
3 & 0.128025 & 0.9917 & 0.162669 \tabularnewline
4 & -0.013347 & -0.1034 & 0.459 \tabularnewline
5 & 0.321911 & 2.4935 & 0.007712 \tabularnewline
6 & 0.191343 & 1.4821 & 0.071769 \tabularnewline
7 & 0.113537 & 0.8795 & 0.191332 \tabularnewline
8 & -0.141646 & -1.0972 & 0.138473 \tabularnewline
9 & -0.144951 & -1.1228 & 0.133001 \tabularnewline
10 & -0.4874 & -3.7754 & 0.000184 \tabularnewline
11 & -0.033089 & -0.2563 & 0.399295 \tabularnewline
12 & 0.44196 & 3.4234 & 0.00056 \tabularnewline
13 & 0.002344 & 0.0182 & 0.492788 \tabularnewline
14 & -0.149667 & -1.1593 & 0.12546 \tabularnewline
15 & -0.115099 & -0.8916 & 0.188098 \tabularnewline
16 & 0.119865 & 0.9285 & 0.178442 \tabularnewline
17 & -0.123541 & -0.9569 & 0.171217 \tabularnewline
\hline
\end{tabular}
%Source: https://freestatistics.org/blog/index.php?pk=60561&T=2

[TABLE]
[ROW][C]Partial Autocorrelation Function[/C][/ROW]
[ROW][C]Time lag k[/C][C]PACF(k)[/C][C]T-STAT[/C][C]P-value[/C][/ROW]
[ROW][C]1[/C][C]0.184074[/C][C]1.4258[/C][C]0.07955[/C][/ROW]
[ROW][C]2[/C][C]-0.044646[/C][C]-0.3458[/C][C]0.365342[/C][/ROW]
[ROW][C]3[/C][C]0.128025[/C][C]0.9917[/C][C]0.162669[/C][/ROW]
[ROW][C]4[/C][C]-0.013347[/C][C]-0.1034[/C][C]0.459[/C][/ROW]
[ROW][C]5[/C][C]0.321911[/C][C]2.4935[/C][C]0.007712[/C][/ROW]
[ROW][C]6[/C][C]0.191343[/C][C]1.4821[/C][C]0.071769[/C][/ROW]
[ROW][C]7[/C][C]0.113537[/C][C]0.8795[/C][C]0.191332[/C][/ROW]
[ROW][C]8[/C][C]-0.141646[/C][C]-1.0972[/C][C]0.138473[/C][/ROW]
[ROW][C]9[/C][C]-0.144951[/C][C]-1.1228[/C][C]0.133001[/C][/ROW]
[ROW][C]10[/C][C]-0.4874[/C][C]-3.7754[/C][C]0.000184[/C][/ROW]
[ROW][C]11[/C][C]-0.033089[/C][C]-0.2563[/C][C]0.399295[/C][/ROW]
[ROW][C]12[/C][C]0.44196[/C][C]3.4234[/C][C]0.00056[/C][/ROW]
[ROW][C]13[/C][C]0.002344[/C][C]0.0182[/C][C]0.492788[/C][/ROW]
[ROW][C]14[/C][C]-0.149667[/C][C]-1.1593[/C][C]0.12546[/C][/ROW]
[ROW][C]15[/C][C]-0.115099[/C][C]-0.8916[/C][C]0.188098[/C][/ROW]
[ROW][C]16[/C][C]0.119865[/C][C]0.9285[/C][C]0.178442[/C][/ROW]
[ROW][C]17[/C][C]-0.123541[/C][C]-0.9569[/C][C]0.171217[/C][/ROW]
[/TABLE]
Source: https://freestatistics.org/blog/index.php?pk=60561&T=2

Globally Unique Identifier (entire table): ba.freestatistics.org/blog/index.php?pk=60561&T=2

As an alternative you can also use a QR Code:  

The GUIDs for individual cells are displayed in the table below:

Partial Autocorrelation Function
Time lag kPACF(k)T-STATP-value
10.1840741.42580.07955
2-0.044646-0.34580.365342
30.1280250.99170.162669
4-0.013347-0.10340.459
50.3219112.49350.007712
60.1913431.48210.071769
70.1135370.87950.191332
8-0.141646-1.09720.138473
9-0.144951-1.12280.133001
10-0.4874-3.77540.000184
11-0.033089-0.25630.399295
120.441963.42340.00056
130.0023440.01820.492788
14-0.149667-1.15930.12546
15-0.115099-0.89160.188098
160.1198650.92850.178442
17-0.123541-0.95690.171217


Parameters (Session):
par1 = Default ; par2 = 1 ; par3 = 0 ; par4 = 0 ; par5 = 12 ; par6 = MA ; par7 = 0.95 ;
Parameters (R input):
par1 = Default ; par2 = 1 ; par3 = 0 ; par4 = 0 ; par5 = 12 ; par6 = MA ; par7 = 0.95 ;
R code (references can be found in the software module):
if (par1 == 'Default') {
par1 = 10*log10(length(x))
} else {
par1 <- as.numeric(par1)
}
par2 <- as.numeric(par2)
par3 <- as.numeric(par3)
par4 <- as.numeric(par4)
par5 <- as.numeric(par5)
if (par6 == 'White Noise') par6 <- 'white' else par6 <- 'ma'
par7 <- as.numeric(par7)
if (par2 == 0) {
x <- log(x)
} else {
x <- (x ^ par2 - 1) / par2
}
if (par3 > 0) x <- diff(x,lag=1,difference=par3)
if (par4 > 0) x <- diff(x,lag=par5,difference=par4)
bitmap(file='pic1.png')
racf <- acf(x, par1, main='Autocorrelation', xlab='time lag', ylab='ACF', ci.type=par6, ci=par7, sub=paste('(lambda=',par2,', d=',par3,', D=',par4,', CI=', par7, ', CI type=',par6,')',sep=''))
dev.off()
bitmap(file='pic2.png')
rpacf <- pacf(x,par1,main='Partial Autocorrelation',xlab='lags',ylab='PACF')
dev.off()
(myacf <- c(racf$acf))
(mypacf <- c(rpacf$acf))
lengthx <- length(x)
sqrtn <- sqrt(lengthx)
load(file='createtable')
a<-table.start()
a<-table.row.start(a)
a<-table.element(a,'Autocorrelation Function',4,TRUE)
a<-table.row.end(a)
a<-table.row.start(a)
a<-table.element(a,'Time lag k',header=TRUE)
a<-table.element(a,hyperlink('basics.htm','ACF(k)','click here for more information about the Autocorrelation Function'),header=TRUE)
a<-table.element(a,'T-STAT',header=TRUE)
a<-table.element(a,'P-value',header=TRUE)
a<-table.row.end(a)
for (i in 2:(par1+1)) {
a<-table.row.start(a)
a<-table.element(a,i-1,header=TRUE)
a<-table.element(a,round(myacf[i],6))
mytstat <- myacf[i]*sqrtn
a<-table.element(a,round(mytstat,4))
a<-table.element(a,round(1-pt(abs(mytstat),lengthx),6))
a<-table.row.end(a)
}
a<-table.end(a)
table.save(a,file='mytable.tab')
a<-table.start()
a<-table.row.start(a)
a<-table.element(a,'Partial Autocorrelation Function',4,TRUE)
a<-table.row.end(a)
a<-table.row.start(a)
a<-table.element(a,'Time lag k',header=TRUE)
a<-table.element(a,hyperlink('basics.htm','PACF(k)','click here for more information about the Partial Autocorrelation Function'),header=TRUE)
a<-table.element(a,'T-STAT',header=TRUE)
a<-table.element(a,'P-value',header=TRUE)
a<-table.row.end(a)
for (i in 1:par1) {
a<-table.row.start(a)
a<-table.element(a,i,header=TRUE)
a<-table.element(a,round(mypacf[i],6))
mytstat <- mypacf[i]*sqrtn
a<-table.element(a,round(mytstat,4))
a<-table.element(a,round(1-pt(abs(mytstat),lengthx),6))
a<-table.row.end(a)
}
a<-table.end(a)
table.save(a,file='mytable1.tab')