Free Statistics

of Irreproducible Research!

Author's title

Author*The author of this computation has been verified*
R Software Modulerwasp_smp.wasp
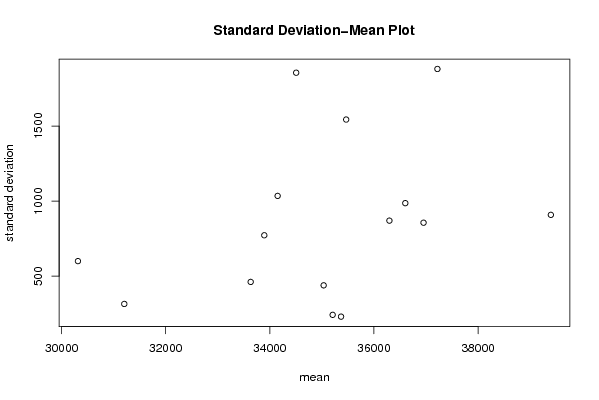
Title produced by softwareStandard Deviation-Mean Plot
Date of computationFri, 27 Nov 2009 04:52:18 -0700
Cite this page as followsStatistical Computations at FreeStatistics.org, Office for Research Development and Education, URL https://freestatistics.org/blog/index.php?v=date/2009/Nov/27/t1259322814rlx1ru5lc9wr68y.htm/, Retrieved Sun, 28 Apr 2024 21:17:54 +0000
Statistical Computations at FreeStatistics.org, Office for Research Development and Education, URL https://freestatistics.org/blog/index.php?pk=60597, Retrieved Sun, 28 Apr 2024 21:17:54 +0000
QR Codes:

Original text written by user:
IsPrivate?No (this computation is public)
User-defined keywords
Estimated Impact111
Family? (F = Feedback message, R = changed R code, M = changed R Module, P = changed Parameters, D = changed Data)
-       [Standard Deviation-Mean Plot] [ws8 part4 module1] [2009-11-27 11:52:18] [b243db81ea3e1f02fb3382887fb0f701] [Current]
Feedback Forum

Post a new message
Dataseries X:
29571
30167
30524
30996
31033
31198
30937
31649
33115
34106
33926
33382
32851
32948
36112
36113
35210
35193
34383
35349
37058
38076
36630
36045
35638
35114
35465
35254
35299
35916
36683
37288
38536
38977
36407
34955
34951
32680
34791
34178
35213
34871
35299
35443
37108
36419
34471
33868
34385
33643
34627
32919
35500
36110
37086
37711
40427
39884
38512
38767


Summary of computational transaction
Raw Inputview raw input (R code)
Raw Outputview raw output of R engine
Computing time0 seconds
R Server'Gwilym Jenkins' @ 72.249.127.135

\begin{tabular}{lllllllll}
\hline
Summary of computational transaction \tabularnewline
Raw Input & view raw input (R code)  \tabularnewline
Raw Output & view raw output of R engine  \tabularnewline
Computing time & 0 seconds \tabularnewline
R Server & 'Gwilym Jenkins' @ 72.249.127.135 \tabularnewline
\hline
\end{tabular}
%Source: https://freestatistics.org/blog/index.php?pk=60597&T=0

[TABLE]
[ROW][C]Summary of computational transaction[/C][/ROW]
[ROW][C]Raw Input[/C][C]view raw input (R code) [/C][/ROW]
[ROW][C]Raw Output[/C][C]view raw output of R engine [/C][/ROW]
[ROW][C]Computing time[/C][C]0 seconds[/C][/ROW]
[ROW][C]R Server[/C][C]'Gwilym Jenkins' @ 72.249.127.135[/C][/ROW]
[/TABLE]
Source: https://freestatistics.org/blog/index.php?pk=60597&T=0

Globally Unique Identifier (entire table): ba.freestatistics.org/blog/index.php?pk=60597&T=0

As an alternative you can also use a QR Code:  

The GUIDs for individual cells are displayed in the table below:

Summary of computational transaction
Raw Inputview raw input (R code)
Raw Outputview raw output of R engine
Computing time0 seconds
R Server'Gwilym Jenkins' @ 72.249.127.135


Standard Deviation-Mean Plot
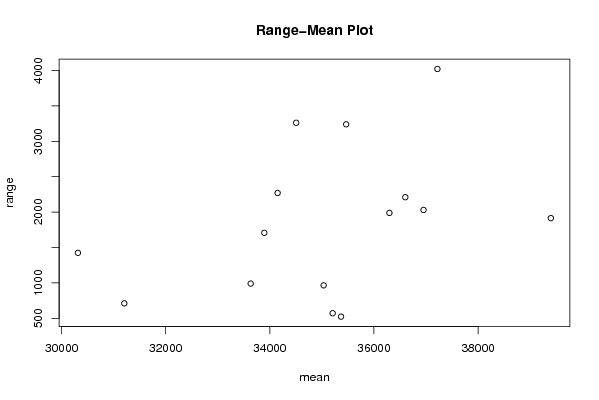
SectionMeanStandard DeviationRange
130314.5600.7997447846771425
231204.25315.484151741415712
333632.25462.205131227828991
4345061855.449092088853262
535033.75439.424908260786966
636952.25856.5326905611952031
735367.75230.810708879231524
836296.5870.295160659111989
937218.751880.610960122624022
10341501035.079063002762271
1135206.5242.961588184909572
1235466.51543.588999701673240
1333893.5772.8723482352481708
1436601.75986.6787302190452211
1539397.5908.8808136017251915

\begin{tabular}{lllllllll}
\hline
Standard Deviation-Mean Plot \tabularnewline
Section & Mean & Standard Deviation & Range \tabularnewline
1 & 30314.5 & 600.799744784677 & 1425 \tabularnewline
2 & 31204.25 & 315.484151741415 & 712 \tabularnewline
3 & 33632.25 & 462.205131227828 & 991 \tabularnewline
4 & 34506 & 1855.44909208885 & 3262 \tabularnewline
5 & 35033.75 & 439.424908260786 & 966 \tabularnewline
6 & 36952.25 & 856.532690561195 & 2031 \tabularnewline
7 & 35367.75 & 230.810708879231 & 524 \tabularnewline
8 & 36296.5 & 870.29516065911 & 1989 \tabularnewline
9 & 37218.75 & 1880.61096012262 & 4022 \tabularnewline
10 & 34150 & 1035.07906300276 & 2271 \tabularnewline
11 & 35206.5 & 242.961588184909 & 572 \tabularnewline
12 & 35466.5 & 1543.58899970167 & 3240 \tabularnewline
13 & 33893.5 & 772.872348235248 & 1708 \tabularnewline
14 & 36601.75 & 986.678730219045 & 2211 \tabularnewline
15 & 39397.5 & 908.880813601725 & 1915 \tabularnewline
\hline
\end{tabular}
%Source: https://freestatistics.org/blog/index.php?pk=60597&T=1

[TABLE]
[ROW][C]Standard Deviation-Mean Plot[/C][/ROW]
[ROW][C]Section[/C][C]Mean[/C][C]Standard Deviation[/C][C]Range[/C][/ROW]
[ROW][C]1[/C][C]30314.5[/C][C]600.799744784677[/C][C]1425[/C][/ROW]
[ROW][C]2[/C][C]31204.25[/C][C]315.484151741415[/C][C]712[/C][/ROW]
[ROW][C]3[/C][C]33632.25[/C][C]462.205131227828[/C][C]991[/C][/ROW]
[ROW][C]4[/C][C]34506[/C][C]1855.44909208885[/C][C]3262[/C][/ROW]
[ROW][C]5[/C][C]35033.75[/C][C]439.424908260786[/C][C]966[/C][/ROW]
[ROW][C]6[/C][C]36952.25[/C][C]856.532690561195[/C][C]2031[/C][/ROW]
[ROW][C]7[/C][C]35367.75[/C][C]230.810708879231[/C][C]524[/C][/ROW]
[ROW][C]8[/C][C]36296.5[/C][C]870.29516065911[/C][C]1989[/C][/ROW]
[ROW][C]9[/C][C]37218.75[/C][C]1880.61096012262[/C][C]4022[/C][/ROW]
[ROW][C]10[/C][C]34150[/C][C]1035.07906300276[/C][C]2271[/C][/ROW]
[ROW][C]11[/C][C]35206.5[/C][C]242.961588184909[/C][C]572[/C][/ROW]
[ROW][C]12[/C][C]35466.5[/C][C]1543.58899970167[/C][C]3240[/C][/ROW]
[ROW][C]13[/C][C]33893.5[/C][C]772.872348235248[/C][C]1708[/C][/ROW]
[ROW][C]14[/C][C]36601.75[/C][C]986.678730219045[/C][C]2211[/C][/ROW]
[ROW][C]15[/C][C]39397.5[/C][C]908.880813601725[/C][C]1915[/C][/ROW]
[/TABLE]
Source: https://freestatistics.org/blog/index.php?pk=60597&T=1

Globally Unique Identifier (entire table): ba.freestatistics.org/blog/index.php?pk=60597&T=1

As an alternative you can also use a QR Code:  

The GUIDs for individual cells are displayed in the table below:

Standard Deviation-Mean Plot
SectionMeanStandard DeviationRange
130314.5600.7997447846771425
231204.25315.484151741415712
333632.25462.205131227828991
4345061855.449092088853262
535033.75439.424908260786966
636952.25856.5326905611952031
735367.75230.810708879231524
836296.5870.295160659111989
937218.751880.610960122624022
10341501035.079063002762271
1135206.5242.961588184909572
1235466.51543.588999701673240
1333893.5772.8723482352481708
1436601.75986.6787302190452211
1539397.5908.8808136017251915


Regression: S.E.(k) = alpha + beta * Mean(k)
alpha-1964.9895266217
beta0.0808704125111848
S.D.0.0611321641118384
T-STAT1.32287828651438
p-value0.208674547310580

\begin{tabular}{lllllllll}
\hline
Regression: S.E.(k) = alpha + beta * Mean(k) \tabularnewline
alpha & -1964.9895266217 \tabularnewline
beta & 0.0808704125111848 \tabularnewline
S.D. & 0.0611321641118384 \tabularnewline
T-STAT & 1.32287828651438 \tabularnewline
p-value & 0.208674547310580 \tabularnewline
\hline
\end{tabular}
%Source: https://freestatistics.org/blog/index.php?pk=60597&T=2

[TABLE]
[ROW][C]Regression: S.E.(k) = alpha + beta * Mean(k)[/C][/ROW]
[ROW][C]alpha[/C][C]-1964.9895266217[/C][/ROW]
[ROW][C]beta[/C][C]0.0808704125111848[/C][/ROW]
[ROW][C]S.D.[/C][C]0.0611321641118384[/C][/ROW]
[ROW][C]T-STAT[/C][C]1.32287828651438[/C][/ROW]
[ROW][C]p-value[/C][C]0.208674547310580[/C][/ROW]
[/TABLE]
Source: https://freestatistics.org/blog/index.php?pk=60597&T=2

Globally Unique Identifier (entire table): ba.freestatistics.org/blog/index.php?pk=60597&T=2

As an alternative you can also use a QR Code:  

The GUIDs for individual cells are displayed in the table below:

Regression: S.E.(k) = alpha + beta * Mean(k)
alpha-1964.9895266217
beta0.0808704125111848
S.D.0.0611321641118384
T-STAT1.32287828651438
p-value0.208674547310580


Regression: ln S.E.(k) = alpha + beta * ln Mean(k)
alpha-31.1069024479758
beta3.60138154961574
S.D.2.64054628141241
T-STAT1.36387745784535
p-value0.195756038304237
Lambda-2.60138154961574

\begin{tabular}{lllllllll}
\hline
Regression: ln S.E.(k) = alpha + beta * ln Mean(k) \tabularnewline
alpha & -31.1069024479758 \tabularnewline
beta & 3.60138154961574 \tabularnewline
S.D. & 2.64054628141241 \tabularnewline
T-STAT & 1.36387745784535 \tabularnewline
p-value & 0.195756038304237 \tabularnewline
Lambda & -2.60138154961574 \tabularnewline
\hline
\end{tabular}
%Source: https://freestatistics.org/blog/index.php?pk=60597&T=3

[TABLE]
[ROW][C]Regression: ln S.E.(k) = alpha + beta * ln Mean(k)[/C][/ROW]
[ROW][C]alpha[/C][C]-31.1069024479758[/C][/ROW]
[ROW][C]beta[/C][C]3.60138154961574[/C][/ROW]
[ROW][C]S.D.[/C][C]2.64054628141241[/C][/ROW]
[ROW][C]T-STAT[/C][C]1.36387745784535[/C][/ROW]
[ROW][C]p-value[/C][C]0.195756038304237[/C][/ROW]
[ROW][C]Lambda[/C][C]-2.60138154961574[/C][/ROW]
[/TABLE]
Source: https://freestatistics.org/blog/index.php?pk=60597&T=3

Globally Unique Identifier (entire table): ba.freestatistics.org/blog/index.php?pk=60597&T=3

As an alternative you can also use a QR Code:  

The GUIDs for individual cells are displayed in the table below:

Regression: ln S.E.(k) = alpha + beta * ln Mean(k)
alpha-31.1069024479758
beta3.60138154961574
S.D.2.64054628141241
T-STAT1.36387745784535
p-value0.195756038304237
Lambda-2.60138154961574


Parameters (Session):
par1 = 4 ;
Parameters (R input):
par1 = 4 ;
R code (references can be found in the software module):
par1 <- as.numeric(par1)
(n <- length(x))
(np <- floor(n / par1))
arr <- array(NA,dim=c(par1,np))
j <- 0
k <- 1
for (i in 1:(np*par1))
{
j = j + 1
arr[j,k] <- x[i]
if (j == par1) {
j = 0
k=k+1
}
}
arr
arr.mean <- array(NA,dim=np)
arr.sd <- array(NA,dim=np)
arr.range <- array(NA,dim=np)
for (j in 1:np)
{
arr.mean[j] <- mean(arr[,j],na.rm=TRUE)
arr.sd[j] <- sd(arr[,j],na.rm=TRUE)
arr.range[j] <- max(arr[,j],na.rm=TRUE) - min(arr[,j],na.rm=TRUE)
}
arr.mean
arr.sd
arr.range
(lm1 <- lm(arr.sd~arr.mean))
(lnlm1 <- lm(log(arr.sd)~log(arr.mean)))
(lm2 <- lm(arr.range~arr.mean))
bitmap(file='test1.png')
plot(arr.mean,arr.sd,main='Standard Deviation-Mean Plot',xlab='mean',ylab='standard deviation')
dev.off()
bitmap(file='test2.png')
plot(arr.mean,arr.range,main='Range-Mean Plot',xlab='mean',ylab='range')
dev.off()
load(file='createtable')
a<-table.start()
a<-table.row.start(a)
a<-table.element(a,'Standard Deviation-Mean Plot',4,TRUE)
a<-table.row.end(a)
a<-table.row.start(a)
a<-table.element(a,'Section',header=TRUE)
a<-table.element(a,'Mean',header=TRUE)
a<-table.element(a,'Standard Deviation',header=TRUE)
a<-table.element(a,'Range',header=TRUE)
a<-table.row.end(a)
for (j in 1:np) {
a<-table.row.start(a)
a<-table.element(a,j,header=TRUE)
a<-table.element(a,arr.mean[j])
a<-table.element(a,arr.sd[j] )
a<-table.element(a,arr.range[j] )
a<-table.row.end(a)
}
a<-table.end(a)
table.save(a,file='mytable.tab')
a<-table.start()
a<-table.row.start(a)
a<-table.element(a,'Regression: S.E.(k) = alpha + beta * Mean(k)',2,TRUE)
a<-table.row.end(a)
a<-table.row.start(a)
a<-table.element(a,'alpha',header=TRUE)
a<-table.element(a,lm1$coefficients[[1]])
a<-table.row.end(a)
a<-table.row.start(a)
a<-table.element(a,'beta',header=TRUE)
a<-table.element(a,lm1$coefficients[[2]])
a<-table.row.end(a)
a<-table.row.start(a)
a<-table.element(a,'S.D.',header=TRUE)
a<-table.element(a,summary(lm1)$coefficients[2,2])
a<-table.row.end(a)
a<-table.row.start(a)
a<-table.element(a,'T-STAT',header=TRUE)
a<-table.element(a,summary(lm1)$coefficients[2,3])
a<-table.row.end(a)
a<-table.row.start(a)
a<-table.element(a,'p-value',header=TRUE)
a<-table.element(a,summary(lm1)$coefficients[2,4])
a<-table.row.end(a)
a<-table.end(a)
table.save(a,file='mytable1.tab')
a<-table.start()
a<-table.row.start(a)
a<-table.element(a,'Regression: ln S.E.(k) = alpha + beta * ln Mean(k)',2,TRUE)
a<-table.row.end(a)
a<-table.row.start(a)
a<-table.element(a,'alpha',header=TRUE)
a<-table.element(a,lnlm1$coefficients[[1]])
a<-table.row.end(a)
a<-table.row.start(a)
a<-table.element(a,'beta',header=TRUE)
a<-table.element(a,lnlm1$coefficients[[2]])
a<-table.row.end(a)
a<-table.row.start(a)
a<-table.element(a,'S.D.',header=TRUE)
a<-table.element(a,summary(lnlm1)$coefficients[2,2])
a<-table.row.end(a)
a<-table.row.start(a)
a<-table.element(a,'T-STAT',header=TRUE)
a<-table.element(a,summary(lnlm1)$coefficients[2,3])
a<-table.row.end(a)
a<-table.row.start(a)
a<-table.element(a,'p-value',header=TRUE)
a<-table.element(a,summary(lnlm1)$coefficients[2,4])
a<-table.row.end(a)
a<-table.row.start(a)
a<-table.element(a,'Lambda',header=TRUE)
a<-table.element(a,1-lnlm1$coefficients[[2]])
a<-table.row.end(a)
a<-table.end(a)
table.save(a,file='mytable2.tab')