Free Statistics

of Irreproducible Research!

Author's title

Author*The author of this computation has been verified*
R Software Modulerwasp_smp.wasp
Title produced by softwareStandard Deviation-Mean Plot
Date of computationFri, 27 Nov 2009 07:01:45 -0700
Cite this page as followsStatistical Computations at FreeStatistics.org, Office for Research Development and Education, URL https://freestatistics.org/blog/index.php?v=date/2009/Nov/27/t1259330538k5v6453y3cn3nlz.htm/, Retrieved Sun, 28 Apr 2024 20:31:54 +0000
Statistical Computations at FreeStatistics.org, Office for Research Development and Education, URL https://freestatistics.org/blog/index.php?pk=60788, Retrieved Sun, 28 Apr 2024 20:31:54 +0000
QR Codes:

Original text written by user:
IsPrivate?No (this computation is public)
User-defined keywordsshwws8
Estimated Impact156
Family? (F = Feedback message, R = changed R code, M = changed R Module, P = changed Parameters, D = changed Data)
-     [Multiple Regression] [Q1 The Seatbeltlaw] [2007-11-14 19:27:43] [8cd6641b921d30ebe00b648d1481bba0]
- RMPD  [Multiple Regression] [Seatbelt] [2009-11-12 13:54:52] [b98453cac15ba1066b407e146608df68]
-    D    [Multiple Regression] [] [2009-11-20 13:47:03] [5482608004c1d7bbf873930172393a2d]
- RMPD      [Variance Reduction Matrix] [] [2009-11-27 13:45:38] [5482608004c1d7bbf873930172393a2d]
- RMP           [Standard Deviation-Mean Plot] [] [2009-11-27 14:01:45] [efdfe680cd785c4af09f858b30f777ec] [Current]
- RMPD            [ARIMA Backward Selection] [] [2009-12-02 15:22:59] [5482608004c1d7bbf873930172393a2d]
- RMPD            [Harrell-Davis Quantiles] [] [2009-12-02 15:38:18] [5482608004c1d7bbf873930172393a2d]
Feedback Forum

Post a new message
Dataseries X:
6539
6699
6962
6981
7024
6940
6774
6671
6965
6969
6822
6878
6691
6837
7018
7167
7076
7171
7093
6971
7142
7047
6999
6650
6475
6437
6639
6422
6272
6232
6003
5673
6050
5977
5796
5752
5609
5839
6069
6006
5809
5797
5502
5568
5864
5764
5615
5615
5681
5915
6334
6494
6620
6578
6495
6538
6737
6651
6530
6563


Summary of computational transaction
Raw Inputview raw input (R code)
Raw Outputview raw output of R engine
Computing time1 seconds
R Server'Gwilym Jenkins' @ 72.249.127.135

\begin{tabular}{lllllllll}
\hline
Summary of computational transaction \tabularnewline
Raw Input & view raw input (R code)  \tabularnewline
Raw Output & view raw output of R engine  \tabularnewline
Computing time & 1 seconds \tabularnewline
R Server & 'Gwilym Jenkins' @ 72.249.127.135 \tabularnewline
\hline
\end{tabular}
%Source: https://freestatistics.org/blog/index.php?pk=60788&T=0

[TABLE]
[ROW][C]Summary of computational transaction[/C][/ROW]
[ROW][C]Raw Input[/C][C]view raw input (R code) [/C][/ROW]
[ROW][C]Raw Output[/C][C]view raw output of R engine [/C][/ROW]
[ROW][C]Computing time[/C][C]1 seconds[/C][/ROW]
[ROW][C]R Server[/C][C]'Gwilym Jenkins' @ 72.249.127.135[/C][/ROW]
[/TABLE]
Source: https://freestatistics.org/blog/index.php?pk=60788&T=0

Globally Unique Identifier (entire table): ba.freestatistics.org/blog/index.php?pk=60788&T=0

As an alternative you can also use a QR Code:  

The GUIDs for individual cells are displayed in the table below:

Summary of computational transaction
Raw Inputview raw input (R code)
Raw Outputview raw output of R engine
Computing time1 seconds
R Server'Gwilym Jenkins' @ 72.249.127.135


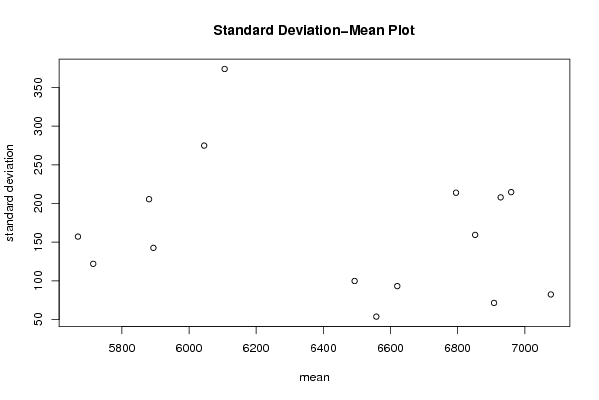
Standard Deviation-Mean Plot
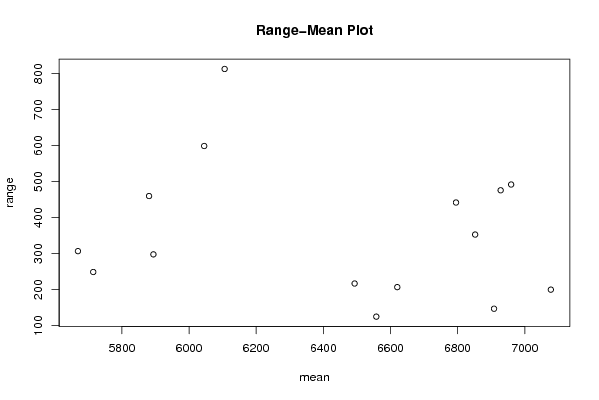
SectionMeanStandard DeviationRange
16795.25213.882171611692442
26852.25159.345275005777353
36908.571.3325545128824147
46928.25207.902821850338476
57077.7582.3139315871459200
66959.5214.719196471422492
76493.2599.6941155067172217
86045274.861177081571599
95893.75142.586523439863298
105880.75205.521085698443460
115669157.134761696237307
125714.5121.930307963197249
136106374.002673787234813
146557.7553.5809356643449125
156620.2593.0926957392469207

\begin{tabular}{lllllllll}
\hline
Standard Deviation-Mean Plot \tabularnewline
Section & Mean & Standard Deviation & Range \tabularnewline
1 & 6795.25 & 213.882171611692 & 442 \tabularnewline
2 & 6852.25 & 159.345275005777 & 353 \tabularnewline
3 & 6908.5 & 71.3325545128824 & 147 \tabularnewline
4 & 6928.25 & 207.902821850338 & 476 \tabularnewline
5 & 7077.75 & 82.3139315871459 & 200 \tabularnewline
6 & 6959.5 & 214.719196471422 & 492 \tabularnewline
7 & 6493.25 & 99.6941155067172 & 217 \tabularnewline
8 & 6045 & 274.861177081571 & 599 \tabularnewline
9 & 5893.75 & 142.586523439863 & 298 \tabularnewline
10 & 5880.75 & 205.521085698443 & 460 \tabularnewline
11 & 5669 & 157.134761696237 & 307 \tabularnewline
12 & 5714.5 & 121.930307963197 & 249 \tabularnewline
13 & 6106 & 374.002673787234 & 813 \tabularnewline
14 & 6557.75 & 53.5809356643449 & 125 \tabularnewline
15 & 6620.25 & 93.0926957392469 & 207 \tabularnewline
\hline
\end{tabular}
%Source: https://freestatistics.org/blog/index.php?pk=60788&T=1

[TABLE]
[ROW][C]Standard Deviation-Mean Plot[/C][/ROW]
[ROW][C]Section[/C][C]Mean[/C][C]Standard Deviation[/C][C]Range[/C][/ROW]
[ROW][C]1[/C][C]6795.25[/C][C]213.882171611692[/C][C]442[/C][/ROW]
[ROW][C]2[/C][C]6852.25[/C][C]159.345275005777[/C][C]353[/C][/ROW]
[ROW][C]3[/C][C]6908.5[/C][C]71.3325545128824[/C][C]147[/C][/ROW]
[ROW][C]4[/C][C]6928.25[/C][C]207.902821850338[/C][C]476[/C][/ROW]
[ROW][C]5[/C][C]7077.75[/C][C]82.3139315871459[/C][C]200[/C][/ROW]
[ROW][C]6[/C][C]6959.5[/C][C]214.719196471422[/C][C]492[/C][/ROW]
[ROW][C]7[/C][C]6493.25[/C][C]99.6941155067172[/C][C]217[/C][/ROW]
[ROW][C]8[/C][C]6045[/C][C]274.861177081571[/C][C]599[/C][/ROW]
[ROW][C]9[/C][C]5893.75[/C][C]142.586523439863[/C][C]298[/C][/ROW]
[ROW][C]10[/C][C]5880.75[/C][C]205.521085698443[/C][C]460[/C][/ROW]
[ROW][C]11[/C][C]5669[/C][C]157.134761696237[/C][C]307[/C][/ROW]
[ROW][C]12[/C][C]5714.5[/C][C]121.930307963197[/C][C]249[/C][/ROW]
[ROW][C]13[/C][C]6106[/C][C]374.002673787234[/C][C]813[/C][/ROW]
[ROW][C]14[/C][C]6557.75[/C][C]53.5809356643449[/C][C]125[/C][/ROW]
[ROW][C]15[/C][C]6620.25[/C][C]93.0926957392469[/C][C]207[/C][/ROW]
[/TABLE]
Source: https://freestatistics.org/blog/index.php?pk=60788&T=1

Globally Unique Identifier (entire table): ba.freestatistics.org/blog/index.php?pk=60788&T=1

As an alternative you can also use a QR Code:  

The GUIDs for individual cells are displayed in the table below:

Standard Deviation-Mean Plot
SectionMeanStandard DeviationRange
16795.25213.882171611692442
26852.25159.345275005777353
36908.571.3325545128824147
46928.25207.902821850338476
57077.7582.3139315871459200
66959.5214.719196471422492
76493.2599.6941155067172217
86045274.861177081571599
95893.75142.586523439863298
105880.75205.521085698443460
115669157.134761696237307
125714.5121.930307963197249
136106374.002673787234813
146557.7553.5809356643449125
156620.2593.0926957392469207


Regression: S.E.(k) = alpha + beta * Mean(k)
alpha443.482384220513
beta-0.0433187536567119
S.D.0.0464273850185388
T-STAT-0.933043151997777
p-value0.367804199287731

\begin{tabular}{lllllllll}
\hline
Regression: S.E.(k) = alpha + beta * Mean(k) \tabularnewline
alpha & 443.482384220513 \tabularnewline
beta & -0.0433187536567119 \tabularnewline
S.D. & 0.0464273850185388 \tabularnewline
T-STAT & -0.933043151997777 \tabularnewline
p-value & 0.367804199287731 \tabularnewline
\hline
\end{tabular}
%Source: https://freestatistics.org/blog/index.php?pk=60788&T=2

[TABLE]
[ROW][C]Regression: S.E.(k) = alpha + beta * Mean(k)[/C][/ROW]
[ROW][C]alpha[/C][C]443.482384220513[/C][/ROW]
[ROW][C]beta[/C][C]-0.0433187536567119[/C][/ROW]
[ROW][C]S.D.[/C][C]0.0464273850185388[/C][/ROW]
[ROW][C]T-STAT[/C][C]-0.933043151997777[/C][/ROW]
[ROW][C]p-value[/C][C]0.367804199287731[/C][/ROW]
[/TABLE]
Source: https://freestatistics.org/blog/index.php?pk=60788&T=2

Globally Unique Identifier (entire table): ba.freestatistics.org/blog/index.php?pk=60788&T=2

As an alternative you can also use a QR Code:  

The GUIDs for individual cells are displayed in the table below:

Regression: S.E.(k) = alpha + beta * Mean(k)
alpha443.482384220513
beta-0.0433187536567119
S.D.0.0464273850185388
T-STAT-0.933043151997777
p-value0.367804199287731


Regression: ln S.E.(k) = alpha + beta * ln Mean(k)
alpha21.6107510308502
beta-1.89767461966863
S.D.1.8274461492896
T-STAT-1.03842984396905
p-value0.317999693041803
Lambda2.89767461966863

\begin{tabular}{lllllllll}
\hline
Regression: ln S.E.(k) = alpha + beta * ln Mean(k) \tabularnewline
alpha & 21.6107510308502 \tabularnewline
beta & -1.89767461966863 \tabularnewline
S.D. & 1.8274461492896 \tabularnewline
T-STAT & -1.03842984396905 \tabularnewline
p-value & 0.317999693041803 \tabularnewline
Lambda & 2.89767461966863 \tabularnewline
\hline
\end{tabular}
%Source: https://freestatistics.org/blog/index.php?pk=60788&T=3

[TABLE]
[ROW][C]Regression: ln S.E.(k) = alpha + beta * ln Mean(k)[/C][/ROW]
[ROW][C]alpha[/C][C]21.6107510308502[/C][/ROW]
[ROW][C]beta[/C][C]-1.89767461966863[/C][/ROW]
[ROW][C]S.D.[/C][C]1.8274461492896[/C][/ROW]
[ROW][C]T-STAT[/C][C]-1.03842984396905[/C][/ROW]
[ROW][C]p-value[/C][C]0.317999693041803[/C][/ROW]
[ROW][C]Lambda[/C][C]2.89767461966863[/C][/ROW]
[/TABLE]
Source: https://freestatistics.org/blog/index.php?pk=60788&T=3

Globally Unique Identifier (entire table): ba.freestatistics.org/blog/index.php?pk=60788&T=3

As an alternative you can also use a QR Code:  

The GUIDs for individual cells are displayed in the table below:

Regression: ln S.E.(k) = alpha + beta * ln Mean(k)
alpha21.6107510308502
beta-1.89767461966863
S.D.1.8274461492896
T-STAT-1.03842984396905
p-value0.317999693041803
Lambda2.89767461966863


Parameters (Session):
par1 = 4 ;
Parameters (R input):
par1 = 4 ;
R code (references can be found in the software module):
par1 <- as.numeric(par1)
(n <- length(x))
(np <- floor(n / par1))
arr <- array(NA,dim=c(par1,np))
j <- 0
k <- 1
for (i in 1:(np*par1))
{
j = j + 1
arr[j,k] <- x[i]
if (j == par1) {
j = 0
k=k+1
}
}
arr
arr.mean <- array(NA,dim=np)
arr.sd <- array(NA,dim=np)
arr.range <- array(NA,dim=np)
for (j in 1:np)
{
arr.mean[j] <- mean(arr[,j],na.rm=TRUE)
arr.sd[j] <- sd(arr[,j],na.rm=TRUE)
arr.range[j] <- max(arr[,j],na.rm=TRUE) - min(arr[,j],na.rm=TRUE)
}
arr.mean
arr.sd
arr.range
(lm1 <- lm(arr.sd~arr.mean))
(lnlm1 <- lm(log(arr.sd)~log(arr.mean)))
(lm2 <- lm(arr.range~arr.mean))
bitmap(file='test1.png')
plot(arr.mean,arr.sd,main='Standard Deviation-Mean Plot',xlab='mean',ylab='standard deviation')
dev.off()
bitmap(file='test2.png')
plot(arr.mean,arr.range,main='Range-Mean Plot',xlab='mean',ylab='range')
dev.off()
load(file='createtable')
a<-table.start()
a<-table.row.start(a)
a<-table.element(a,'Standard Deviation-Mean Plot',4,TRUE)
a<-table.row.end(a)
a<-table.row.start(a)
a<-table.element(a,'Section',header=TRUE)
a<-table.element(a,'Mean',header=TRUE)
a<-table.element(a,'Standard Deviation',header=TRUE)
a<-table.element(a,'Range',header=TRUE)
a<-table.row.end(a)
for (j in 1:np) {
a<-table.row.start(a)
a<-table.element(a,j,header=TRUE)
a<-table.element(a,arr.mean[j])
a<-table.element(a,arr.sd[j] )
a<-table.element(a,arr.range[j] )
a<-table.row.end(a)
}
a<-table.end(a)
table.save(a,file='mytable.tab')
a<-table.start()
a<-table.row.start(a)
a<-table.element(a,'Regression: S.E.(k) = alpha + beta * Mean(k)',2,TRUE)
a<-table.row.end(a)
a<-table.row.start(a)
a<-table.element(a,'alpha',header=TRUE)
a<-table.element(a,lm1$coefficients[[1]])
a<-table.row.end(a)
a<-table.row.start(a)
a<-table.element(a,'beta',header=TRUE)
a<-table.element(a,lm1$coefficients[[2]])
a<-table.row.end(a)
a<-table.row.start(a)
a<-table.element(a,'S.D.',header=TRUE)
a<-table.element(a,summary(lm1)$coefficients[2,2])
a<-table.row.end(a)
a<-table.row.start(a)
a<-table.element(a,'T-STAT',header=TRUE)
a<-table.element(a,summary(lm1)$coefficients[2,3])
a<-table.row.end(a)
a<-table.row.start(a)
a<-table.element(a,'p-value',header=TRUE)
a<-table.element(a,summary(lm1)$coefficients[2,4])
a<-table.row.end(a)
a<-table.end(a)
table.save(a,file='mytable1.tab')
a<-table.start()
a<-table.row.start(a)
a<-table.element(a,'Regression: ln S.E.(k) = alpha + beta * ln Mean(k)',2,TRUE)
a<-table.row.end(a)
a<-table.row.start(a)
a<-table.element(a,'alpha',header=TRUE)
a<-table.element(a,lnlm1$coefficients[[1]])
a<-table.row.end(a)
a<-table.row.start(a)
a<-table.element(a,'beta',header=TRUE)
a<-table.element(a,lnlm1$coefficients[[2]])
a<-table.row.end(a)
a<-table.row.start(a)
a<-table.element(a,'S.D.',header=TRUE)
a<-table.element(a,summary(lnlm1)$coefficients[2,2])
a<-table.row.end(a)
a<-table.row.start(a)
a<-table.element(a,'T-STAT',header=TRUE)
a<-table.element(a,summary(lnlm1)$coefficients[2,3])
a<-table.row.end(a)
a<-table.row.start(a)
a<-table.element(a,'p-value',header=TRUE)
a<-table.element(a,summary(lnlm1)$coefficients[2,4])
a<-table.row.end(a)
a<-table.row.start(a)
a<-table.element(a,'Lambda',header=TRUE)
a<-table.element(a,1-lnlm1$coefficients[[2]])
a<-table.row.end(a)
a<-table.end(a)
table.save(a,file='mytable2.tab')