Free Statistics

of Irreproducible Research!

Author's title

Author*The author of this computation has been verified*
R Software Modulerwasp_autocorrelation.wasp
Title produced by software(Partial) Autocorrelation Function
Date of computationFri, 27 Nov 2009 09:20:57 -0700
Cite this page as followsStatistical Computations at FreeStatistics.org, Office for Research Development and Education, URL https://freestatistics.org/blog/index.php?v=date/2009/Nov/27/t12593391251rgqlc7avqxk7ap.htm/, Retrieved Sun, 28 Apr 2024 22:41:16 +0000
Statistical Computations at FreeStatistics.org, Office for Research Development and Education, URL https://freestatistics.org/blog/index.php?pk=60956, Retrieved Sun, 28 Apr 2024 22:41:16 +0000
QR Codes:

Original text written by user:
IsPrivate?No (this computation is public)
User-defined keywords
Estimated Impact116
Family? (F = Feedback message, R = changed R code, M = changed R Module, P = changed Parameters, D = changed Data)
-       [(Partial) Autocorrelation Function] [] [2009-11-27 16:20:57] [477c9cb8e7bda18f2375c22a66069c90] [Current]
Feedback Forum

Post a new message
Dataseries X:
92.9
107.7
103.5
91.1
79.8
71.9
82.9
90.1
100.7
90.7
108.8
44.1
93.6
107.4
96.5
93.6
76.5
76.7
84
103.3
88.5
99
105.9
44.7
94
107.1
104.8
102.5
77.7
85.2
91.3
106.5
92.4
97.5
107
51.1
98.6
102.2
114.3
99.4
72.5
92.3
99.4
85.9
109.4
97.6
104.7
56.9
86.7
108.5
103.4
86.2
71
75.9
87.1
102
88.5
87.8
100.8
50.6
85.9


Summary of computational transaction
Raw Inputview raw input (R code)
Raw Outputview raw output of R engine
Computing time2 seconds
R Server'Gwilym Jenkins' @ 72.249.127.135

\begin{tabular}{lllllllll}
\hline
Summary of computational transaction \tabularnewline
Raw Input & view raw input (R code)  \tabularnewline
Raw Output & view raw output of R engine  \tabularnewline
Computing time & 2 seconds \tabularnewline
R Server & 'Gwilym Jenkins' @ 72.249.127.135 \tabularnewline
\hline
\end{tabular}
%Source: https://freestatistics.org/blog/index.php?pk=60956&T=0

[TABLE]
[ROW][C]Summary of computational transaction[/C][/ROW]
[ROW][C]Raw Input[/C][C]view raw input (R code) [/C][/ROW]
[ROW][C]Raw Output[/C][C]view raw output of R engine [/C][/ROW]
[ROW][C]Computing time[/C][C]2 seconds[/C][/ROW]
[ROW][C]R Server[/C][C]'Gwilym Jenkins' @ 72.249.127.135[/C][/ROW]
[/TABLE]
Source: https://freestatistics.org/blog/index.php?pk=60956&T=0

Globally Unique Identifier (entire table): ba.freestatistics.org/blog/index.php?pk=60956&T=0

As an alternative you can also use a QR Code:  

The GUIDs for individual cells are displayed in the table below:

Summary of computational transaction
Raw Inputview raw input (R code)
Raw Outputview raw output of R engine
Computing time2 seconds
R Server'Gwilym Jenkins' @ 72.249.127.135


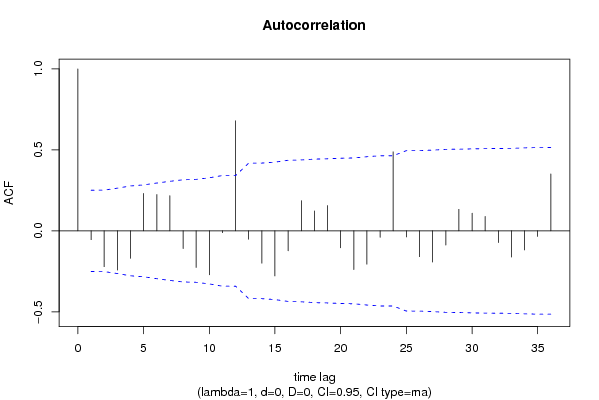
Autocorrelation Function
Time lag kACF(k)T-STATP-value
1-0.054723-0.42740.335296
2-0.221632-1.7310.044254
3-0.242414-1.89330.031531
4-0.169728-1.32560.094954
50.2309981.80420.038072
60.2243711.75240.042366
70.2174141.69810.047297
8-0.109349-0.8540.198212
9-0.225849-1.76390.041375
10-0.271821-2.1230.01891
11-0.011271-0.0880.465072
120.6798565.30981e-06
13-0.051633-0.40330.344082
14-0.199969-1.56180.061753
15-0.278212-2.17290.016841
16-0.123269-0.96280.169734
170.1865041.45660.075172
180.1233360.96330.169604
190.1563751.22130.113331
20-0.104702-0.81770.208343
21-0.238808-1.86520.033486
22-0.205734-1.60680.056627
23-0.039742-0.31040.378661
240.4879333.81090.000162
25-0.037195-0.29050.386208
26-0.159275-1.2440.109133
27-0.192795-1.50580.068642
28-0.087445-0.6830.248608
290.1331641.040.151212
300.1090370.85160.198881
310.0890440.69550.244704
32-0.071939-0.56190.288135
33-0.161985-1.26510.105315
34-0.117733-0.91950.180722
35-0.034561-0.26990.394064
360.3518712.74820.003935

\begin{tabular}{lllllllll}
\hline
Autocorrelation Function \tabularnewline
Time lag k & ACF(k) & T-STAT & P-value \tabularnewline
1 & -0.054723 & -0.4274 & 0.335296 \tabularnewline
2 & -0.221632 & -1.731 & 0.044254 \tabularnewline
3 & -0.242414 & -1.8933 & 0.031531 \tabularnewline
4 & -0.169728 & -1.3256 & 0.094954 \tabularnewline
5 & 0.230998 & 1.8042 & 0.038072 \tabularnewline
6 & 0.224371 & 1.7524 & 0.042366 \tabularnewline
7 & 0.217414 & 1.6981 & 0.047297 \tabularnewline
8 & -0.109349 & -0.854 & 0.198212 \tabularnewline
9 & -0.225849 & -1.7639 & 0.041375 \tabularnewline
10 & -0.271821 & -2.123 & 0.01891 \tabularnewline
11 & -0.011271 & -0.088 & 0.465072 \tabularnewline
12 & 0.679856 & 5.3098 & 1e-06 \tabularnewline
13 & -0.051633 & -0.4033 & 0.344082 \tabularnewline
14 & -0.199969 & -1.5618 & 0.061753 \tabularnewline
15 & -0.278212 & -2.1729 & 0.016841 \tabularnewline
16 & -0.123269 & -0.9628 & 0.169734 \tabularnewline
17 & 0.186504 & 1.4566 & 0.075172 \tabularnewline
18 & 0.123336 & 0.9633 & 0.169604 \tabularnewline
19 & 0.156375 & 1.2213 & 0.113331 \tabularnewline
20 & -0.104702 & -0.8177 & 0.208343 \tabularnewline
21 & -0.238808 & -1.8652 & 0.033486 \tabularnewline
22 & -0.205734 & -1.6068 & 0.056627 \tabularnewline
23 & -0.039742 & -0.3104 & 0.378661 \tabularnewline
24 & 0.487933 & 3.8109 & 0.000162 \tabularnewline
25 & -0.037195 & -0.2905 & 0.386208 \tabularnewline
26 & -0.159275 & -1.244 & 0.109133 \tabularnewline
27 & -0.192795 & -1.5058 & 0.068642 \tabularnewline
28 & -0.087445 & -0.683 & 0.248608 \tabularnewline
29 & 0.133164 & 1.04 & 0.151212 \tabularnewline
30 & 0.109037 & 0.8516 & 0.198881 \tabularnewline
31 & 0.089044 & 0.6955 & 0.244704 \tabularnewline
32 & -0.071939 & -0.5619 & 0.288135 \tabularnewline
33 & -0.161985 & -1.2651 & 0.105315 \tabularnewline
34 & -0.117733 & -0.9195 & 0.180722 \tabularnewline
35 & -0.034561 & -0.2699 & 0.394064 \tabularnewline
36 & 0.351871 & 2.7482 & 0.003935 \tabularnewline
\hline
\end{tabular}
%Source: https://freestatistics.org/blog/index.php?pk=60956&T=1

[TABLE]
[ROW][C]Autocorrelation Function[/C][/ROW]
[ROW][C]Time lag k[/C][C]ACF(k)[/C][C]T-STAT[/C][C]P-value[/C][/ROW]
[ROW][C]1[/C][C]-0.054723[/C][C]-0.4274[/C][C]0.335296[/C][/ROW]
[ROW][C]2[/C][C]-0.221632[/C][C]-1.731[/C][C]0.044254[/C][/ROW]
[ROW][C]3[/C][C]-0.242414[/C][C]-1.8933[/C][C]0.031531[/C][/ROW]
[ROW][C]4[/C][C]-0.169728[/C][C]-1.3256[/C][C]0.094954[/C][/ROW]
[ROW][C]5[/C][C]0.230998[/C][C]1.8042[/C][C]0.038072[/C][/ROW]
[ROW][C]6[/C][C]0.224371[/C][C]1.7524[/C][C]0.042366[/C][/ROW]
[ROW][C]7[/C][C]0.217414[/C][C]1.6981[/C][C]0.047297[/C][/ROW]
[ROW][C]8[/C][C]-0.109349[/C][C]-0.854[/C][C]0.198212[/C][/ROW]
[ROW][C]9[/C][C]-0.225849[/C][C]-1.7639[/C][C]0.041375[/C][/ROW]
[ROW][C]10[/C][C]-0.271821[/C][C]-2.123[/C][C]0.01891[/C][/ROW]
[ROW][C]11[/C][C]-0.011271[/C][C]-0.088[/C][C]0.465072[/C][/ROW]
[ROW][C]12[/C][C]0.679856[/C][C]5.3098[/C][C]1e-06[/C][/ROW]
[ROW][C]13[/C][C]-0.051633[/C][C]-0.4033[/C][C]0.344082[/C][/ROW]
[ROW][C]14[/C][C]-0.199969[/C][C]-1.5618[/C][C]0.061753[/C][/ROW]
[ROW][C]15[/C][C]-0.278212[/C][C]-2.1729[/C][C]0.016841[/C][/ROW]
[ROW][C]16[/C][C]-0.123269[/C][C]-0.9628[/C][C]0.169734[/C][/ROW]
[ROW][C]17[/C][C]0.186504[/C][C]1.4566[/C][C]0.075172[/C][/ROW]
[ROW][C]18[/C][C]0.123336[/C][C]0.9633[/C][C]0.169604[/C][/ROW]
[ROW][C]19[/C][C]0.156375[/C][C]1.2213[/C][C]0.113331[/C][/ROW]
[ROW][C]20[/C][C]-0.104702[/C][C]-0.8177[/C][C]0.208343[/C][/ROW]
[ROW][C]21[/C][C]-0.238808[/C][C]-1.8652[/C][C]0.033486[/C][/ROW]
[ROW][C]22[/C][C]-0.205734[/C][C]-1.6068[/C][C]0.056627[/C][/ROW]
[ROW][C]23[/C][C]-0.039742[/C][C]-0.3104[/C][C]0.378661[/C][/ROW]
[ROW][C]24[/C][C]0.487933[/C][C]3.8109[/C][C]0.000162[/C][/ROW]
[ROW][C]25[/C][C]-0.037195[/C][C]-0.2905[/C][C]0.386208[/C][/ROW]
[ROW][C]26[/C][C]-0.159275[/C][C]-1.244[/C][C]0.109133[/C][/ROW]
[ROW][C]27[/C][C]-0.192795[/C][C]-1.5058[/C][C]0.068642[/C][/ROW]
[ROW][C]28[/C][C]-0.087445[/C][C]-0.683[/C][C]0.248608[/C][/ROW]
[ROW][C]29[/C][C]0.133164[/C][C]1.04[/C][C]0.151212[/C][/ROW]
[ROW][C]30[/C][C]0.109037[/C][C]0.8516[/C][C]0.198881[/C][/ROW]
[ROW][C]31[/C][C]0.089044[/C][C]0.6955[/C][C]0.244704[/C][/ROW]
[ROW][C]32[/C][C]-0.071939[/C][C]-0.5619[/C][C]0.288135[/C][/ROW]
[ROW][C]33[/C][C]-0.161985[/C][C]-1.2651[/C][C]0.105315[/C][/ROW]
[ROW][C]34[/C][C]-0.117733[/C][C]-0.9195[/C][C]0.180722[/C][/ROW]
[ROW][C]35[/C][C]-0.034561[/C][C]-0.2699[/C][C]0.394064[/C][/ROW]
[ROW][C]36[/C][C]0.351871[/C][C]2.7482[/C][C]0.003935[/C][/ROW]
[/TABLE]
Source: https://freestatistics.org/blog/index.php?pk=60956&T=1

Globally Unique Identifier (entire table): ba.freestatistics.org/blog/index.php?pk=60956&T=1

As an alternative you can also use a QR Code:  

The GUIDs for individual cells are displayed in the table below:

Autocorrelation Function
Time lag kACF(k)T-STATP-value
1-0.054723-0.42740.335296
2-0.221632-1.7310.044254
3-0.242414-1.89330.031531
4-0.169728-1.32560.094954
50.2309981.80420.038072
60.2243711.75240.042366
70.2174141.69810.047297
8-0.109349-0.8540.198212
9-0.225849-1.76390.041375
10-0.271821-2.1230.01891
11-0.011271-0.0880.465072
120.6798565.30981e-06
13-0.051633-0.40330.344082
14-0.199969-1.56180.061753
15-0.278212-2.17290.016841
16-0.123269-0.96280.169734
170.1865041.45660.075172
180.1233360.96330.169604
190.1563751.22130.113331
20-0.104702-0.81770.208343
21-0.238808-1.86520.033486
22-0.205734-1.60680.056627
23-0.039742-0.31040.378661
240.4879333.81090.000162
25-0.037195-0.29050.386208
26-0.159275-1.2440.109133
27-0.192795-1.50580.068642
28-0.087445-0.6830.248608
290.1331641.040.151212
300.1090370.85160.198881
310.0890440.69550.244704
32-0.071939-0.56190.288135
33-0.161985-1.26510.105315
34-0.117733-0.91950.180722
35-0.034561-0.26990.394064
360.3518712.74820.003935


Partial Autocorrelation Function
Time lag kPACF(k)T-STATP-value
1-0.054723-0.42740.335296
2-0.225301-1.75970.04174
3-0.284875-2.22490.014897
4-0.311983-2.43670.008878
50.0339190.26490.395985
60.0997930.77940.219377
70.2999652.34280.011209
80.1565591.22280.113061
90.0904980.70680.241188
10-0.228672-1.7860.039536
11-0.26877-2.09920.019974
120.4844543.78370.000177
13-0.102253-0.79860.213805
14-0.172175-1.34470.091846
15-0.171085-1.33620.093221
160.0507210.39610.346692
17-0.018063-0.14110.444138
18-0.143615-1.12170.1332
19-0.07734-0.6040.274027
20-0.018905-0.14770.441552
21-0.079114-0.61790.26947
220.0452990.35380.362357
23-0.15138-1.18230.120834
24-0.068228-0.53290.298027
25-0.100539-0.78520.217678
26-0.003393-0.02650.489472
270.0811460.63380.264299
28-0.016744-0.13080.448193
29-0.06336-0.49490.311238
300.0764440.59710.276342
31-0.045725-0.35710.361116
32-0.038222-0.29850.383159
33-0.063272-0.49420.31148
340.0074280.0580.476964
35-0.098812-0.77170.221623
36-0.109973-0.85890.196875

\begin{tabular}{lllllllll}
\hline
Partial Autocorrelation Function \tabularnewline
Time lag k & PACF(k) & T-STAT & P-value \tabularnewline
1 & -0.054723 & -0.4274 & 0.335296 \tabularnewline
2 & -0.225301 & -1.7597 & 0.04174 \tabularnewline
3 & -0.284875 & -2.2249 & 0.014897 \tabularnewline
4 & -0.311983 & -2.4367 & 0.008878 \tabularnewline
5 & 0.033919 & 0.2649 & 0.395985 \tabularnewline
6 & 0.099793 & 0.7794 & 0.219377 \tabularnewline
7 & 0.299965 & 2.3428 & 0.011209 \tabularnewline
8 & 0.156559 & 1.2228 & 0.113061 \tabularnewline
9 & 0.090498 & 0.7068 & 0.241188 \tabularnewline
10 & -0.228672 & -1.786 & 0.039536 \tabularnewline
11 & -0.26877 & -2.0992 & 0.019974 \tabularnewline
12 & 0.484454 & 3.7837 & 0.000177 \tabularnewline
13 & -0.102253 & -0.7986 & 0.213805 \tabularnewline
14 & -0.172175 & -1.3447 & 0.091846 \tabularnewline
15 & -0.171085 & -1.3362 & 0.093221 \tabularnewline
16 & 0.050721 & 0.3961 & 0.346692 \tabularnewline
17 & -0.018063 & -0.1411 & 0.444138 \tabularnewline
18 & -0.143615 & -1.1217 & 0.1332 \tabularnewline
19 & -0.07734 & -0.604 & 0.274027 \tabularnewline
20 & -0.018905 & -0.1477 & 0.441552 \tabularnewline
21 & -0.079114 & -0.6179 & 0.26947 \tabularnewline
22 & 0.045299 & 0.3538 & 0.362357 \tabularnewline
23 & -0.15138 & -1.1823 & 0.120834 \tabularnewline
24 & -0.068228 & -0.5329 & 0.298027 \tabularnewline
25 & -0.100539 & -0.7852 & 0.217678 \tabularnewline
26 & -0.003393 & -0.0265 & 0.489472 \tabularnewline
27 & 0.081146 & 0.6338 & 0.264299 \tabularnewline
28 & -0.016744 & -0.1308 & 0.448193 \tabularnewline
29 & -0.06336 & -0.4949 & 0.311238 \tabularnewline
30 & 0.076444 & 0.5971 & 0.276342 \tabularnewline
31 & -0.045725 & -0.3571 & 0.361116 \tabularnewline
32 & -0.038222 & -0.2985 & 0.383159 \tabularnewline
33 & -0.063272 & -0.4942 & 0.31148 \tabularnewline
34 & 0.007428 & 0.058 & 0.476964 \tabularnewline
35 & -0.098812 & -0.7717 & 0.221623 \tabularnewline
36 & -0.109973 & -0.8589 & 0.196875 \tabularnewline
\hline
\end{tabular}
%Source: https://freestatistics.org/blog/index.php?pk=60956&T=2

[TABLE]
[ROW][C]Partial Autocorrelation Function[/C][/ROW]
[ROW][C]Time lag k[/C][C]PACF(k)[/C][C]T-STAT[/C][C]P-value[/C][/ROW]
[ROW][C]1[/C][C]-0.054723[/C][C]-0.4274[/C][C]0.335296[/C][/ROW]
[ROW][C]2[/C][C]-0.225301[/C][C]-1.7597[/C][C]0.04174[/C][/ROW]
[ROW][C]3[/C][C]-0.284875[/C][C]-2.2249[/C][C]0.014897[/C][/ROW]
[ROW][C]4[/C][C]-0.311983[/C][C]-2.4367[/C][C]0.008878[/C][/ROW]
[ROW][C]5[/C][C]0.033919[/C][C]0.2649[/C][C]0.395985[/C][/ROW]
[ROW][C]6[/C][C]0.099793[/C][C]0.7794[/C][C]0.219377[/C][/ROW]
[ROW][C]7[/C][C]0.299965[/C][C]2.3428[/C][C]0.011209[/C][/ROW]
[ROW][C]8[/C][C]0.156559[/C][C]1.2228[/C][C]0.113061[/C][/ROW]
[ROW][C]9[/C][C]0.090498[/C][C]0.7068[/C][C]0.241188[/C][/ROW]
[ROW][C]10[/C][C]-0.228672[/C][C]-1.786[/C][C]0.039536[/C][/ROW]
[ROW][C]11[/C][C]-0.26877[/C][C]-2.0992[/C][C]0.019974[/C][/ROW]
[ROW][C]12[/C][C]0.484454[/C][C]3.7837[/C][C]0.000177[/C][/ROW]
[ROW][C]13[/C][C]-0.102253[/C][C]-0.7986[/C][C]0.213805[/C][/ROW]
[ROW][C]14[/C][C]-0.172175[/C][C]-1.3447[/C][C]0.091846[/C][/ROW]
[ROW][C]15[/C][C]-0.171085[/C][C]-1.3362[/C][C]0.093221[/C][/ROW]
[ROW][C]16[/C][C]0.050721[/C][C]0.3961[/C][C]0.346692[/C][/ROW]
[ROW][C]17[/C][C]-0.018063[/C][C]-0.1411[/C][C]0.444138[/C][/ROW]
[ROW][C]18[/C][C]-0.143615[/C][C]-1.1217[/C][C]0.1332[/C][/ROW]
[ROW][C]19[/C][C]-0.07734[/C][C]-0.604[/C][C]0.274027[/C][/ROW]
[ROW][C]20[/C][C]-0.018905[/C][C]-0.1477[/C][C]0.441552[/C][/ROW]
[ROW][C]21[/C][C]-0.079114[/C][C]-0.6179[/C][C]0.26947[/C][/ROW]
[ROW][C]22[/C][C]0.045299[/C][C]0.3538[/C][C]0.362357[/C][/ROW]
[ROW][C]23[/C][C]-0.15138[/C][C]-1.1823[/C][C]0.120834[/C][/ROW]
[ROW][C]24[/C][C]-0.068228[/C][C]-0.5329[/C][C]0.298027[/C][/ROW]
[ROW][C]25[/C][C]-0.100539[/C][C]-0.7852[/C][C]0.217678[/C][/ROW]
[ROW][C]26[/C][C]-0.003393[/C][C]-0.0265[/C][C]0.489472[/C][/ROW]
[ROW][C]27[/C][C]0.081146[/C][C]0.6338[/C][C]0.264299[/C][/ROW]
[ROW][C]28[/C][C]-0.016744[/C][C]-0.1308[/C][C]0.448193[/C][/ROW]
[ROW][C]29[/C][C]-0.06336[/C][C]-0.4949[/C][C]0.311238[/C][/ROW]
[ROW][C]30[/C][C]0.076444[/C][C]0.5971[/C][C]0.276342[/C][/ROW]
[ROW][C]31[/C][C]-0.045725[/C][C]-0.3571[/C][C]0.361116[/C][/ROW]
[ROW][C]32[/C][C]-0.038222[/C][C]-0.2985[/C][C]0.383159[/C][/ROW]
[ROW][C]33[/C][C]-0.063272[/C][C]-0.4942[/C][C]0.31148[/C][/ROW]
[ROW][C]34[/C][C]0.007428[/C][C]0.058[/C][C]0.476964[/C][/ROW]
[ROW][C]35[/C][C]-0.098812[/C][C]-0.7717[/C][C]0.221623[/C][/ROW]
[ROW][C]36[/C][C]-0.109973[/C][C]-0.8589[/C][C]0.196875[/C][/ROW]
[/TABLE]
Source: https://freestatistics.org/blog/index.php?pk=60956&T=2

Globally Unique Identifier (entire table): ba.freestatistics.org/blog/index.php?pk=60956&T=2

As an alternative you can also use a QR Code:  

The GUIDs for individual cells are displayed in the table below:

Partial Autocorrelation Function
Time lag kPACF(k)T-STATP-value
1-0.054723-0.42740.335296
2-0.225301-1.75970.04174
3-0.284875-2.22490.014897
4-0.311983-2.43670.008878
50.0339190.26490.395985
60.0997930.77940.219377
70.2999652.34280.011209
80.1565591.22280.113061
90.0904980.70680.241188
10-0.228672-1.7860.039536
11-0.26877-2.09920.019974
120.4844543.78370.000177
13-0.102253-0.79860.213805
14-0.172175-1.34470.091846
15-0.171085-1.33620.093221
160.0507210.39610.346692
17-0.018063-0.14110.444138
18-0.143615-1.12170.1332
19-0.07734-0.6040.274027
20-0.018905-0.14770.441552
21-0.079114-0.61790.26947
220.0452990.35380.362357
23-0.15138-1.18230.120834
24-0.068228-0.53290.298027
25-0.100539-0.78520.217678
26-0.003393-0.02650.489472
270.0811460.63380.264299
28-0.016744-0.13080.448193
29-0.06336-0.49490.311238
300.0764440.59710.276342
31-0.045725-0.35710.361116
32-0.038222-0.29850.383159
33-0.063272-0.49420.31148
340.0074280.0580.476964
35-0.098812-0.77170.221623
36-0.109973-0.85890.196875


Parameters (Session):
par1 = 36 ; par2 = 1 ; par3 = 0 ; par4 = 0 ; par5 = 12 ; par6 = MA ; par7 = 0.95 ;
Parameters (R input):
par1 = 36 ; par2 = 1 ; par3 = 0 ; par4 = 0 ; par5 = 12 ; par6 = MA ; par7 = 0.95 ;
R code (references can be found in the software module):
if (par1 == 'Default') {
par1 = 10*log10(length(x))
} else {
par1 <- as.numeric(par1)
}
par2 <- as.numeric(par2)
par3 <- as.numeric(par3)
par4 <- as.numeric(par4)
par5 <- as.numeric(par5)
if (par6 == 'White Noise') par6 <- 'white' else par6 <- 'ma'
par7 <- as.numeric(par7)
if (par2 == 0) {
x <- log(x)
} else {
x <- (x ^ par2 - 1) / par2
}
if (par3 > 0) x <- diff(x,lag=1,difference=par3)
if (par4 > 0) x <- diff(x,lag=par5,difference=par4)
bitmap(file='pic1.png')
racf <- acf(x, par1, main='Autocorrelation', xlab='time lag', ylab='ACF', ci.type=par6, ci=par7, sub=paste('(lambda=',par2,', d=',par3,', D=',par4,', CI=', par7, ', CI type=',par6,')',sep=''))
dev.off()
bitmap(file='pic2.png')
rpacf <- pacf(x,par1,main='Partial Autocorrelation',xlab='lags',ylab='PACF')
dev.off()
(myacf <- c(racf$acf))
(mypacf <- c(rpacf$acf))
lengthx <- length(x)
sqrtn <- sqrt(lengthx)
load(file='createtable')
a<-table.start()
a<-table.row.start(a)
a<-table.element(a,'Autocorrelation Function',4,TRUE)
a<-table.row.end(a)
a<-table.row.start(a)
a<-table.element(a,'Time lag k',header=TRUE)
a<-table.element(a,hyperlink('basics.htm','ACF(k)','click here for more information about the Autocorrelation Function'),header=TRUE)
a<-table.element(a,'T-STAT',header=TRUE)
a<-table.element(a,'P-value',header=TRUE)
a<-table.row.end(a)
for (i in 2:(par1+1)) {
a<-table.row.start(a)
a<-table.element(a,i-1,header=TRUE)
a<-table.element(a,round(myacf[i],6))
mytstat <- myacf[i]*sqrtn
a<-table.element(a,round(mytstat,4))
a<-table.element(a,round(1-pt(abs(mytstat),lengthx),6))
a<-table.row.end(a)
}
a<-table.end(a)
table.save(a,file='mytable.tab')
a<-table.start()
a<-table.row.start(a)
a<-table.element(a,'Partial Autocorrelation Function',4,TRUE)
a<-table.row.end(a)
a<-table.row.start(a)
a<-table.element(a,'Time lag k',header=TRUE)
a<-table.element(a,hyperlink('basics.htm','PACF(k)','click here for more information about the Partial Autocorrelation Function'),header=TRUE)
a<-table.element(a,'T-STAT',header=TRUE)
a<-table.element(a,'P-value',header=TRUE)
a<-table.row.end(a)
for (i in 1:par1) {
a<-table.row.start(a)
a<-table.element(a,i,header=TRUE)
a<-table.element(a,round(mypacf[i],6))
mytstat <- mypacf[i]*sqrtn
a<-table.element(a,round(mytstat,4))
a<-table.element(a,round(1-pt(abs(mytstat),lengthx),6))
a<-table.row.end(a)
}
a<-table.end(a)
table.save(a,file='mytable1.tab')